A restricted multiplier dea model for identifying best practices for attracting students into a mexican university case study: ENCSH at ITESM
113
0
0
Texto completo
(2) INSTITUTO TECNOLÓGICO Y DE ESTUDIOS SUPERIORES DE MONTERREY CAMPUS MONTERREY ESCUELA DE INGENIERÍA Y TECNOLOGÍAS DE INFORMACIÓN PROGRAMA DE GRADUADOS EN INGENIERÍA Los miembros del comité de tesis recomendamos que el presente proyecto de tesis presentado por Sonia Valeria Aviles Sacoto sea aceptado como requisito parcial para obtener el grado académico de:. MAESTRO EN CIENCIAS CON ESPECIALIDAD EN SISTEMAS DE CALIDAD Y PRODUCTIVIDAD Comité de Tesis:. Dr. Humberto Cantú Delgado Asesor. Dr. David Güemes Castoreña Sinodal - Co-Asesor Nacional. Dr. Wade D. Cook Sinodal - Co-Asesor Internacional. Aprobado:. Dr. Neale Ricardo Smith Cornejo Director - Maestría en Ciencias con Especialidad en Sistemas de Calidad y Productividad Mayo, 2012.
(3) A RESTRICTED MULTIPLIER DEA MODEL FOR IDENTIFYING BEST PRACTICES FOR ATTRACTING STUDENTS INTO A MEXICAN UNIVERSITY CASE STUDY: ENCSH AT ITESM. POR: SONIA VALERIA AVILÉS SACOTO. TESIS. PRESENTADA AL PROGRAMA DE GRADUADOS EN INGENIERÍA ESTE TRABAJO ES REQUISITO PARCIAL PARA OBTENER EL GRADO ACADEMICO DE MAESTRO EN CIENCIAS CON ESPECIALIDAD EN SISTEMASDE CALIDAD Y PRODUCTIVIDAD. INSTITUTO TECNOLÓGICO Y DE ESTUDIOS SUPERIORES DE MONTERREY. Mayo, 2012.
(4) DEDICATION To GOD, for his love, guidance and blessing. To Virgin Mary, for her protection and for being the guide on my way. To my parents Jaime and Sonia, for their unconditional love and support, for being my guide and for their advice in every moment of my life. My sister Estefanía Caridad, my best friend, for her advice and teachings which have generated strengths in my life. To my family, for supporting me to go ahead, for giving me encouragement and the inspiration to go far.. i.
(5) ACKNOWLEDGMENTS A God, for giving me the blessing to come to Mexico to fulfill a dream, a goal I always wanted to achieve, my graduate studies abroad. Instituto Tecnológico y de Estudios Superiores Monterrey (ITESM), Monterrey Campus, for giving me the scholarship of excellence for my graduate studies in such a prestigious institution. CONACYT, for giving me the maintenance scholarship to support during the entire period of my masters, and give the grant to study in Toronto, Canada. Dr. José Humberto Cantú Delgado, teacher and supervisor, for his support, advice in carrying out this work, and for their support with the research grant. Dr. David Güemes Castorena, teacher and co-advisor of thesis, for his support and knowledge shared to me to develop my thesis and for his advice weekly to carry out this research work. Dr. Wade Douglas Cook, co-advisor of thesis, for his support during the research internship in Canada, and for his valuable teaching and contributions for this research work. MSc Eng Geovanny Romero Rivera, friend and counselor, a big thanks for help me to get to Mexico and do study my masters. Also, for his friendship, to share knowledge without reservations, for their constant advice and for their interest that I go ahead. Dr. Neal Smith, teacher, director of the master MCP, thanks for the support and teaching for the Masters. MIP Eng. Talia Nadia Del Angel Loredo, for provide me the necessary assistance and information to carry out my research. My friends Diego Cordero, Nelda Moreno, Zamira Del Valle, Josefina Juárez, Zyanya Maldonado, Rubí Martínez, Ismael Minchala, Jorge Rosero, Samuel Santillán, Carlos Lopez, Enrique Cuan y Ruben Marbán, for their friendship and sincerity, and for being a great support during my stay in Mexico. Family Aguilar – Rosas, a special thanks for their great help and support during my stay in Canada. Family Moreno-Sanchez, thanks for their support during an especial moment in my life in Mexico.. ii.
(6) SUMMARY The long-term survival in an organization depends on and requires practices and features which create competitive advantage and differentiators from their peers, allowing more clients to become attracted to them. This implies that an organization has market-oriented practices which help not only to understand what their customers want from them, but also what attracts them. This thesis is focused on identifying a methodology which could contribute to establishing best practices that can have an impact on the organization, giving them a competitive advantage. This requires recognizing those dominant players and their practices, which could be adopted in order to become a ‘choice’ to prospective customers. It is here that DEA plays an important role, because it lets the organization be compared to its competitors, and can thus determine those peer institutions whose practices, if they are adopted, would help it to fulfill its purpose to be a better option in the market place. This research is presented in the form of a case study, aimed at identifying ways to improve the performance of a particular institution, the Business school from ITESM – ENCSH from the Spanish “Escuela de Negocios, Ciencias Sociales y Humanidades” (ENCSH), in terms of its ability to attract students. The structure of the study is as follows: Chapter 1 describes briefly general information about the case study, and the relevant characteristics about the structure of thesis. Chapter 2 includes the methodology to be carried out in this thesis and all the steps to analyze the data, ultimately aimed at identifying best practices. Chapter 3 reviews the literature necessary to complement the research. It is divided in three areas: benchmarking, best practices and efficiency modeling (DEA). Chapter 4 includes the application of the methodology using DEA models for evaluating the relative efficiency to the Business School – ENCSH from ITESM; in addition, this chapter includes a new DEA model to evaluate the relative efficiencies of the different business schools. Chapter 5 shows the results obtained in the study and the conclusions obtained by this research and the methodology applied.. iii.
(7) 1. Table of Contents. 1. Table of Contents .................................................................................................... iv. 2. Table of Figures ...................................................................................................... vii. 3. Table of Tables ...................................................................................................... viii. 1. CHAPTER 1: INTRODUCTION .............................................................................. 1. 2. 1.1. Background ........................................................................................................ 1. 1.2. Problem definition .............................................................................................. 1. 1.3. Objectives........................................................................................................... 2. 1.3.1. General objective:.............................................................................................. 2. 1.3.2. Specific objectives: ............................................................................................ 2. 1.4. Research questions........................................................................................... 2. 1.5. Justification......................................................................................................... 3. 1.6. Structure of the thesis ....................................................................................... 3. 1.7. Scope and limitations ........................................................................................ 4. CHAPTER 2: METHODOLOGY.............................................................................. 6 2.1. Introduction......................................................................................................... 6. 2.2. Statement of the problem and objectives ........................................................ 6. 2.3. Type of study...................................................................................................... 6. 2.4. Literature review ................................................................................................ 7. 2.5. Data collection: Identifying relevant predictors of success as a HEI ............ 7. 2.6. Modeling efficiency and identifying benchmarks ............................................ 7. 2.6.1. Selecting inputs and outputs (1)..................................................................... 8. 2.6.2. Model selection (2) ............................................................................................ 8. 2.6.3. Software application (3) ................................................................................... 8. 2.6.4. Benchmarking and target setting (4) ............................................................. 8. 2.7 3. Determining best practices ............................................................................... 9. CHAPTER 3: LITERATURE REVIEW .................................................................. 10 3.1 Part I: An in-depth review of the variables considered by undergraduate students when choosing a college or university...................................................... 10 iv.
(8) 3.2. Part II: Benchmarking...................................................................................... 18. 3.2.1. Difference between benchmarking and competitive analysis ............... 19. 3.2.2. Defining core competencies.......................................................................... 20. 3.2.3. Types of benchmarking ................................................................................. 20. 3.2.4. The benchmarking process ........................................................................... 21. 3.2.5. Traps to benchmarking ................................................................................. 22. 3.2.6. Important considerations................................................................................ 23. 3.2.7. Purposes of benchmarking............................................................................ 23. 3.3. Part III: Data Envelopment Analysis (DEA) model ....................................... 23. 3.3.1. Background and DEA concept ..................................................................... 23. 3.3.2. How does DEA work?..................................................................................... 24. 3.3.3. Decision variables ........................................................................................... 24. 3.3.4 Specifying the input and output model is the most critical aspect of this process 25 3.3.5. DEA modeling .................................................................................................. 26. 3.3.6. The CCR model and dual problem .............................................................. 28. 3.3.7. Cases for CCR model..................................................................................... 29. 3.3.8. Output-oriented model .................................................................................... 31. 3.3.9. Assurance region ............................................................................................ 34. 3.3.10 DEA as a benchmarking tool ........................................................................ 34 3.4. 4. Part IV: Best practices for attracting students............................................... 35. 3.4.1. Best practices process .................................................................................. 36. 3.4.2. Best practices characteristics ....................................................................... 38. 3.4.3. Levels of best practices.................................................................................. 38. 3.4.4. Journey to excellence ..................................................................................... 38. CHAPTER 4: CASE STUDY ................................................................................. 41 4.1 Applying a Restricted Multiplier DEA Model to Escuela de Negocios, Ciencias Sociales y Humanidades (ENCSH) at ITESM, a Higher Education Institution in Mexico ................................................................................................... 41 4.2. Results obtained by the survey applied to ENCSH Students ..................... 42. v.
(9) 4.3. Inputs and outputs considered for the case under study ............................. 54. 4.4. Efficiency modeling ......................................................................................... 58. 4.4.1. A conventional approach to efficiency modeling ...................................... 59. 4.4.2. An alternative approach to efficiency: Dual role factors ......................... 65. 4.5. 5. Identifying best practices ................................................................................ 70. 4.5.1. Eli Broad College of Business ...................................................................... 70. 4.5.2. Best practices ................................................................................................... 72. 4.5.3. List of best practices ....................................................................................... 74. CHAPTER 5: CONCLUSIONS .............................................................................. 84 5.1. The Issues ........................................................................................................ 84. 5.2. The results........................................................................................................ 84. 5.3. Conclusions of the research ........................................................................... 86. 5.4. Contributions .................................................................................................... 87. 5.5. Future studies .................................................................................................. 88. 6. REFERENCES ....................................................................................................... 89. 7. APENDIX ................................................................................................................. 93 7.1. Apendix 1: Copy of the questionnaire............................................................ 93. 7.2. APENDIX 2: Solving DEA by applying softwares ......................................... 98. vi.
(10) 2. Table of Figures. Figure 1: Chart of the problem definition .................................................................................. 2 Figure 2: Structure of the thesis project .................................................................................... 4 Figure 3: Workflow for the thesis research ............................................................................... 6 Figure 4: Process of modeling efficiency................................................................................... 8 Figure 5: Ray projected through the origin .............................................................................. 29 Figure 6: Efficient frontier: Case single input & output [26] ................................................... 29 Figure 7: Improvement of DMU A by input reduction [26] ..................................................... 30 Figure 8: Efficient frontier: Two inputs and one output case [26] .......................................... 31 Figure 9: Improvement of DMU A by output expansion ......................................................... 32 Figure 10: Efficient frontier: One input and two outputs case [26] ........................................ 33 Figure 11: Knowledge transfer ................................................................................................. 38 Figure 12: Population under study and their majors .............................................................. 43 Figure 13: Percentage of the enrolment level from students participating in the study ...... 44 Figure 14: Frequency of the criteria on how students evaluate an institution ...................... 45 Figure 15: Percentage of the institutions from which students collected information ......... 46 Figure 16: Percentage of students ' preference of the institutions to which students applied for................................................................................................................................................ 48 Figure 17: Percentage of the information considered important for students ...................... 49 Figure 18: Frequency of the most important issues considered by students....................... 51 Figure 19: The most important issues considered by students when choosing a university .................................................................................................................................................... 52 Figure 20: Frequency of the media used by students to get promotional information about institutions .................................................................................................................................. 53 Figure 21: Frequency of other stakeholders influencing students' decision ........................ 53 Figure 22: Propose output-oriented model ............................................................................. 60 Figure 23: Results for ENCSH ................................................................................................. 65 Figure 24: An alternative approach to efficiency ................................................................... 66 Figure 25: Eli Broad College of Business Facebook social networking ............................... 76 Figure 26: Eli Broad College of Business Linked In social networking................................. 77 Figure 27: Eli Broad College of Business Twitter social networking..................................... 77. vii.
(11) 3. Table of Tables. Table 1: Number of universities operating around the world [6]............................................ 11 Table 2: Weight considered by students when choosing a college ..................................... 12 Table 3: Number of universities and tertiary education entry rate in countries members of OECD [6, 11] ............................................................................................................................. 14 Table 4: Enrolment in tertiary in public and private institutions [15] ..................................... 16 Table 5: Single input and single output [26]............................................................................ 29 Table 6: Types of best practices [35] ...................................................................................... 36 Table 7: Best practices incentives [36].................................................................................... 38 Table 8: Total student enrolment at ITESM ............................................................................ 41 Table 9: Total student enrolment at ENCSH from 2010 to 2011 .......................................... 41 Table 10: Ranking of ITESM in terms of social and business faculty ................................... 42 Table 11: Students and their career at ENCSH participating in the study ........................... 43 Table 12: Semester of the students participating in the study .............................................. 44 Table 13: Criteria for evaluate an institution ........................................................................... 45 Table 14: List of institutions from which students collected information about .................... 46 Table 15: List of other worldwide universities from where students collected information . 47 Table 16: List of institutions to which students applied for .................................................... 48 Table 17: Important information collected by students .......................................................... 49 Table 18: Students' criteria about the most important issues considered when selecting a university .................................................................................................................................... 50 Table 19: Frequency of how issues were considered by students when evaluating an institution .................................................................................................................................... 51 Table 20: Media from which students got promotional information about institutions......... 52 Table 21: Stakeholders influencing students' decision .......................................................... 53 Table 22: Original data from American universities and ITESM ........................................... 61 Table 23: Efficiency scores (%) for the current asset model ................................................. 64 Table 24: Enrolment at Eli Broad College of Business .......................................................... 70 Table 25: Admissions in the business program...................................................................... 71 Table 26: Percentage of business classes ............................................................................. 71 Table 27: Course enrolment at Broad College of Business .................................................. 71 Table 28: Job offers for students from Broad College of Business ...................................... 72 Table 29: Percentage of graduate students who accepted job in different functional areas .................................................................................................................................................... 72. viii.
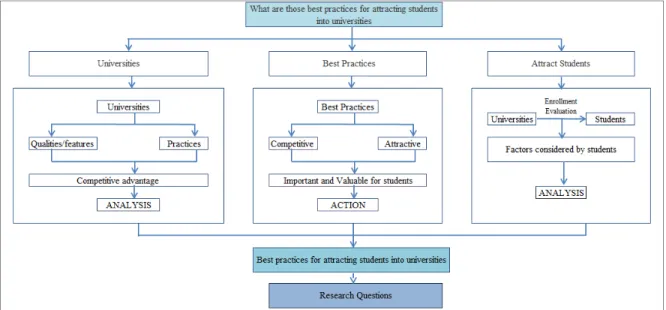
(12) 1 CHAPTER 1: INTRODUCTION 1.1 Background Currently worldwide, there has been a rapid growth in the offerings of the universities and colleges. When applying to a university, students tend to focus on the results that they could gain after their studies. Therefore, there is an opportunity for institutions within the Higher Education market to adopt or increase their interests in certain features, characteristics, and competitive differentiators, which are attractive for students when they are selecting a university. In this situation, the Instituto Tecnológico y de Estudios Superiores Monterrey (ITESM), an institution that has been characterized by being within the world ranking of the best universities, cannot afford to lose student demand, and one way is to meet the needs and requirements of those students. It is here where the question arises: What are the best practices for attracting students into universities? Studies of this type, which are included within the economics of education, are needed in order for institutions like ITESM to take appropriate action. This will enable ITESM to gain ground relative to those institutions that possess and know how to make effective use of the information provided by their customers, namely their "Students”.. 1.2 Problem definition This thesis addresses the following question: What are the best practices for attracting students into universities? Worldwide, Higher Education Institutions (HEI’s) require information about all features, factors or practices that all of their futures clients, their students, will consider. For that reason it is very important that every institution have marketoriented practices which help not only to understand what students want from them, but also what attracts them to an institution. To examine the above question in the context of higher education, we need to look at three issues: Issue 1: Which university appears to dominate in attracting students in the market in which ITESM competes? Issue 2: What are the best practices of those dominant players? Issue 3: Within those best practices, which are the most important to students? The following figure will describe the problem definition of this research thesis. 1.
(13) Figure 1: Chart of the problem definition. 1.3 Objectives 1.3.1 General objective: The general objective is to apply a benchmarking tool aimed at identifying those institutions that appear to be following best practices for attracting students into Mexican universities. This is done by way of a case study focused on ITESM.. 1.3.2 Specific objectives: 1. Provide an in-depth research and analysis involving the factors and elements considered by students at the time of choosing a university. 2. Apply an extended version of a benchmarking tool called Data Envelopment Analysis (DEA) to a large set of universities including ITESM. This will aid in identifying those institutions that are the leaders in education, in the sense that they are providing the most attractive features for their students. At the same time, the benchmarking tool will provide a measure as to where ITESM stands relative to those best performers. 3. Propose a list of best practices and plans that can be adopted by the ITESM.. 1.4 Research questions 1. What are the main characteristics or factors considered important by students when selecting a university or college? 2. How can one identify those universities that are most attractive to students?. 2.
(14) 2.1 Where does ITESM stand relative to those factors considered by students to be important? 2.2 Where should be the university under study be positioned in order to be considered efficient? 3. What are the main differences between the university under study and those for which the benchmarks were developed? 4. What are the best practices applied by the “best universities” to attract students?. 1.5 Justification The universities have realized that their long-term survival depends on how well they serve their customers. At the same time, it is necessary for institutions to adopt a variety of methods, practices, features or characteristics, which will allow them to be at the same level as their peers. One of the problems faced by educational institutions is that in most cases, their assessment data regarding the service and what their customers expect, are out of date or refer to what “has been” done. The data often do not focus on what is happening now or that may happen in the future. Hence, to survive in a competitive market and increase the attraction of students to the HEI under study, ITESM, it is necessary to determine those practices whose implementation will attract students. For this, it is necessary to determine the practices of ITESM’s peers, and then try to adopt them in order to become a university of ‘choice’ to prospective students. It is here that DEA plays an important role. DEA allows the organization to be compared to its competitors, and can thus determine those peer universities whose practices, if adopted by ITESM, would help it to fulfill its purpose to be a better option in the market place.. 1.6 Structure of the thesis The method to reach the objective of this research has been divided in four main areas, which are literature research, data collection, the application of tools and results of the previous steps. 1. The literature research is a critical first step because it provides all the important information regarding the different issues reviewed in this research. Further, the information will be the base line for the steps that follow. 2. The data collected involves relevant information, which could be statistical or literary, required to reach the desired objective. 3. Two main tools are applied herein, namely (1) a survey of customers of the organizations under study, and (2) a software package “DEAFrontier.xlam” to get the results needed to get the desired results.. 3.
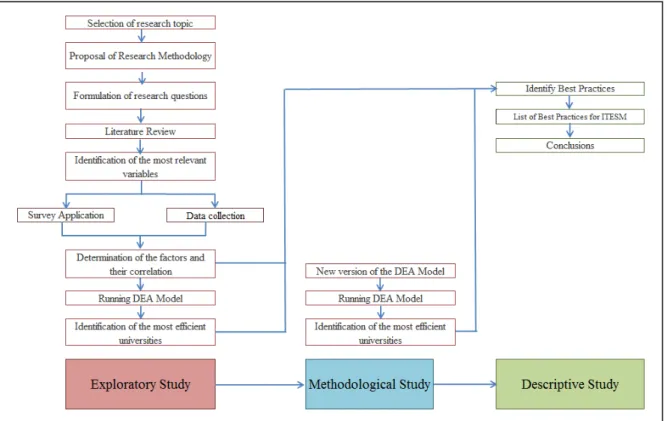
(15) 4. The results constitute the information relating to the objective of the research. In Figure 2 it is shows the scheme of this research work.. Figure 2: Structure of the thesis project. Those steps (boxes) linked by red lines give directly information to get the desired results. Those which blue lines, show the previous information already reviewed to continue with the research. Finally, those with green lines link the earlier results which are used in the future steps to reach the objective.. 1.7 Scope and limitations The scope of the investigation can be classified partially as descriptive and exploratory. Specifically, the research is presented in the form of a case study, aimed at identifying ways to improve the performance of a particular institution in terms of its ability to attract students. The study is supported by a major data collection initiative involving a large set of universities. In particular, data from the Business school – ENCSH from the Spanish “Escuela de Negocios, Ciencias Sociales y Humanidades” (ENCSH) from ITESM, will be used. The study aims to set specific benchmarks for that institution, as well as to put forward a list of recommended best practices. At present, there are no studies or cases such as this that apply efficiency measurement tools to higher education institutions, with the principal aim being the identification of best practices or opportunities for attracting students. The thesis, in addition to being exploratory and descriptive, also presents new methodology in the form of a modified DEA model. The need for this modification arises from the observation that the structure of the problem is one where the conventional input to output relationships, inherent or at least assumed, in the standard DEA approach, are not entirely applicable herein. This modification is detailed later. 4.
(16) To implement the resultant DEA model, we apply a particular software package "DEAFrontier.xlam" for Excel 2007 or 2010 with the excel standard solver, which includes a restricted multiplier model. In this way, it is possible to identify those universities that would be classified as efficient, provide a measure of efficiency for the university under study, and set targets for improvement.. 5.
(17) 2 CHAPTER 2: METHODOLOGY 2.1 Introduction This chapter describes the methodology to be carried out in the thesis. The following flow chart describes the steps constituting the methodology.. Figure 3: Workflow for the thesis research. 2.2 Statement of the problem and objectives The problem and objectives are clearly stated in Chapter 1. 2.3 Type of study The study here can be considered as involving three things: exploratory, descriptive and methodological. 1. Exploratory: DEA has been applied in many sectors and countries. An interesting sector is higher education. Although DEA has been part of many. 6.
(18) studies on higher education, there no study which focuses on determinating those institutions that have the best practices for attracting students. Therefore it is considered that this research with the application of this tool has high impact and results. For this reason the present research is exploratory in that the process and the tool have greater utility in identifying those opportunities to attract students. 2. Descriptive: this research is partly descriptive because it will describe all the properties and important features needed by a university to have the best chance attracting greater number of students. 3. Methodological: this study involves new methodology development in that a modified version of the DEA model will be presented.. 2.4 Literature review Chapter 3 will review the literature in three areas, namely: 1. Benchmarking 2. Best practicing 3. Efficiency modeling (DEA) This review is designed to acquaint the reader with these broad areas. In addition the review sheds light on how these areas, when taken together, allow not only for an evaluation of efficiency of each decision making unit (university), but also will identify benchmarks and subsequent delineation of best practices. This latter is particularly important in that the case study (Chapter 4) is intended to aid ITESM in improving its stature regarding its attractiveness to existing and prospective future students.. 2.5 Data collection: Identifying relevant predictors of success as a HEI Part of the literature review in the area of benchmarking uncovers those factors that other studies have identified as characterizing top performing HEIs. With that backdrop, the case study in Chapter 4 discusses the data collection initiative that was undertaken, with the specific purpose being to develop the appropriate information needed to evaluate relative efficiency of the HEIs considered.. 2.6 Modeling efficiency and identifying benchmarks A major part of Chapter 4 will be the application of the Data Envelopment Analysis (DEA) methodology described in Chapter 3. The following process chart identifies the steps to be followed.. 7.
(19) Figure 4: Process of modeling efficiency. 2.6.1 Selecting inputs and outputs (1) Using the data collected and relying on earlier literature for guidance, appropriate input and output factors will be selected.. 2.6.2 Model selection (2) Perhaps the most critical stage in any efficiency evaluation exercise is selecting the appropriate model. This is generally driven by the goals of the organization as well as by the inputs and outputs chosen. In the current setting, it will in fact be necessary to adapt the conventional DEA structure in order to properly capture the process.. 2.6.3 Software application (3) As indicated earlier, the software to be used is DEAFrontier.xlam. This software caters to a wide variety of model structures.. 2.6.4 Benchmarking and target setting (4) The outcome from running the software is an efficiency score for each of the institutions in the sample. This score indicates the gap between the performance of an institution and that of the best performers in the sample. The software also specifies which of those best performers, any given “inefficient” DMU should try to emulate. Finally, performance measures and targets for each inefficient DMU are provided.. 8.
(20) 2.7 Determining best practices In this step, after the benchmarking process has been completed for the institution under study (ITESM), a list of all the features will be examined to identify what can be adopted or what should be changed, in order to increase customer satisfaction. The greatest effort in the present investigation is to determine those practices to be used as a result of all the analysis among institutions, and which will aid in attracting clients to the organization. Finally, a list of all the best practices will be presented, with data or examples that will help to understand the importance of the adoption of these practices.. 9.
(21) 3 CHAPTER 3: LITERATURE REVIEW 3.1 Part I: An in-depth review of the variables considered by undergraduate students when choosing a college or university Higher education is viewed as a competitive attribute, which not only ensures the needed skills of human capital, but also the vehicle for acquiring advanced knowledge; essential elements for an economic growth in an organization [1]. However, students from high school are able to choose from among a great variety of offerings and competition has intensified. As a consequence, there has been a decrease in the student enrollments in some universities, which have historically experienced large numbers of consumers. In order to combat this situation, Colleges and Universities need to create an environment that contributes to increased enrollments. This requires focusing on what students consider important in their decision to apply to a specific institution. At this time, several questions arise: How do students choose a university? How do students search for information about them? How are students influenced by this information? How do students judge that information that they obtain in their search process? [2]. Morse & Flanigan [3], suggest that these questions lead to a comparisons of concrete factors that are considered by students. “Students should seek a school that fits their personal goals, values, and personalities” [4]. Although all universities make their best efforts, and each one has certain distinguishing features that could be attractive to students, most students apply to more than one university. Institutions fall into three groups (Brennan [2]): “a group of institutions that the student would like to attend, but which may not accept them, a group of institutions that the student would be able to attend but which the student would rather not apply to, and a group of institutions that the student would not apply to under any circumstances”. It is well know that in today’s environment, students seek data to make decisions about universities [5]; they look at many issues, and this situation has become much more complex than in the past with the continued growth in the number of higher education institutions available. Evidence of this assertion appears in the web page of Ranking Web of World Universities, offered by Web of Metrics, that shows the following table (Table 1), containing the number of universities around the world. Although universities and colleges are complex organizations with many features and qualities, they are subject to consumer choice or selection, where judgments are made on the basis of a broad range of ‘added value’ expectations [5]. The criteria for making selections among universities vary from one consumer or stakeholder to another, in this case the student. In this point, it is necessary to. 10.
(22) consider their psychology as a consumer, in order to ensure recruitment, retention and new enrollments. Table 1: Number of universities operating around the world [6] CONTINENT Africa. NUMBER OF COUNTRIES 47. NUMBER OF UNIVERSITIES 635. America. 41. 7,006. Asia. 45. 4,964. Europe. 54. 4,976. Oceania. 12. 135. The identification of features for the improvement of student recruitment requires answers to certain questions: “What are the customers’ needs?, How should those needs be addressed, and how can performance be improved” [6]. In this way, “organizations will have an effective development, and their future success will increasingly be determined by how they identify and satisfy their various customers”[7]. First of all, it is important to understand what encourages students to select a Higher Education Institution. An approach is to recognize those factors included in the behavior and the consumer decision-making process, which comes after moving through a number of stages and environments experienced by students. However, it is very important to emphasize the last stage, which is when students become part of the education product offered to the world, and this situation includes a significant contribution to them. Maguad [7] mentions that many people believe that “if you put good things together, something good will come out of it”. This phrase in the education context means that if universities want to improve their portfolios and reputation, and create strategies that meet the requirements of the consumer sector, using or acquiring their resources or eliminating those that aren’t relevant to students and are obstacles to attract students, it is necessary to get knowledge of what students consider important for choosing a university. Maguad [7] states that in these times, students are increasingly looking for more options and features from education offerings. Although, there is a huge number of alternatives around the world, students tend to concentrate on one institution that is able to meet their expectations, providing all the advantages that come from being enrolled there, and all of the opportunities for acquiring skills, gaining knowledge, and learning about the world. Statistics illustrated by Clinedinst & Hawkings [8] show that “students are submitting a greater number of applications, as a response to real and perceived increases in competition”. Furthermore there has been an increase in the number applying online.. 11.
(23) Institutional services and HEIs are different from the other services. This is because the labor market benefits from the knowledge and skills acquired by students and contributions they will make. For that reason, students are looking for a university which gives them confidence and drives them to pursue their dreams and desires in professional life [7]. Thus, students can be particularly attracted to a university that will produce a long-term positive effect in their lives. Briggs [5] and Stern [9] concluded that the majority of students make their college enrollment decision based on: 1. Educational and career aspirations where there is a match to what the college have to offer. 2. Financial attributes, especially because of the recession economy suffered in the last years. 3. Reputation in terms of student and professional life. 4. College information about life and school experience, which includes a personalized or customized communication to students, can achieve an edge against competitors. Stern [9] has proposed an approximation of the weights assigned to those characteristics considered by students, as shown in Table 2: Table 2: Weight considered by students when choosing a college CHARACTERISTICS. PERCENTAGE. Academic Programs. 55 %. Reputation. 15 %. Cost. 14%. Financial Aid. 9%. Students’ expectations show a continued increase. At this point, it is necessary that universities create strategies that will meet demand, and will create an attractive image to students, supported by quality and efficiency in their activities. Furthermore, Briggs [5] points out that there are different groups of stakeholders, who have the same level of importance as students, and who also consider many attributes from HEIs, and have a significant influence on the institutional decision. These stakeholders include parents, friends, guidance teachers, recruitment visits and schools advisors. For that reason, it is extremely important to find those relevant factors considered by all stakeholders. Student surveys have shown that one of the main factors influencing students’ college choice is the academic service. This includes intellectual emphasis, the approach to learning tasks, and the course options at the university related to the subject offerings or majors offered and the type of delivery (part time or full time study). In addition, it includes courses offered by distance education (external studies), or the emerging ‘virtual’ university courses available on the Internet [2]. 12.
(24) This caracteristic always depends on the level and type of aspiration and the student performance, and it has been demonstrated that when students believe that their studies will lead directly to accomplishing their goals, they are motivated to join that institution. Additionally, not all colleges and universities offer all possible combinations of majors, and therefore students with a strong sense of vocation will seek only those institutions that offer majors in their chosen career paths [2]. Students are looking for those colleges that offer activities as Di’Maria [4] suggests, such as “studying abroad, internships, or opportunities to enroll in courses outside the major, whether the departments have enough faculty members to provide different viewpoints and specialties within the major, and whether faculty members are accessible for academic advising, mentoring, and extra help”. Another factor of immense significance to students is the ‘Academic Reputation’, because of the educational product offered; statistics show that certain HEIs earned a reputation 50 to 100 years ago and remain famous. In fact, students want to be in a college where family or friends have already perceived socio-economic awards. There is also the sense of being part of a prestigious institution, where they will be able to develop skills and characteristics which contribute “added value” not only to closer family members, but also to the labor market. This situation causes many stakeholders to turn their minds to a given institution, resulting in loyalty toward that institution. In the research done by Brennan [2], she identifies three types of institution’s reputation: “General reputation which is not associated with any particular characteristics of an institution, academic reputation which is about academic programs and standards of the institution and, alumni reputation”, which is the “product” offered to the labor market”. However, these three elements converge into a single point that emphasizes the nature and extent of institutional products, characteristics of graduating students, success of alumni, research and scholarly publications, and public service. They are built on the assumption that “HEIs are accountable to society for what they produce and being judged on the basis of their demonstrated outcomes” [7]. “Then again, students should examine the college's faculty, how it has fared in surveys, check the Web site, and elicit feedback from alumni to determine if that reputation is earned or outdated” [9]. Students seek institutions according to their perceived ability to meet the requirements of the study programs, which will maximize the potential returns, socially or economically. Academic reputation or prestige is associated with the consumer behavior which faces two types of choices, the same as when people who buy prestige products buy them because they are not generally available to all. This happens in the same way with HEIs, in that the less selective the institution is, the more applications will follow, as students will apply to an. 13.
(25) institution that they believe will have them. In short, students consider the Admission rate from the institution which will allow the student to be enrolled or not. However, the higher level students will not take up places at the more accessible institutions, as they will gain places at more selective and therefore more desirable institutions. Thus, selection processes become part of the criteria for choosing an institution. On the other hand, “the student will choose to apply to an institution where they know in advance the probability of acceptance, and will not willingly choose to apply to an institution where they face being rejected by the admissions process” [2]. The next table helps to make a competitive analysis between countries in terms of the entry rate to higher or tertiary education: Table 3: Number of universities and tertiary education entry rate in countries members of OECD [6, 11] Country Australia Austria Belgium Canada Czech Republic Denmark Finland France Germany Greece Hungary Iceland Ireland Italy Japan. Number of universities 91 77 100 204 57 95 51 581 411 64 75 9 50 203 716. Percentage of entry rate 86 42 30 M 54 57 71 M 34 43 63 73 44 53 46. Country Korea Luxembourg Mexico Netherlands New Zealand Norway Poland Portugal Slovak Republic Spain Sweden Switzerland Turkey United Kingdom United States. Number of universities 398 4 906 160 45 67 433 111 33 236 50 107 162 233 3274. Percentage of entry rate 61 M 32 60 76 66 78 64 74 41 73 39 29 55 65. M: Data is not available. Another important consideration for students regarding the choosing of universities, is the “high requirements” advertised by the institution. It is well known that more prestigious “selective” universities ask for high A-level grades and high personal qualifications. Some studies have found that all institutions maintain a strong desire to recruit what they perceive to be the “most able” students[10].Thus, the promotion of excellence of the education service given by them will enhance their reputation in the market place. For that reason institutions may also compete for students, especially talented ones, who will represent potential future researchers, executives, politicians or ambassadors of their alma mater as well, playing a crucial role in shaping of an HEI’s reputation[11].. 14.
(26) The cost of education, in the form of tuition fees, constitutes a barrier when selecting a college or university. Such fees often represent the first consideration on the part of the student. Research has shown that many students give this top priority when applying to university. In the survey applied by Clinedinst & Hawkings[8], the result was that “many students and families were reevaluating college application plans and enrollment decisions with more weight placed on financial concerns”. Students now expect greater value for money. Many believe that by paying for an excellent education, they will earn economic rewards at the completion of their studies. This assertion is supported by many studies such as that by Jones [12]. He asserts that students expect that the cost of a superior education will be recovered by gaining enough knowledge to face the labor world and provide them the capability to earn good or excellent salaries. Mancheno [1] claims that in today’s environment “individuals acquire education in order to produce increasing economic returns”. On the other hand, many students strive to find those institutions which will provide financial aid to cover part or all their tuition. In this way, those students who have a higher Intelligence Quotient (IQ) receive scholarships and thereby acquire knowledge at lower costs. However, many will have to study in the most challenging and long career paths[1]. In his research, Stern [9] explains that because of the recessionary economy, students tend to think more about financial aid, or alternatively opt for public colleges and community colleges because of their lower tuition. In the Report of enrolment in private and public institutions it is easy to visualize the number of students, during 2008 and 2009, enrolled in HEIs. The next table shows a comparison of most of the countries analyzed by the Organization for Economic Cooperation and Development (OECD), a unique forum where governments work together to address the economic, social and environmental challenges of globalization.. 15.
(27) Table 4: Enrolment in tertiary in public and private institutions [15]. OECD COUNTRIES. Enrolment in tertiary Public & Private Country. 2008. 2009. 2008. 2009. Australia. 1'117,804. 1'199,845. 1’061,718. 1’129,810. Austria. 284,791. 308,150. 239,439. 256,721. Belgium. 401,652. 425,219. 174,716. 182,472. Canada. M. m. M. M. Chile. 804,981. m. 177,210. M. Czech Republic. 392,540. 416,847. 339,453. 356,681. Denmark. 230,707. 234,574. M. 230,498. Finland. 309,648. 296,691. 276,639. 248,298. France. 2'164,538. 2'172,855. 1'772,453. 1'763,806. Germany. M. m. 2'025,572. M. Greece. M. m. M. M. Hungary. 413,715. 397,679. 348,352. 333,042. Iceland. 16,631. 16,919. 13,125. 13,289. Ireland. 178,518. 182,609. 170,177. 176,894. Italy. 2'013,856. m. 1'873,893. M. Japan. 3'938,632. 3'874,224. 819,626. 817,802. Republic of Korea. 3'204,310. 3'219,216. 633,556. 629,838. Mexico. 2'623,367. 2'705,190. 1'749,053. 1'809,407. Netherlands. 602,286. 618,502. M. M. New Zealand. 244,355. 263,028. 214,865. 226,526. Norway. 212,672. 219,282. 182,944. M. Poland. 2'165,980. 2'149,998. 1'447,274. 1'432,711. Portugal. 376,917. 373,002. 284,333. 282,438. Slovakia. 229,477. 234,997. 204,931. 203,613. 1'781,019. 1'800,834. 1'530,124. 1'590,025. Sweden. 406,879. 422,580. 371,810. 384,714. Switzerland. 224,469. 233,488. 185,482. 192,692. Turkey. 2'532,622. m. 2'392,337. M. UKiogf Great Britain and Northern Ireland. 2'329,494. 2'415,217. M. M. United States of America. 18'248,124 19'102,814. 13'490,776. 13'972,153. Brazil. 5'958,135. 6'115,138. 1'676,214. 1'598,309. Estonia. 68,168. m. 10,800. M. Israel. 325,246. 342,707. 44,868. 47,228. Slovenia. 115,445. 114,391. 102,174. 100,673. Spain. PARTNER COUNTRIES. Enrolment in tertiary Public. m: Data is not available. 16.
(28) In spite of this, students should investigate private colleges and see how much financial aid is offered before discounting them; they consider attending public versus private colleges, because those are able to cover part or full of their fee tuition. An important feature linked with reputation is job placement. Morse & Flanigan [3]illustrate this fact with this phrase: “It’s the only time in your life where you can really get feedback on your efforts”. Graduate students have the expectation that as soon as they finish their studies at college or university, they will be able to find a good job, which will give them the opportunity to grow their professional lives. In order to get an adequate job, they need to gain knowledge that will enable them to function in the workplace. “It is fairly reasonable to say that service and manufacturing industries and other non-profit organizations are the major employers, and who expect that colleges and universities produce well-qualified and trained graduates who could work efficiently and effectively in the jobs for which they have been hired; they need workers who have communication and problem-solving skills and are willing and able to learn their specific jobs quickly and effectively” [7]. Additionally, another factor related to reputation is the Internships done by students. Academic work, structured work experiences, and internships are all valuable components of the career preparation process[13]. Furthermore, internships can be a strong attraction to students in times of shrinking enrollments because they enhance the school reputation and are a vehicle to assist in economic development outreach. Internship programs are positive and offer benefits to all parties involved: the student, the employer, and the HEI”[14]. The general objectives of an internship experience are to prepare students with realistic expectations of their future careers and to provide them with opportunities to polish career search skills, and to gain on-the-job experience. Internships give students many opportunities: they get a chance to apply classroom knowledge and experiences, reflect on individual strengths, weaknesses, and interests, network in the professional arena and familiarize themselves with a career-oriented setting[13].The levels of satisfaction that students relate to in their internships are important, because students considered Internships as a successful way when they are soon-to-be graduate students. Furthermore, they believe that their experiences gained through the internship contribute positively toward their development for careers in retailing. Understanding the factors associated with satisfying internships will enable educators to guide students toward satisfying internships, and retailers to develop optimal internship opportunities[13]. Stern [9] explains that the decision surrounding the choosing of a college is potentially influenced by the marketing and its strategies. The main tactics are the “Toured colleges in a range of 85% and Investigated the college by internet, which earn 20%, especially by Facebook or MySpace page”. The relevant information that should be exposed include careers services, facilities on campus, academic 17.
(29) programs of the institution, some information about the number of alumni who become famous after graduation, and the benefits that arise from being part of the prestigious group of students from the university. Students collect information from a variety of institutions in order to maximize their options, but they will only consider applying to a few of these[2], and finally will attend just one of them. Di’Maria [4] explains that “students are able to collect information when they walk around the campus, observe a class, visit the dorms, and eat in the cafeteria. In this way they are able to talk with current students, faculty, and financial aid and admission officers. It is even of greater interest for the student to be able to visit the school and attend classes in session so they can observe how classes operate. Finally they could join a club or a sport when they attend a meeting or practice; when students are having their college tours, they are able to have their own pre-determined plan of what they want to accomplish and what questions to ask”. There is a famous phrase mentioned by Stern [9] in his research, that shows how deeply marketing strategies influence students’ choices: "Try on the campus for 24 hours. See how you fit in”. The elements described above are the relevant factors considered by students when they are selecting a university. The study environment and all of the elements required to meet students’ needs, have to create a competitive context. Stern [4] mentions that “once a student has gathered information about a school, they evaluate the features and distinguish the important ones from the unimportant ones”. Briggs [5], explains that if universities could predict where applicants will come from, and what they will value in a university, the enrollment situation that many universities around the world are facing, will be resolved.. 3.2 Part II: Benchmarking Benchmarking is a management approach used to implement the best practices found in similar industries or even in different industries, aimed at improving the performance of an organization. Currently, benchmarking is widely used to achieve a competitive advantage by implementing best practices in organizations, by evaluating its internal strengths and weaknesses, analyzing comparative advantages of leading competitors, recognizing the best practices of the best performers, and implementing these findings into its strategic plan for achieving a position of superiority [15]. In short, benchmarking could be defined as a main tool delivering improvements by comparing the current and desirable states[16]. There is a definition which could help to understand what Benchmarking is: “Benchmarking is an ongoing process of measuring and improving business practices against the companies that can be identified as the best worldwide”[17]. This definition emphasizes the importance of improving, rather than maintaining the status quo. It involves searching worldwide for the best companies. Most 18.
(30) marketplaces have international competitors, so best practices are not limited to one country or one geographical location. Information that allows companies to improve their competitive positions must be gathered from best companies, no matter where they are located [17]. Thus, benchmarking represents a process of organizational adaptation where the focus is not simply on copying others, but on learning how to improve organizational performance through sharing ideas. This approach establishes benchmarking as a mechanism that goes beyond being simply a technique or a tool, but rather is a powerful concept with a change agent impacting on behavior modification and developing new ways to manage business[16]. Thus, benchmarking is a learning tool, which identifies organizational competencies and also establishes how these competencies contribute to the sustainability of the exemplar organization [18]. “Companies striving to improve must not accept past constraints. Companies that fail to develop a global perspective will soon be replaced by competitors that have the insight to become global in their perspective. In order to make rapid continuous improvement, companies must be able to think outside the box that is to examine their business from external perspectives. The more innovative the ideas that are discovered, the greater the potential rewards that can be gained from the adaptation of the ideas” [17].. 3.2.1 Difference between benchmarking and competitive analysis The terms benchmarking and competitive analysis are often confused. The former researches external business sectors for information, whereas the latter shows only how firms compare with their competitors, producing a ranking with direct competitors; it does not show how to improve business processes [17]. Benchmarking provides a deep understanding of the processes and skills that create superior performance [17]. Competitive analyses have helped companies improve their respective market positions. Benchmarking then takes over where this opportunity for improvement ends, because it enables companies to move from a parity business position to a superiority position, by a deep observation of the best practices which can help any company [17]. The type of data for competitive analysis often focuses on meeting some specific industry standard. By comparison, benchmarking focuses on the process that allows such a standard to be not only achieved, but also surpassed. Process enablers and critical success factors must be clearly understood for any permanent improvement to be achieved and sustained. This understanding will require extensive data collection, both internally and from the benchmarking partners [17].. 19.
(31) 3.2.2 Defining core competencies As a continuous improvement tool, benchmarking is used to improve core competencies, the basic business processes that allow a company to differentiate itself from its competitors. A core business process may have an impact by lowering costs, increasing profits, providing improved service to a customer, improving product quality, and improving regulatory compliance [17]. “Core competency could be defined as a key business process that represents core functional efforts and is usually characterized by transactions that directly or indirectly influence the customer’s perception of the company” [17]. Core competency should impact the following business measures: return on net assets, customer satisfaction, revenue per employee, quality, asset utilization, and capacity [17]. “Prahalad and Hamel in their paper, “Core Competence of the Corporation” in 1990, gave a concept of what “core competence” is. They stated that it is a departure from the outside to inside thinking of traditional business policy thinkers, who started with environment, and went on to “fit” the organizations’ strengths and weaknesses to it. Resources were to be marshaled to achieve what was dictated by the environment. Prahalad et al. emphasized the need for combining these resources and stretching them to new areas and new lengths; combined with an ambitious strategic intent, a firm could do its tasks in a markedly distinct way from its competitors. The trick was to find what a firm could do in a distinct and superior way as compared to other firms across different activities or products. This concept has challenged the managers to view their firms as a portfolio of competencies rather than as a portfolio of businesses [19].. 3.2.3 Types of benchmarking [17] There are two types of benchmarking, namely internal (inside the company – enterprise benchmarking; or inside a company group – corporation benchmarking), and external (competition, branch and branch-independent) [20].. 3.2.3.1 Internal benchmarking This is applicable in large organizations with complex organizational structures, since there is a possibility to compare different departments with one another [20]. Typically it involves different departments or processes within a plant or organization. The greatest advantage of this type of benchmarking is that data can be collected easily, and it is also easier to compare data. [17] However, the greatest disadvantage is that it is unlikely to result in any major breakthrough in improvements. Nevertheless, internal benchmarking will lead to small, incremental improvements and should provide adequate return on investment for any improvements that are implemented [17].. 20.
(32) 3.2.3.2 External benchmarking External benchmarking requires comparing organizations and productivity with direct competitors (competition benchmarking) or with organizations of the same branch (branch benchmarking) and/or with any organization regardless of the branch (branch-independent benchmarking) [20]. It is divided in two branches:. 3.2.3.2.1. Similar industry/competitive. It uses external partners in similar industries or processes. In many benchmarking projects, even competitors are used [17]. Thus, the project tends to focus on organizational measures by meeting a numerical standard, rather than improving any specific business process [17].. 3.2.3.2.2. Best practices benchmarking. “It focuses on finding the unarguable leader in the process being benchmarked. It crosses industry sectors and geographical locations, and provides the opportunity for developing breakthrough strategies for the organization. It involves a deep study of business processes outside its organization, adapts or adopts superior business processes, and makes a quantum leap in performance compared to its competitors” [17]. One of the keys to being successful with best practice benchmarking is to define a best practice. This type of benchmarking is superior because it provides the opportunity to make the most significant improvement; the companies being benchmarked are the best in the market. “Most important, best practice benchmarking provides the greatest potential for achieving breakthrough strategies, resulting in an increase in the company’s competitive position” [17].. 3.2.4 The benchmarking process Before embarking on a benchmarking initiative the following pre-requisites should be taken into consideration: first, benchmarking should be seen as just one of the basic pillars of learning organizations because it encourages careful observation and learning from others; second, as a process of learning from others it requires modesty, since without this it is impossible to acknowledge areas where others out-perform your organization; third, benchmarking does not mean uncritical copying, which could be irresponsible when an organization does not understand the essence of its own, individual conditions [20]. 1. Conduct internal analysis 2. Identify areas for improvement 3. Find partners. 21.
(33) 4. 5. 6. 7.. Make contact, develop questionnaire, perform site visits [17][17] Compile results Develop and implement improvements Do it again.. 3.2.5 Traps to benchmarking [17] When benchmarking is used properly, it can make a major contribution to the continuous improvement process. However, it can also be completely devastating to a company’s competitive position when used improperly. Some of the improper uses of benchmarking include: 1. Using benchmarking data as a performance goal: “When companies benchmark their core competencies, they can easily fall into the trap of thinking a benchmark should be a performance indicator. A company receives greater benefits when the tools and techniques used by a partner to achieve a level of performance are understood. This understanding allows the company not only to reach a certain number, but also to develop a vision of how to achieve an even more advanced goal. By focusing on reaching a certain number, some companies may have changed their organizations negatively (e.g., by downsizing or cutting expenses). However, they may have also removed the infrastructure (people or information systems) and soon find they are not able to sustain or improve the benchmark. In such cases, benchmarking becomes a curse” [17]. 2. Premature benchmarking: “When a company attempts to benchmark before the organization is ready, it may not have the data to compare with its partners. Therefore, someone makes a “guesstimate” that does the company no good. The process of collecting data gives an organization an understanding of its core competencies and how it currently functions. Premature benchmarking will lead back to the first trap--just wanting to reach a number. Companies that step into this trap become “industrial tourists.” They go to plants and see interesting things, but don’t have enough of an understanding to apply what they see to their own businesses. The end results, then, are reports that sit on shelves and never contribute to improved business processes” [17]. 3. Copycat benchmarking: “Imitation benchmarking occurs when a company visits its partners and, rather than learning how the partners changed their businesses, concentrates on how to copy the partners’ current activities. This practice may be detrimental to a company because it may not have the same business drivers as its benchmarking partners. Also, there may be major constraints to implementing the partner’s processes. Such constraints might include incompatible operations, different skill levels of the work force, differences in union agreements, different organizational structures, and different market conditions” [17]. 4. Unethical benchmarking: “Sometimes a company will agree to benchmark with a competitor and then try to uncover proprietary information while on the site visit. 22.
(34) or by use of the questionnaire. Clearly, this kind of behavior will lead to problems between the companies and virtually ruin any chance of conducting a successful benchmarking exercise at a later date. A second type of unethical benchmarking entails referring to or using the benchmarking partners’ names or data in public without receiving prior permission. This, too, will damage any chance for ongoing benchmarking between the companies. Even worse, the bad experience may prevent management from ever commissioning further benchmarking exercises with other partners” [17]. 3.2.6. Important considerations. 1. “It is necessary to explore the tangible and intangible factors that combine to produce a superior performance and involve those people most directly concerned in the activity being examined” [17]. 2. “Benchmarks are not the end-all. A benchmark performance does not remain a standard for long. continuous improvement must be the goal” [17].. 3.2.7 Purposes of benchmarking Benchmarking has been used in both private and public sectors, because it is perceived as a tool for increasing productivity and accelerating changes. It facilitates strengths and weaknesses identification and delivers solutions checked by others; it increases competitiveness and improves quality [20]. It has two purposes, namely the direct and indirect. Direct aims include identification of better processes, comparisons with others, identification of strengths and weaknesses with reference to the ideal model, learning from others and the improvement of practices. Indirect aims of benchmarking embrace the development of management skills, overcoming reluctance to ideas from outside the organization, an increase in client satisfaction and gaining advantage over the competition [20]. 3.3. Part III: Data Envelopment Analysis (DEA) model. 3.3.1 Background and DEA concept The concept of Data Envelopment Analysis (DEA) dates back to Farrell in 1957. However, the interest seems to have been initiated by Charnes, Cooper and Rhodes in 1978, who proposed DEA as a way of measuring performance in different organizations, the success of which cannot be measured by a single factor such as profit. Thus, DEA began as a new management science tool for technical efficiency analysis of decision-making units (DMUs) [21]. This technique has been applied to a variety of efficiency evaluation problems, where managers wish to conduct a performance evaluation and analyze decision 23.
(35) alternatives [22]. The great variety of applications of DEA includes its use in evaluating the performances of many different kinds of entities engaged in wide range of activities in different contexts in many different countries. Some examples include the measurement of performance of bank branches, hospitals, and universities in performing their education and research functions. Hence, DEA has opened up possibilities for use in cases which have been resistant to other approaches because of the complex, often unknown, nature of the relations between the multiple inputs and multiple outputs involved in many of these activities [23]. The outcome from a DEA analysis is a relative efficiency score for each DMU, calculated in relation to all other DMUs, using the actual measured values for the inputs and outputs. The calculations aim to maximize the relative efficiency score of each DMU, subject to the requirement that the set of weights thus obtained for each DMU must also be feasible for all other DMUs included in the calculations [24]. DEA produces the best practice production frontier, against which each inefficient DMU is evaluated. The source and level of inefficiency for each input and output are identified, determined by comparison to a single referent DMU or a convex combination of other DMUs located on the efficient frontier [21]. The DEA methodology can help bring together a number of performance dimensions, providing a relative evaluation of DMUs on multiple dimensions, simultaneously [25].. 3.3.2 How does DEA work? DEA compares service units considering all resources used and services provided, identifying the most efficient units or best practice units and the inefficient units for which real efficiency improvements are possible. This is achieved by comparing the mix and volume of services provided and the resources used by each unit compared with those of all the other units. In short, DEA is a very powerful benchmarking technique. The most important advantages are that a key attribute is fairness in that the units that are found to be inefficient are located after considering their mix of inputs and outputs. A second benefit is that it provides strong indications of what type and amount of changes in inputs and outputs are needed to make inefficient units efficient” [26].. 3.3.3 Decision variables In DEA, the organization under study is called a DMU (Decision Making Unit). The definition of DMU is very flexible in order to be used over a wide range of possible applications. Generically a DMU is regarded as the entity responsible for converting inputs into outputs and whose performance is to be evaluated. In managerial applications, DMUs may include banks, department stores and supermarkets, car makers, hospitals, schools, public libraries and so forth [23].. 24.
(36) For example, considering that there are n DMUs: DMU1, DMU2, ... , and DMUn. Some common input and output items for each of these j = l,...,n DMUs are selected as follows: 1. Numerical data are available for each input and output, with the data assumed to be positive for all DMUs [23]. 2. The items (inputs, outputs and choice of DMUs) should reflect an analyst's or a manager's interest in the components that will enter into the relative efficiency evaluations of the DMUs [23]. 3. In principle, smaller input amounts are preferable and larger output amounts are preferable so the efficiency scores should reflect these principles [23]. 4. The measurement units of the different inputs and outputs need not be congruent. Some may involve number of persons, or areas of floor space, money expended, etc. [23].. 3.3.3.1 Inputs These are the resources or characteristics that are needed to produce its outputs [24].. 3.3.3.2 Outputs These are the products or outcomes all of the resources that will constitute the result of the transformation of inputs [24].. 3.3.3.3 Selecting units [27] The following criteria should guide the selection of units for analysis • The units to be assessed need to be sufficiently similar so that comparison of them makes sense, but also need to be performing sufficiently differently so that we can discriminate among them • The units selected should be performing the same tasks with similar objectives • The number of units to be included in the analysis needs to be sufficiently large so that discrimination between them is possible. • The units selected are likely to be defined by particular boundaries which might be organizational, physical or regional.. 3.3.4 Specifying the input and output model is the most critical aspect of this process The inputs and outputs to use in an efficiency study are chosen by the basis on which the efficiency of the units is to be assessed. Initially a list should be drawn up. 25.
Figure

![Table 3: Number of universities and tertiary education entry rate in countries members of OECD [6, 11]](https://thumb-us.123doks.com/thumbv2/123dok_es/2354909.518436/25.918.135.830.466.770/table-number-universities-tertiary-education-entry-countries-members.webp)
+7
![Table 4: Enrolment in tertiary in public and private institutions [15]](https://thumb-us.123doks.com/thumbv2/123dok_es/2354909.518436/27.918.156.816.170.1060/table-enrolment-tertiary-public-private-institutions.webp)
![Table 5: Single input and single output [26]](https://thumb-us.123doks.com/thumbv2/123dok_es/2354909.518436/40.918.234.711.779.1051/table-single-input-single-output.webp)
![Figure 10: Efficient frontier: One input and two outputs case [26]](https://thumb-us.123doks.com/thumbv2/123dok_es/2354909.518436/44.918.348.619.333.546/figure-efficient-frontier-input-outputs-case.webp)


Documento similar
Table 6.2 shows the energies, obtained with the complete and restricted active spaces, of the lowest singlet at triplet states of DHS calculated at the ground state C 2h
Figure 5: All science instruments and the AO system are located on the Nasmyth platforms and will be available at all times.. Starlight can be directed to each instrument by
To further characterize how the interplay of the localized plasmonic resonances and the active medium enables lasing action in the considered class of systems, we study the dynamics
Noting that the V 0s emanating from the t → W b branch have displaced decay vertexes from the interaction point due to the weak decays b → c → s, and that the b-quark jets are rich
87 The University of Michigan, Department of Physics, 2477 Randall Laboratory, 500 East University, Ann Arbor, MI 48109-1120, United States 88 Michigan State University, Department
This study presents the findings of a year-long e-mail exchange between learners of English at Nebrija University in Madrid and learners of Spanish at Trinity College Dublin during
What is perhaps most striking from a historical point of view is the university’s lengthy history as an exclusively male community.. The question of gender obviously has a major role
The contribution is the result of a study carried out at the Department of Architecture of the Polytechnic School of the University of Palermo, aimed at identifying, reviewing
