Wash-off
and
sediment
transport
experiments in a full-scale urban
drainage physical model
Presented by Juan Naves
Doctoral Thesis
2019
Civil Engineering Ph.D. Program
Supervisors: Jose Anta
Jerónimo Puertas
Los abajo firmantes hacen constar que son los directores de la Tesis Doctoral titulada “Wash-off and sediment transport experiments in a full-scale urban drainage physical model” realizada por Juan Naves García-Rendueles, cuya firma también se incluye, en el marco del Programa de Doctorado en Ingeniería Civil de la Universidade da Coruña, dando consentimiento para su presentación y posterior defensa.
The undersigned hereby certifies that they are supervisors of the Doctoral Thesis entitled “Wash-off and sediment transport experiments in a full-scale urban drainage physical model” developed by Juan Naves García-Rendueles, whose signature is also included, in the framework of the Civil Engineering Ph.D. Program at the University of A Coruña, consenting to its presentation and subsequent defense.
Directores:
Jose Anta Álvarez Jerónimo Puertas Agudo
Doctorando:
Agradecimientos
En primer lugar, quiero agradecer a Jose Anta y Jerónimo Puertas la oportunidad de trabajar con ellos y realizar esta tesis doctoral. Ha sido un verdadero placer tenerlos como directores de tesis, siempre disponibles, guiándome y ayudándome en todo lo que he necesitado. Gracias por todo vuestro tiempo, dedicación y esfuerzo invertidos en esta tesis. Mención especial también para Joaquín Suárez, por apoyarme y ayudarme en todo lo que he necesitado.
Mi agradecimiento al Ministerio de Ciencia, Innovación y Universidades por la ayuda para contratos predoctorales de Formación de Profesores Universitarios (FPU14/01778) de la que he sido beneficiario durante estos cuatro últimos años. Además, esta beca me ha permitido iniciarme en la docencia y disfrutar de una estancia en el Swiss Federal Institute of Aquatic Science and Technology (EAWAG) de Suiza (EST17/00715). Una parte de la investigación ha sido financiada adicionalmente por el Ministerio de Ciencia, Innovación y Universidades en el ámbito de los proyectos POREDRAIN (RTI2018-094217-B-C33) y SEDUNIT (CGL2015-69094-R)
Durante mi estancia, tuve el placer de estar bajo la supervisión de Jörg Rieckermann, a quién agradezco sinceramente todo el tiempo y ayuda que me ha dedicado. También me gustaría agradecerles a él y a todo su departamento la gran acogida y el trato recibido, que hicieron de mi estancia una gran experiencia tanto profesional como personal.
Durante los numerosos ensayos de laboratorio he contado con la ayuda de muchas personas cuya contribución ha sido imprescindible para llevarlos a cabo con éxito. Gracias al personal del CITEEC (Miguel, Gonzalo, Jose, Dani, Esteban, Paula) por su colaboración en todas las fases de los ensayos, llegamos a instalar hasta 1400 goteros uno a uno. Agradecer también a Montse por su ayuda con los cientos de muestras analizadas en unos meses intensos. Muchas gracias a Manu y a Esteban por su apoyo durante los ensayos, su disposición a mojarse desinteresadamente y todo lo que hemos pasado juntos. Gracias también a todos los demás compañeros con los que he tenido la suerte de compartir habitáculos todos estos años por generar un ambiente espectacular que hace todo mucho más llevadero.
Contents
Chapter 1: Introduction, results and conclusions ... 3
1 General outlook ... 5
2 State of the art ... 6
2.1 Sediment build-up ... 7
2.2 Sediment wash-off ... 8
2.3 Gully pots sediment accumulation and resuspension ... 12
2.4 In-sewer sediment accumulation, erosion, and transport ... 13
3 Motivation for the current thesis ... 14
4 Objectives ... 16
5 Main results ... 17
6 General conclusions ... 31
7 Future research ... 33
Chapter 2: Preliminary wash-off tests ... 35
1 Introduction ... 37
2 Material and methods ... 38
2.1 Experimental setup ... 38
2.2 Experimental procedure ... 40
3 Results and discussion ... 43
3.1 Initial surface sediment load tests ... 43
3.2 Sediment distribution method tests ... 44
3.3 Distance from the curb tests ... 45
3.4 Curb accumulation tests ... 46
4 Conclusions ... 47
Chapter 3: Development of a new rainfall simulator ... 49
1 Introduction ... 51
2 Material and methods ... 52
2.1 Rainfall simulator description ... 52
2.2 Calibration procedure ... 53
2.3 Rain properties of calibrated rainfall simulator ... 55
3 Results and discussion ... 56
3.1 Natural rain properties ... 56
3.2 Calibration results ... 57
3.3 Rain properties of the developed rainfall simulator ... 58
4 Conclusions ... 59
Chapter 4: Overland flow velocities characterization ... 61
1 Introduction ... 63
2 Materials and methods ... 66
2.1 Physical model description ... 66
2.2 Surface model topography ... 67
2.3 Numerical model ... 68
2.4 Determination of overland flow velocity fields ... 69
ii
3 Results and discussion ... 74
3.1 Elevation data and model discretization ... 74
3.2 Application of the 2D shallow water model ... 75
3.3 Application of LSPIV to determine overland flow velocities ... 78
4 Conclusions ... 83
Chapter 5: Hydraulic, wash-off and sediment transport experiments ... 85
1 Introduction ... 87
2 Physical model description ... 89
2.1 Rainfall simulator ... 89
4 Wash-off and sediment transport experiments ... 97
4.1 Sediment initial conditions ... 98
4.2 TSS measurement ... 99
4.3 Particle size distributions ... 101
4.4 Mass balance ... 101
4.5 Experimental procedure ... 103
5 Data availability ... 104
5.1 Hydraulic, wash-off and sediment transport experiments data ... 104
5.2 PIV analysis data ... 104
5.3 SfM topography data ... 104
6 Conclusions ... 104
Chapter 6: Analysis of a physical-based urban wash-off model ... 107
1 Introduction ... 109
2 Materials and methods ... 111
2.1 Numerical model ... 111
2.2 Laboratory experiments ... 114
2.3 Global sensitivity analysis ... 116
2.4 Local sensitivity analysis ... 118
2.5 Variables and parameters ranges ... 119
2.6 Implementation ... 121
2.7 Assessment of model predictions ... 122
3 Results ... 122
3.1 Model and ranges performance ... 122
3.2 Global sensitivity analysis ... 123
3.3 Local sensitivity analysis ... 127
4 Discussion ... 131
4.1 Interpretation of the sensitivity analysis results ... 131
4.2 Transferability to field studies ... 132
4.3 General perspectives for modelling urban wash-off ... 134
5 Conclusions ... 134
References ... 137
Appendix A: Resumen extendido de la tesis ... 157
Appendix B: List of publications from thesis outcomes ... 175
List of figures
iii
List of figures
Chapter 1
Figure 1.1. Sediment mobilization through urban catchments with separating sewer system. Pollutants are accumulated in catchment surfaces in dry weather periods and can be washed off and transported through gully pots to the sewer system. ... 6 Figure 1.2. Accumulated solids load with respect the elapsed time since last cleaning by sweeping or rain (Sartor and Boyd, 1972). ... 7 Figure 1.3. Exponential wash-off equation performance for different surface roughness and particle sizes (Sartor and Boyd, 1972). ... 9 Figure 1.4. Suspended solids transport scheme in an urban wash-off physically-based 1D approach (Deletic et al. 1997). The model considers detachment of particles by rain and runoff shear and assumes no deposition. Once into suspension, solids are transported by overland flow, which is divided into a shallow flow perpendicular to the curb and a gutter flow modeled as a triangular channel longitudinally to the curb. ... 10 Figure 1.5. Conceptual scheme of the mobilization of sediment in Hairsine-Rose wash-off formulation applied to an urban catchment. Taken from Hong et al. (2016a). ... 11 Figure 1.6. Urban drainage physical model general view taken from Fraga (2015). ... 15
Figure 1.7. General view of the urban drainage physical model with the nozzles-based rainfall simulator and rain intensity map generated. ... 17 Figure 1.8. Initial sediment distributions and loads tested in the preliminary tests. ... 18
iv
implementation of the topographies in a 2D shallow water model was plotted next to each elevation map. ... 23 Figure 1.14. Surface and in-pipe depth, flow discharge and surface velocities measuring points in hydraulic experiments (a). Flow discharge at the pipe system outlet (b) and surface (c) and in-pipe (d) water depths for the highest rain intensity. ... 24 Figure 1.15. Particle size distribution of the five sediment classes used (a). Mean diameter and gradation coefficients are also indicated in the plot. Sediment initial distribution over the model surface (b). ... 25 Figure 1.16. Measuring points and variables for the wash-off and sediment transport experiments. ... 25 Figure 1.17. Total suspended solids (TSS) results in both gully pots and in the pipe system outlet for the five different grain sizes (D1-D5) and rain intensities of 80, 50 and 30 mm/h. ... 26 Figure 1.18. Mass balances results for the five different grain sizes (D1-D5) and rain intensities of 80, 50 and 30 mm/h. ... 27 Figure 1.19. TSS experimental results and five best-fitted TSS simulations for the experiments with rain intensities of 50 (up) and 80 mm/h (down) and sediment classes D2 and D3, respectively. The parameter sets of the five best-fitted predictions are also included. ... 28 Figure 1.20. SRC and EFAST first order and total effect sensitivity indices of the Hairsine-Rose parameters for the total washed off mass in gully pot 1 and for each of the laboratory experiments considered (colors for rain intensities and x-position for sediment classes). .. 29 Figure 1.21. Sensitivity results for the Elementary Effects method for the 30 mm/h and sediment class D1 test. Plots show the sensitivity to the total washed off mass through gully pot 2. The ranking of the three most influential input factors is shown in the upper-left corner of the plot. ... 30
Chapter 2
Figure 2.1. Geometry (a) and photograph of the experimental setup (b). ... 39
Figure 2.2. Rain intensity map over street surface (a) and scheme of sewer outlet tanks (b). ... 39 Figure 2.3. Individual turbidity (FNU) and TSS (mg/L) regressions. ... 41
List of figures
v
Figure 2.5. Samples and turbidity signal derived TSS pollutographs and discharges at the sewer outlet (a) and mass percentage final distributions (b) for sediment loads of 4, 16 and 32 g/m2 over a 4 m2 surface in a 0.5 m grid. Values in parentheses indicate the mass errors
balance (ɛM). ... 44
Figure 2.6. Samples and turbidity signal derived TSS pollutographs and discharges (a) and mass percentage final distributions (b) placing a sediment load of 16 g/m2 over a 4 m2 surface
on a 0.5 m grid, a 0.25 m grid or spreading homogenously. Values in parentheses indicate the mass errors balance (ɛM). ... 45
Figure 2.7. Samples and turbidity signal derived TSS pollutographs and discharges (a) and mass percentage final distributions (b) for a sediment load of 20 g/m, spread homogeneously over a 5-meter-long and 1-meter-wide surface, attached or 1 or 2 m separated from the curb. Values in parentheses indicate the mass error balance (ɛM). ... 45
Figure 2.8. Samples and turbidity signal derived TSS pollutographs and discharges (left) and mass percentage final distributions (right) for a sediment load of 20 g/m, spreaded homogeneously over a 5-m-long and 3, 1 or 0.5-m-wide surface and placed with a stepped distribution. Values in parentheses indicate the mass error balance (ɛM). ... 46
Chapter 3
Figure 3.1. General image of the rainfall simulator in its final configuration above the urban drainage physical model. Disdrometer and vessels for measuring rain intensity are also shown in the image (image a). Detail of both types of drippers inserted in the circuits above the horizontal mesh (image b). ... 53 Figure 3.2. Vessels disposed over the model surface to measure rain intensity and uniformity for different mesh types and distances to drippers during calibration. ... 55 Figure 3.3. Relation of raindrop mean diameter and velocity with respect to the rain intensity measured by disdrometer. ... 56 Figure 3.4. Raindrop size and velocity distribution of natural rainfalls with intensities ranging from 25 to 35 mm/h. The mean of the number of raindrops registered by disdrometer classified in sizes and velocities is compared with experimental relation between diameter and terminal velocity (Gunn and Kinzer 1949), which is represented by the solid curve. .... 56 Figure 3.5. Rain intensity map of the physical model surface, which has an approximate area of 36 m2, for the three intensities that the rainfall simulator is able to generate. Plots include
vi
Chapter 4
Figure 4.1. (a) Physical model scheme and (b) general image of the facility. ... 66
Figure 4.2. (a) Texturized image projection over the street surface used for the application of SfM and (b) 3D dense point reconstruction of the model. ... 68 Figure 4.3. Layout of the experimental configuration for overland runoff velocity measurements in the physical model. ... 69 Figure 4.4. Image processing and LSPIV data analysis methodology. ... 71
Figure 4.5. Topographies of the physical model obtained from (a) traditional point survey and (b) SfM photogrammetric technique. Longitudinal and transversal cross section plotted in Figure 4.6 and Figure 4.13 are marked in the maps. ... 74 Figure 4.6. Comparison of the longitudinal (x = 0.75 m and x = 010 m) and transversal (y = 3.75 m) profiles extracted from the model domain generated from traditional point data and SfM topographies. ... 75 Figure 4.7. Experimental and numerical flow results in both gully pots and for the three rainfall intensities studied. The variance in the measured experimental flow discharge (grey) and the LSPIV measure interval (purple) are shown. ... 76 Figure 4.8. Numerical depth-averaged velocity vectors using the traditional data point topography for 30, 50 and 80 mm/h rainfall intensity. ... 77 Figure 4.9. Numerical depth-averaged velocity vectors using the SfM topography for 30, 50 and 80 mm/h rainfall intensity. ... 77 Figure 4.10. Experimental surface velocity fields for the three studied rainfalls using LSPIV. ... 79 Figure 4.11. Comparison of the experimental and numerical x-component (up) and y-component (down) velocities using the experimental data obtained from the LSPIV technique and the numerical results, with the traditional point data topography (left) and the SfM topography (right), respectively. The three different rainfall intensities of 30 mm/h, 50 mm/h and 80 mm/h are represented in blue, yellow and black... 80 Figure 4.12. Density comparison (histograms) for x-component (a) y-component (b) and module (c) of experimental and numerical velocities. ... 81 Figure 4.13. Numerical and experimental depth-averaged velocity sections comparison (X = 0.75 m, X = 0.10 m and Y = 3.75 m) for the three rainfall intensities studied... 82
Chapter 5
List of figures
vii
Figure 5.2. General image of the rainfall simulator with the experimental setup for the measurement of rain intensity maps. Results for the intermediate rainfall are also plotted. ... 90
Figure 5.3. Surface and in-pipe depth, flow discharge and surface velocities measuring points in hydraulic experiments. ... 91 Figure 5.4. Distance sensors installed on the street surface (a) and on pipes (b) to measure water depths. Data registered for the highest rain intensity is also shown. ... 92 Figure 5.5. Setup for the measurement of gully pot discharges from the water level over a v-notch in an underground deposit. The result obtained in gully pot 2 for the rain intensity of 50 mm/h is also shown in the plot as an example. ... 93 Figure 5.6. Pipe system outlet setup for the measurement of flow discharges, turbidity and suspended solids transport. The flow discharge registered in for the rain intensity of 50 mm/h is also plotted. ... 93 Figure 5.7. Flow discharge data processing from the raw recorded signal to the flow result at the pipe system outlet for the intermediate rain intensity. ... 94 Figure 5.8. Experimental setup scheme for the recording of runoff videos used in the PIV analysis with fluorescent particles. The resulted steady velocity distribution generated by the lowest rainfall intensity is also plotted. ... 95 Figure 5.9. Measuring points in wash-off and sediment transport experiments. ... 98
Figure 5.10. Initial distribution of sediment over the model surface for the wash-off and sediment transport tests. ... 99 Figure 5.11. Particle size distribution of the five sediment classes used. Mean diameter and gradation coefficients (σg = √(D_84/D_16 )) are also indicated in the plot. ... 99 Figure 5.12. Total suspended solids (TSS) results in both gully pots and in the pipe system outlet for the five different grain sizes (D1-D5) and rain intensities of 80, 50 and 30 mm/h. ... 100
Figure 5.13. PSD and TSS samples measuring points at the entrance of gully pots (a) and at the pipe system outlet (b). ... 101 Figure 5.13. Mass balances results for the five different grain sizes (D1-D5) and rain intensities of 80, 50 and 30 mm/h. ... 102
Chapter 6
Figure 6.1. Physical model scheme and initial distribution of the sediment. ... 114
viii
here, through analyzing the manual grab samples for all the diameters and rain intensities. ... 116 Figure 6.3. TSS experimental results and five best-fitted TSS simulations for the experiments with rain intensities of 50 (up) and 80 mm/h (down) and sediment classes D2 and D3, respectively. It can be see that predictions agree well with experimental results. The contours of all the simulations performed in the global SA are also included (dashed lines), and illustrate the sensitivity of the model output to the plausible values of H-R parameters. ... 123 Figure 6.4. Standardized Regression Coefficients (SRC) of the Hairsine-Rose parameters for the total washed off mass (row 1) and the TSS maximum value (row 2) in each gully pot (columns) and for each laboratory experiment (colours for the rain intensities and x-position for the sediment classes). The degree of transparency represents the R2 value. The plots
show that the critical mass is the most important H-R parameter and that there is a strong relation between the grain size of the sediment and the relative importance of rain-driven and flow-driven detachment parameters. ... 124 Figure 6.5. EFAST first order and total effect sensitivity indices of the Hairsine-Rose parameters for the total washed off mass (row 1) and the TSS maximum value (row 2) in each gully pot (columns) and for each of the laboratory experiments (colors for rain intensities and x-position for sediment classes). It can be seen that the critical mass is the most important H-R parameter. 𝛼0, ℎ0 and F occupy a secondary level of influence with respect to the total washed mass, but only F in the case of the TSS peak results... 126 Figure 6.6. Sensitivity results for the Elementary Effects method. Plots show the sensitivity to the total washed off mass through gully pot 2 for each of the three rainfall intensities and four grain sizes considered in the experiments. The ranking of the three most influential input factors is shown in the upper-left corner of each case. In general, Ms0, D50 and Mscr are
the factors with the most influence on the result for all the laboratory experiments. ... 128 Figure 6.7. Sensitivity results for the Elementary Effects method. Plots show the sensitivity to the TSS maximum value in gully pot 2 in all cases. The ranking of the three most influential input factors is shown in the upper-left corner of each case. In general, Ms0, D50, Mscr and F
are the factors with the most influence on results. ... 130
Appendix A
List of figures
ix
x
Figura A.15. Resultados del análisis de sensibilidad local para la masa total lavada por el imbornal 2 para el caso de 30 mm/h y clase de sedimento D1, usando el método de Elemmentary Effects y considerando todas las variables de entrada del modelo. ... 173
List of tables
xi
List of tables
Chapter 3
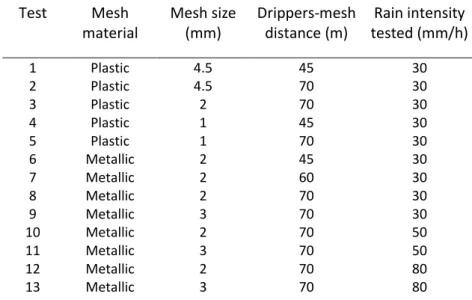
Table 3.1. Configurations of the tests performed during rainfall simulator calibration. ... 54
Table 3.2. Results of the tests performed during the rainfall simulator calibration. ... 57
Chapter 5
Table 5.1. Hydraulic tests configurations. ... 96Table 5.2. Configuration of PIV experiments. ... 97
Table 5.3. Wash-off and sediment transport tests ID and configurations. ... 103
Chapter 6
Table 6.1. Sediment granulometries considered (D1-D4) and total washed off mass for the twelve laboratory experiments. ... 115Table 6.2. Parameters and ranges of variation used in the global sensitivity analysis. ... 119
Table 6.3. Input factor ranges for the local sensitivity analysis. ... 120
Abstract
1
Abstract
The continuous growth of cities and the consequent increase in impermeable surfaces make runoff management essential for the sustainable urban development. However, the high variability of pollutant build-up and wash-off processes in urban catchments complicates the development of modelling tools to design and manage palliative measures aimed at reducing environmental impacts of stormwater pollution.
In this thesis, an extensive experimental campaign analyzing sediment wash-off, gully pot trapping and in-pipe sediment transport was carried out in a physical rainfall simulator model. In the tests, the different variables involved in these processes were accurately measured under laboratory-controlled conditions. The use of a full-scale urban drainage physical model, the development of a novel rainfall simulator, and the precise definition of hydraulic variables allow the transferability of the results to real field catchments, and render the provided data optimal for the development and validation of more accurate models and formulations. The results obtained have been used to evaluate and analyze a physically-based urban wash-off model, which has recently been proposed as an alternative for adequately modelling the complex physical phenomena in question.
Resumen
El continuo crecimiento de las ciudades y el consecuente aumento de las superficies impermeables hacen que la gestión de las aguas pluviales sea esencial para un desarrollo urbano sostenible. Sin embargo, la variabilidad asociada a los procesos de acumulación y lavado de contaminantes en cuencas urbanas complica el desarrollo de modelos para el diseño y gestión de medidas paliativas que reduzcan el impacto ambiental producido por la escorrentía urbana.
2
Resumo
O continuo crecemento das cidades e o consecuente aumento das superficies impermeables fan que a xestión das augas pluviais sexa esencial para un desenvolvemento urbano sustentable. Con todo, a variabilidade asociada aos procesos de acumulación e lavado de contaminantes en concas urbanas complica o desenvolvemento de modelos para o deseño e xestión de medidas paliativas que reduzan o impacto ambiental producido pola escorrentía urbana.
3
Chapter 1
Introduction, results and conclusions
5
1
General outlook
6
2
State of the art
The process of the mobilization of sediments in urban areas starts with the accumulation or build-up of particles in impervious surfaces such as roads, sidewalks or roofs. These particles come from human activities, traffic, and surrounding land uses, and can be washed off during rain events. Sediments are transported by the stormwater runoff to sewer systems through gully pots, in which they can be deposited and then eroded, depending on particles and flow characteristics. Finally, in combined sewers, sediments are transported by sewers to treatment plants or, where the event exceeds the capacity of the system or there is a lack of mitigation measures, to the receiving water bodies through Combined Sewer Overflows (CSO). In the case of separate sewer systems, stormwater runoff is often conducted to water bodies without treatment. As an alternative, Sustainable Urban Drainage Systems (SUDS) have become a more commonly seen solution for the management and treatment of stormwater (Woods-Ballard et al. 2007).
Figure 1.1 shows the pollutant mobilization processes through a street section with a separated sewer system. These processes, which are characterized by a large variability (Wijesiri 2016), are still difficult to predict using current approaches and are one of the most challenging issues in urban hydrology. The remainder of this section focuses on the state of the art concerning four main processes: i) sediment build-up, ii) wash-off, iii) gully pots sediment accumulation and resuspension, and iv) in-sewer sediment accumulation, erosion and transport.
Introduction, results and conclusions
7
2.1
Sediment build-up
Build-up is the pollutant accumulation process that takes place over the surfaces of urban catchments during dry weather. APWA (1969) carried out the first study analyzing the accumulation of pollutants in Chicago and suggested that build-up was a lineal phenomenon depending on the time elapsed since the last cleaning by rain or sweeping. Then, Sartor and Boyd (1972), in one of the most significant studies in urban runoff pollution, proposed the following exponential build-up equation from an extensive field campaign:
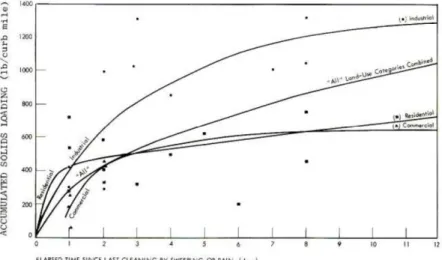
𝐵 = 𝑎(1 − 𝑒−𝑏𝑡) (1) where 𝐵 is the built up mass, t the antecedent dry days, and 𝑎 and 𝑏 the maximum accumulation and the accumulation rate parameters, which depend on the land uses (Figure 1.2). The novelty of this equation (Eq. 1) is that it presents the accumulation of sediments as a finite process, increasing the accumulation to a certain value of equilibrium.
Figure 1.2. Accumulated solids load with respect to the elapsed time since last cleaning by sweeping or rain (Sartor and Boyd, 1972).
Using the same parameters as in the exponential equation, Roesner (1982) proposed an asymptotic approach (Eq. 2) to model the rapid accumulation that developed during the first days and the trend of the build-up curve to an equilibrium value. Ball et al. (1998) obtained a good performance using both the previous asymptotic approach and a power equation (Eq. 3) to model the temporal variation in the build-up measured in a road gutter and its proximities. These equations can be written as:
𝐵 = 𝑎𝑡
8
where 𝐵 is the built up mass, t the antecedent dry days, and a and b the curve fitting parameters.
The approaches presented have been used extensively to model build-up in different studies (e.g. Charbeneau and Barret 1998, Soonthornnonda and Christensen 2008, Chow et al. 2013, Morgan et al. 2017) but without coming to a consensus solution, given that the accumulation process is highly dependent on the study site. This is because the rate of accumulation and the redistribution of particles is not uniform and depend on different variables characterized by high variability such as wind, rainfall, catchment characteristics, surrounding land uses, traffic conditions, and other natural and anthropogenic activities (Deletic et al. 2005, Vaze and Chiew 2002, Herngren et al. 2005a). Wijesiri et al. (2015b, 2016) have recently assessed the variability presented in pollutant build-up process in urban catchments, concluding that a main source of uncertainty that reduces the reliability of build-up models is the different behavior of coarse and fine particles during accumulation period. Following this insight, and considering further natural and human activities as variables, Wei et al. (2019) increased the performance of the original power build-up model to 17%.
The previously mentioned studies are based on field sampling programs where particles are collected from reduced measurement areas in roads or streets. Sartor and Boyd (1972) measurements showed that the concentration of particles is not homogeneously distributed over surfaces and that it decreases with the distance to the curbs, with more than 80% of the total load being found in the first 0.5 m. In addition, Deletic and Orr (2005) observed the same trend and found that sediments collected next to curbs presented coarser grain sizes (around 400 µm) than in middle positions (55 µm). Hence, another source of uncertainty in modelling build-up is the representativeness of field data. To avoid this issue, the available mass over the catchment surface before a rain event can be obtained by inferring it from sewer section runoff monitoring and wash-off models (Sutherland et al. 1998, Sandoval et al. 2018). However, this method must be used with care, given that results are affected by the uncertainties and variability in build-up, wash-off, and sewer sediment transport parameters. In addition, only a fraction of the available pollutant is washed during a rain event (Egodawatta 2007) and the susceptibility to be washed is greater in finer particles (Zafra 2008), so the results obtained in this way are also unrepresentative of the total accumulated load. Finally, as reported in the following section (Sect. 2.2), results from modelling wash-off process are still rather uncertain.
2.2
Sediment wash-off
Introduction, results and conclusions
9
(Rossman, 2015). This empirical equation (Eq. 4) was developed from field measurements using a portable rainfall simulator in a real street. It computes the amount of material removed (𝑊) at a given time from the beginning of the event (𝑟) from the initial load of sediment available (𝑊0), the rainfall intensity (𝑟), and a proportionality constant (𝑘) dependent on street surface characteristics.
𝑊 = 𝑊0(1 − 𝑒−𝑘𝑟𝑡) (4) Although, as noted in Figure 1.3, the results in Sartor and Boyd (1972) showed that total washed off mass depends on particle size distribution and surface roughness, the exponential approach was usually accepted as a way of modelling wash-off without considering this variability in the definition of model parameters. In addition, despite this lumped formulation being widely accepted by users, the predictive results obtained are currently rather uncertain (Schellart et al. 2010, Gorgoglione et al. 2019) when we look at intra-event variability, and hence they are not particularly useful for engineering risk assessment or design. This is mainly due to the fact that these lumped equations are only roughly approximate with respect to the complexity of physical phenomena, considering as key variables the initial load of sediment available and the rain intensity, but neglecting spatial and temporal heterogeneities (Wang et al. 2011). For example, among other things, they rarely consider rainfall heterogeneities, complex geometries in urban catchments (e.g. curbs, gully pots), spatial distributions of sediments, or variability in sediment characteristics.
Figure 1.3. Exponential wash-off equation performance for different surface roughness and particle sizes (Sartor and Boyd, 1972).
10
consider this insight, they included a new parameter (Eq. 5), called the capacity factor (𝐶𝐹). Then, taking as a basis Eq. 5, Muthusamy et al. (2018) carried out a laboratory-scale experimental study in a 1 m2 bituminous rainfall simulator with different surface slopes and
showed that the capacity factor (𝐶𝐹) is also significantly dependent on the surface slope. 𝑊 = 𝑊0𝐶𝐹(1 − 𝑒−𝑘𝑟𝑡) (5) These improvements helped to give physical meaning to parameters and showed that surface wash-off is dependent on a number of important variables, hence increasing knowledge of the process. However, the equations proposed still do not consider certain other important variables, such as the sediment characteristics or the heterogeneities of urban catchments, and the increase in the number of parameters makes model calibration more difficult due to the interactions between the variables involved. In addition, these approaches are developed using studies performed in reduced and homogeneous areas, and their transferability to medium- and large-scales is not trivial given the complex flows that appear in the surroundings of street elements like gully pots or curbs. For these reasons, the improvements in the accuracy of results of empirical equations are limited.
Alternative physically-based approaches have been proposed to overcome these limitations, and consider the physical processes involved in surface wash-off such as the detachment of surface particles by raindrops impact or runoff shear, their transport by overland flow, and their deposition. Deletic et al. (1997) developed a 1D model taking into account spatial distribution of solids over the street surface separating longitudinal curb flow and perpendicular roadway and sidewalk flow during computation (Figure 1.4). This approach assumes no deposition and considers the entrainment of particles into suspension by rainfall and runoff shear. The results obtained showed a good agreement of the results in their application to two different urban catchments of around 250 m2 when the rainfall- and
flow-driven detachment was calculated separately, showing the possibilities for models of this kind.
Introduction, results and conclusions
11
Meanwhile, Shaw et al. (2006, 2009) assumed that particles are suspended due to raindrop impacts and are then transported by flow until their deposition. This assumption worked well in a 0.105 m wide test channel using a rainfall generator and 500–590 μm particles. In contrast to this approach, Massoudieh et al. (2008) modeled the detachment of particles as a function of flow velocity by a power expression. All these studies showed the potential of physically-based models for modelling TSS wash-off in urban areas considering spatial distribution of sediments and modelling the different processes involved using a 1D approach.
The use of 2D models is a step towards the increased accuracy of wash-off models in real catchments, allowing for the reproduction of heterogeneities of urban catchments and complex surface overland flows in a better way. The physically-based wash-off formulation developed in Hairsine and Rose (1992a, 1992b) was used, coupled with a 2D shallow water model, in Hong et al. (2016a, 2016b, 2019) in order to calibrate the TSS mobilization on a road catchment of 2661 m2 for different rain events. In this approach, pollutant mobilization
is computed by performing a mass exchange in each of the elements of the catchment mesh for each time step using the following equation:
𝜕ℎ𝐶 water depth, and the depth average concentration of sediment (𝐶) in the water column can be increased by the detachability of particles due to rain (𝑒𝑟) or runoff shear (𝑟𝑟). It is then transported suspended in the water flow until its deposition (𝑑). Figure 1.5 shows a scheme of the modelled processes.
Figure 1.5. Conceptual scheme of the mobilization of sediment in Hairsine-Rose’s wash-off formulation applied to an urban catchment. Taken from Hong et al. (2016a).
12
water layer. Likewise, flow-driven detachability computes the transfer of solids due to the effect of the runoff stream power and depends on a critical threshold, from which a fraction of the stream power excess produces the entrainment of particles. Finally, the deposition rate depends on the settling velocity, which is affected by the size and density of particles. The variations in surface sediment mass (𝑚) is thus obtained as:
𝜕𝑚
𝜕𝑡 = 𝑑 − (𝑒𝑟+ 𝑟𝑟) (7) The good agreement between model outputs and field-measured pollutographs, together with a detailed representation of wash-off processes, makes this approach an optimal tool for improving our understanding of the physical phenomena, and encourages further research. However, these kinds of physically-based models face the same problem as empirical models: the variability of build-up and wash-off processes makes the accurate definition of the model input variables difficult (Pitt et al. 2004). The associated uncertainties hinder the individual contribution of each factor in the results, complicating the development of such models. Therefore, realistic experiments in laboratory controlled condition are an opportunity to increase our understanding of wash-off processes from an accurate definition of input variables. In these conditions, physical-based wash-off models can be analyzed to identify the variables that govern the phenomena, and thus to simplify these models appropriately to ensure their transferability to real field applications.
2.3
Gully pots sediment accumulation and resuspension
Introduction, results and conclusions
13
these insights by performing additional laboratory tests and proposed an empirical equation for modelling gully pot efficiency depending on inflow rate and particle size. This equation does not consider the accumulated sediment bed, which had been found as a main variable in Fletcher and Pratt (1981). Butler and Karunaratne (1995) proposed a simple model, one which only considers the sedimentation of particles, using laboratory experimental results. This model was completed with erosion processes and validated in Butler and Memon (1999), and is still being developed, as seen in Ciccarello et al. (2012) where analytical and experimental studies were performed using different settling velocities formulations and particle sizes.
A continuous pollutant wash-off model, which also considers both erosion and sedimentation of particles in the gully pot sand trap, was developed by Deletic et al. (2000). In this study, long-term simulations also demonstrated the importance of gully pots in retaining significant fine sediment particles. Memon and Butler (2002) also performed long term simulations of pollutant wash-off, resulting in gully pots efficiencies of up to 40% in the suspended solids load. The main problem of the presented models is the need for accurate data in order to calibrate the different parameters due to the high variability of the process and the importance of the geometry of the gully pots in terms of their efficiency. Considering this variability, alternative statistical models (Rodríguez et al. 2012, Post et al. 2016) have recently been developed by means of extensive long term field data with preventive management purposes against blockages.
The main general conclusions to be drawn from the studies cited in this section are that sedimentation and erosion processes developed in gully pots are highly relevant in modelling the entry of sediments in sewer system. Therefore, approaches to gully pots should continue to be improved in order to be included in urban drainage models and thus to achieve reliable sediment transport results in sewer networks.
2.4
In-sewer sediment accumulation, erosion, and transport
14
Three processes must be considered in order to understand in-sewer sediment transport: i) deposition of sediments, ii) erosion of deposited sediments, and iii) transport of particles by flow (Butler et al. 2003, 2018). Regarding sediment transport, this can be divided into bed load transport, in which particles are moved through sliding, rolling or by saltation, and suspended transport, in which particles are moved and remain in the flow. Sediment transport formulations traditionally used in urban drainage models (e.g. Ackers-White or Meyer-Peter and Muller formula) are usually taken from river sand transport formulations. The transferability of their predictions to urban drainage is not trivial due to the changes in problem conditions such as finer and partly cohesive particles, the presence of pipe walls, and unsteady flow (Bertrand-Krajewski 2006). Laboratory and field studies are thus required to validate formulations and to analyze possible modifications as a means of adapting the equations to sewer flows (e.g. Skipworth et al. 1999, De Sutter et al. 2003). These studies achieved good performance for stormwater systems, but their implementation in combined sewers is still difficult since they do not consider cohesiveness in bedload particles, which decreases the detachment and transport of bedload particles (Rushforth et al. 2003, Banasiak and Verhoeven 2008).
3
Motivation for the current thesis
A recurring problem in the development and testing of existing and new urban wash-off formulations is that the uncertainties in the definition of input variables can be propagated through the model, leading to unreliable results. The variability of build-up phenomena makes it difficult to accurately measure important variables such as the sediment characteristics or initial load without affecting the initial conditions of rain events. This is even more notable in the case of physically-based models, where the definition of additional input variables, such as rainfall properties or spatial sediment distribution, and the need for calibration data to precisely represent runoff flows, can be further sources of error. Experimental laboratory studies using simulated rainfall are an optimal tool to address this problem, providing accurately measured data in controlled conditions in order to analyze and develop more reliable wash-off models. However, studies carried out to date are limited to very small and simplified catchments and the definition of hydraulic variables is not common. For instance, both Egodawatta et al. (2007) and Muthusamy et al. (2018) achieved meaningful results in the understanding of wash-off process using rainfall simulators in uniform 3 m2 field and 1 m2 laboratory catchments, respectively, without measuring
Introduction, results and conclusions
15
In this context, a very suitable facility was available to study wash-off process under controlled laboratory conditions at the Hydraulic Laboratory of the Center for Technological Innovation in Construction and Civil Engineering (CITEEC), University of A Coruña (UDC). This facility was designed and operated by the Water and Environmental Engineering Research Team (GEAMA) of the UDC, and was used previously by the author’s research group to develop and calibrate an urban dual drainage 2D/1D hydrodynamic model (Fraga 2015), and was also the topic of the author’s bachelor thesis (Naves 2012). Figure 1.6 includes a general image of the facility, which consists of a 1:1 scale street section of 36 m2 including a rainfall
simulator, an impervious surface formed by a sidewalk and a roadway, and a drainage system that drains generated runoff through two gully pots and a pipe network to a common outlet. This facility allows for the proper analysis of the mobilization of sediments in realistic and complex surface flows, the performance of gully pots and in-pipe sediment accumulation, erosion, and transport process, ensuring a high level of transferability of the results to field sites, while retaining the ability for accurate measurement of the variables involved.
Figure 1.6. Urban drainage physical model, general view, from Fraga (2015).
16
validate new and existing formulations. As mentioned above, the accurate measurement of input variables is especially valuable in the case of novel physically-based urban wash-off models. This allows for assessing the performance of models and parameters without considering disturbances caused by uncertainties, making it possible to simplify and develop new deterministic wash-off models for a better applicability in real field catchments.
4
Objectives
In view of the importance of pollutant wash-off phenomena in urban environments and the need for reliable and accurate data to develop and evaluate existing and new wash-off formulations, the main objective of this thesis is to carry out an extensive experimental campaign, where variables involved in wash-off process can be accurately measured in laboratory controlled conditions, to be used as a basis for the analysis and assessment of physically-based wash-off and sediment transport models. To this end, the following partial objectives were established:
Development of an experimental methodology to accurately measure TSS mobilization through the different parts of the physical model. In this way it is expected that the most important variables on which to focus our efforts will be determined.
Revision of the existing rainfall simulator, and the consideration of updating it, for more realistic rain generation in order to ensure the transferability of experimental results. This objective includes the accurate measurements of rain properties.
Hydraulic characterization of experiments. This is especially important since runoff flow is the basis for wash-off processes such as the detachment of particles due to the flow shear stress and their suspended transportation.
Conducting the extensive experimental campaign accurately by monitoring TSS mobilization through the different elements of the model and varying rain intensity and sediment grain sizes. The results obtained will be published in open data repositories for the greatest possible dissemination.
Introduction, results and conclusions
17
5
Main results
This thesis comprises 6 chapters. Following the current introduction (Chapter 1), the remaining chapters are organized in such a way that each one can be considered as an individual study, including its own and specific state of the art, methodology, results, and conclusions. The current section summarizes the main contents and results of the thesis and provides coherence and unity to the different studies therein, explaining how the objectives set out in the project are addressed. As stated in Section 3 (motivation for the current thesis), the background of this thesis is the study presented in Fraga (2015), in which the present author collaborated during his bachelor thesis (Naves 2012). It included the development and validation of an urban drainage 2D/1D hydrodynamic model using hydraulic experiments performed in a full-scale urban drainage physical model. This facility has shown its usefulness to represent and analyze the complex flows that are developed in urban catchments, also considering gully pot and pipe system flow interactions. Therefore, the urban drainage physical model has been used to carry out the wash-off and sediment transport experiments objective of this doctoral thesis.
First, preliminary wash-off tests are presented in Chapter 2. This study analyzed the mobilization of total TSS for different initial spatial distributions and sediment loads placed over the roadway surface of the physical model. The objectives of these tests were to develop a methodology to accurate measure TSS mobilization, identifying the main variables affecting sediment wash-off and sediment transport processes, and checking the feasibility of wash-off experiments. The rainfall simulator used in Fraga (2015), which consists of four nozzles covering the entire model surface, was used to generate a rainfall with a duration of 5 minutes and a mean rain intensity of 101 mm/h. Figure 1.7 shows a scheme of the physical model and the rain intensity map produced by the nozzle-based simulator used in preliminary tests.
18
At the sewer network outlet, flow discharges were registered and TSS pollutographs were obtained by manual grab samples and turbidity records. At the end of each test, a mass balance was performed between the initial load of sediments and the masses that remained in the different parts of the physical model (surface, gully pots, pipes, model outlet), checking the reliability of the performed experiments and allowing for the analysis of the mobilization of sediments through the model. Eleven experiments were configured to assess the influence of the initial load, spatial distribution method, distance from gully pot, and distribution area dimensions in the TSS wash-off process. The initial configuration of the tests are included in Figure 1.8.
Introduction, results and conclusions
19
The results here showed that sediment initial load and distribution cannot completely explain pollutant wash-off processes because other variables, such as the spatial rainfall distribution and the runoff characteristics, also affect the outlet pollutographs and system mass balances. This was concluded from the results of the experiments where the sediment load is distributed at different distances from the model curb (Figure 1.9). While the TSS pollutograph peak showed, as expected, a slight decrease and delay when the sediment load was moved away at 1 m from the curb, it was more than halved in the case of placing sediments at 2 m from the curb. As can be inferred from Figure 1.7, high intensities produced at around 1.5 m from the curb affect the mobilization of sediment placed at greater distances. These preliminary results addressed the first partial objective raised in Section 4 showing the capability of the procedure to accurately measure sediment wash-off, revealing the high influence of the simulated rainfall and the need for a precise definition of overland runoff to understand wash-off processes.
Figure 1.9. TSS pollutographs and discharges (a) and mass percentage final distributions (b) for a sediment load of 20 g/m, spread homogeneously over a 5-meter-long and 1-meter-wide surface, attached or separated 1 or 2 m from the curb. Values in parentheses indicate the mass error balance (ɛ𝑴).
20
final configuration of the rainfall simulator and the experimental measuring equipment used are shown in Figure 1.10.
Figure 1.10. General image of the new rainfall simulator (a). Detail of dripper circuits above the horizontal mesh (b).
Introduction, results and conclusions
21
Figure 1.11. Rain intensity maps and raindrop size and velocity distribution for the three rain intensities that can be generated. The solid curves represent the experimental relation between diameter and terminal velocity (Gunn and Kinzer 1949).
22
Figure 1.12. Experimental setup scheme for recording runoff videos used in the PIV analysis with fluorescent particles. The resulting steady velocity distribution generated by the lowest rainfall intensity is also plotted.
Introduction, results and conclusions
23
of surface velocities with the presence of raindrops. Finally, photogrammetry was positively assessed to obtain physical model elevations for hydraulic modelling purposes.
Figure 1.13. Elevation maps measured by traditional point survey (first row) and the SfM photogrammetric technique (second row). The velocity distributions results from the implementation of the topographies in a 2D shallow water model, in the area attached to the curb and for the lowest rain intensity, were plotted next to each elevation map.
24
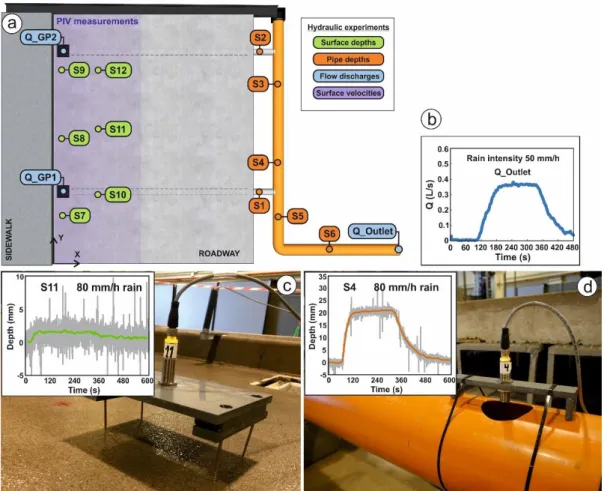
Figure 1.14. Surface and in-pipe depth, flow discharge, and surface velocity measuring points in hydraulic experiments (a). Flow discharge at the pipe system outlet (b),and surface (c) and in-pipe (d) water depths for the highest rain intensity.
Once the hydraulics of the experiments was precisely determined, an extensive experimental campaign was performed accurately measuring TSS mobilization through the urban drainage physical model from given, accurately known initial sediment conditions. The three different rain intensities (30, 50 and 80 mm/h) and five sediment granulometries (d50
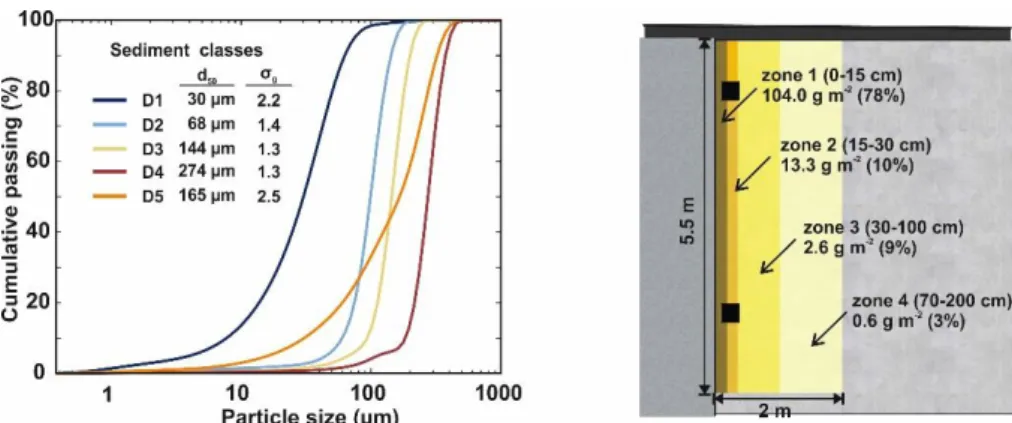
ranging from 30 to 275 microns) were tested in 23 wash-off and sediment transport experiments, which are also presented in Chapter 5. Figure 1.15a plots sediment classes granulometries that were placed over the surface in a realistic way (Figure 1.15b) as initial sediment conditions of each test.
Introduction, results and conclusions
25
Figure 1.15. Particle size distribution of the five sediment classes used (left). Mean diameter and gradation coefficients (𝝈𝒈= √𝑫𝟖𝟒⁄𝑫𝟏𝟔) are also indicated in the plot. Sediment initial
distribution over the model surface (right).
In these experiments, simulated rainfall was generated for 5 minutes, and TSS and Particle Size Distribution (PSD) samples at the entrance of the gully pots and at the pipe system outlet were collected to analyze the mobilization of the different fractions of particles through the model. PSD samples are especially interesting for the continuous granulometry (sediment class D5 in Figure 1.15) to analyze the different behavior of particles depending on their grain size in the same test. In addition, online turbidity records were registered at the pipe system outlet to obtain on-line TSS concentrations following the methodology developed in the preliminary tests. The variables considered in these experiments and the measuring points are presented in Figure 1.16.
26
The results of measuring TSS mobilization during the experiments for the five sediment classes and the three rain intensities at the entrance of the gully pots and at the pipe system outlet are shown in Figure 1.17. Particle sizes are presented in these results as the key variable in the wash-off process. The finest sediment (sediment class D1 with a mean diameter of 30 µm) produced the highest concentration at the gully pots and at the pipe system outlet with a large difference with respect to other particle sizes. In addition, the TSS concentrations measured for the continuous granulometry D5 (d50=165 µm), both at the
gully pots and at the pipe system outlet, were between those obtained for sediments D2 (d50=68 µm) and D3 (d50=144 µm). Therefore, we can see that considering the mean particle
size as representative can lead to erroneous estimates in modelling wash-off.
Figure 1.17. Total suspended solids (TSS) results in both gully pots and the pipe system outlet for the five different grain sizes (D1-D5) and rain intensities of 80, 50 and 30 mm/h.
Introduction, results and conclusions
27
of sediment in the different parts of the physical model and to ensure the reliability of the experimental results. The sediment masses obtained from each part of the model are presented in Figure 1.18 for the different rain intensities and sediment granulometries tested. The errors in the mass balances between the initial surface sediment mass and the masses collected at the end of the experiments plus the sediment washed from the physical model during the experiment were below 5%. This result is very satisfactory in consideration of the phenomena under study and to ensure the reliability of the experimental results. The PSD of mass balance samples were also measured using a laser coulter particle size analyzer in order to analyze the deposition of the different grain sizes at the end of the experiments.
Figure 1.18. Mass balances results for the five different grain sizes (D1-D5) and rain intensities of 80, 50 and 30 mm/h.
28
drainage system (surface, gully pots, in-pipe) without considering uncertainties in the input variables. Two additional packages (Naves et al. 2019d, Naves et al. 2019e) are provided to include detailed raw and processed data regarding the PIV analysis and the SfM photogrammetric technique, respectively. These datasets can be used to assess and optimize seeded and unseeded PIV techniques and in the study of the novel application of photogrammetric techniques for hydraulic modelling purposes, respectively.
The final chapter of this thesis (Chapter 6) presents the application of the TSS concentration results at the gully pots to assess and analyze a physically-based urban wash-off model, which uses the Hairsine-Rose formulation coupled with Iber, a 2D shallow water model developed by the author’s research group. Figure 1.19 includes the model predictions obtained in the analysis for the experiments with rain intensities of 50 and 80 mm/h and sediment classes D2 and D3, respectively. The study has shown that the flexibility of the model allowed for the replication of the laboratory results from accurately measured initial conditions by tuning the six H-R model parameters. However, different sets of parameters showed similar TSS results, indicating that this flexibility also leads to identifiability problems when calibrating the model.
Figure 1.19. TSS experimental results and five best-fitted simulations for the experiments with rain intensities of 50 (up) and 80 mm/h (down) and sediment classes D2 and D3, respectively. The parameter sets of the five best-fitted predictions are also included.
Introduction, results and conclusions
29
necessary to choose the most important parameters and to simplify the model in order to deal with identifiability. The accurate measurement of the input variables and the precise definition of hydraulics have made it possible to separate the individual contribution of the parameters of the Hairsine-Rose sediment transport model and to analyze their influence in the total washed off mass and the TSS peak at both gully pots. Figure 1.20 shows the sensitivity of the washed off mass in gully pot 1, obtained using both the Standardized Regression Coefficients method and the Extended Fourier Amplitude Test, to the Hairsine-Rose parameters for the 12 tests considered in this study. The analysis showed that both the total washed off mass and the TSS peak concentration were highly sensitive to the critical mass (𝑀𝑠𝑐𝑟), as this parameter considers the reduction in the detachment of particles due to a lack of sediment on the impervious surfaces. In addition, rain- (𝛼0, ℎ0) and flow-driven (𝐹) detachment parameters were presented as key for smaller (mean grain sizes of 30 and 68 µm) and larger (144 and 274 µm) sediment particles, respectively, with 𝑏 and Ω0 being almost negligible. The differences between the total (bars with dark colors) and first order effect indices (bars with light colors) in Figure 1.20b show the variance of the results due to interactions between parameters. It has been found that interactions play an important role in the results, especially in the TSS peak concentration and in the larger diameters (sediment classes 3 and 4) for the total washed off mass. This has highlighted the need for sensitivity results to simplify the model before calibration.
30
The relative importance of hydraulics, initial sediment conditions, and model parameters in model outputs has been also investigated to ensure the transferability of the results to real field studies, where it is not possible to define the model input variables with the same degree of accuracy as in the laboratory physical model. Figure 1.21 includes the local sensitivity results for the rain intensity of 30 mm/h and sediment class D1 test. The initial load of sediment and the mean grain size were seen to be the most important variables, thus underlining the need for very accurate measurements in order to avoid the variability associated with the build-up process affecting the results of the model. This need for accurate input variables, together with the high computational cost of the model, limit current applications to real-world catchments. However, model speedup and improvements in analysis efficiency are being developed nowadays and more laboratory and field studies should be performed to increase the understanding of input variables and model parameters. The results obtained are promising and merit further investigation in order to work on treatment and management techniques to minimize the impact of urban surface contaminants on urban environment.
Figure 1.21. Sensitivity results for the Elementary Effects method for the 30 mm/h and sediment class D1 test. Plots show the sensitivity to the total washed off mass through gully pot 2. The ranking of the three most influential input factors is shown in the upper-left corner of the plot.
Introduction, results and conclusions
31
6
General conclusions
In this thesis, an extensive experimental dataset has been obtained by analyzing the wash-off and sediment transport processes through an urban drainage physical model. This dataset addresses the lack of accurate data to be used in developing more reliable urban wash-off and sediment transport models. The presented experiments are performed in a 1:1 scale physical model, considering complex surface flows developed next to curbs or in gully pot surroundings and using a realistic rainfall simulator, ensuring thus a high transferability of the results to field applications. Moreover, in addition to the accurate measurement of the variables involved in TSS mobilization, hydraulic calibration data is also provided to precisely represent overland flow, which is key in the detachment and transport of sediment particles. These data have made it possible to analyze the performance of a physically-based urban wash-off approach, and have also demonstrated its usefulness. In this research, then, the following main conclusions have been drawn:
In preliminary tests, an experimental methodology has been developed to accurately measure the wash-off and sediment transport processes. The procedure includes a final mass balance that made it possible to ensure and quantify the reliability of the experimental results in each test, resulting in mass balance maximum errors of around 9.4%, which are considered satisfactory considering the phenomena under study. Results showed that sediment initial load and distribution cannot completely explain pollutant wash-off processes because other variables, such as the uniformity of the rain, greatly affect the outlet pollutographs and system mass balances. A precise definition of overland flow has also been found essential to understand processes involved in wash-off phenomena.
Accordingly, a new drop-forming rainfall simulator was developed to replace the one used in the preliminary tests, in order to ensure the transferability and comparability of experimental results with field studies. The new rainfall simulator is able to generate three different rainfalls with mean rain intensities of 32.9, 54.9 and 79 mm/h and an almost uniform distribution (Christiansen’s Uniformity Coefficients of 81, 89 and 91% respectively). In addition, a mean drop size of 0.95 mm and a drop impact velocity of over 85% of terminal velocity for the mean drop size were obtained by calibrating the simulator against natural rain measurements. This results in the new rainfall simulation design being an optimal tool for wash-off studies.
32
representation of the overland flow was achieved using a 2D shallow water model with a high-definition elevation map obtained using photogrammetric techniques. This study highlighted the need for detailed topography to accurately represent surface flow in very shallow water conditions and to assessed positively the visualization techniques used for hydraulic modelling purposes.
An experimental dataset concerning hydraulic, wash-off, and sediment transport experiments has been obtained using the three different rain intensities that the proposed new rainfall simulator is able to generate and five sediment classes with different granulometries (d50 ranging from 30 to 275 µm). The measurement of TSS,
particle size distributions, and flow discharges at the entrance of the gully pots and at the sewer system outlet presented the sediment granulometry as key variables for wash-off and sediment transport processes and reported that considering mean grain size as representative can lead to erroneous estimates modelling pollutant wash-off. The mobilization of sediments through the physical model depending on the sediment granulometry and the rain intensity was also analyzed by performing mass balances, which were also used to indicate the reliability of the experiments. Results showed that, even using the finest sediment and the highest rain intensity, only a fraction of the sediment is washed completely from the physical model. The errors found when performing the mass balances were below the 5% of the initial sediment mass, which is very satisfactory and demonstrate the accurate measurement of wash-off processes. Finally, the open access publication of the data makes our work replicable and provides essential data for testing and developing existing and new wash-off and sediment transport formulations.