RESUMEN
PASSMORE (1967) define el Pensamiento Crítico como un proceso que es a la vez reflexivo e imagina-tivo, cualidades imprescindibles en todo proceso de diseño. En este artículo nos centramos en la utiliza-ción del Pensamiento Crítico para mejorar lo que se ha dado en llamar Pensamiento Gráfico.
El trabajo se divide en dos partes complementa-rias. En la primera, se formula un marco teórico en torno a los conceptos de Pensamiento Crítico y
Pensamiento Gráfico, para proponer una metodología de enseñanza de la ingeniería que relacione ambos conceptos. En la segunda, se aplican dichos aspectos al estudio de una herramienta esencial dentro del pro-ceso de diseño, el diagrama, y a la manera de proyec-tar en la contemporaneidad.
Palabras clave:Pensamiento Crítico, Pensamiento Gráfico, Diagrama, Diseño.
ABSTRACT
Critical thinking is defined by PASSMORE (1967) as a process that is both reflexive and imaginative, essencial aspects of the design process. This paper focuses on the use of Critical Thinking to improve what we call Graphic Thinking.
The content is two fold. The first part establishes a theoretical framework around the concepts of
Critical Thinking and Graphic Thinking, in order to propose a methodology for engineering education through the combination of both concepts. The second one deals with those concepts, which are applied to one of the basic tools within the design process, the diagram, analysing through it the con-temporary way of designing.
Key words: Critical Thinking, Graphic Thinking, Diagram, Design.
Pensamiento crítico para el
Pensamiento gráfico
CAÑAS, IgnacioBAYOD, Carlos VELILLA, Cristina DE SAN ANTONIO, Carlos
1. Introducción
Todo pensamiento es difícilmente separable de su modo de expresión y formulación. Para que aparezca un objeto (intelectual, arquitectó-nico, industrial) de calidad es necesario que el proceso que lo ha generado sea a su vez de cali-dad. El Pensamiento Crítico (PC) y el Pensa-miento Gráfico (PG) son métodos pertenecientes a campos diferentes, pero que tienen en común la voluntad de sistematizar procesos complejos, ambos con la misma finalidad última: la resolu-ción de problemas, con medios y resultados de calidad.
En la primera parte de este trabajo se repasan los conceptos de PC y PG, así como sus más recientes aplicaciones al campo de la enseñanza del diseño en ingeniería. En un sentido amplio, la ingeniería consiste en desarrollar asociacio-nes heterogéneas entre elementos dispares (CHINCHILLA-MUNIESA, 2004). Es esencial, pues, proporcionar al ingeniero las herramientas con-ceptuales que le permitan manejar con soltura sistemas complejos. Creemos, por tanto, funda-mental dar a conocer dos métodos de sistemati-zación como son el PC y PG que pueden formar parte de una metodología de diseño y resolución de problemas propia del ingeniero. Incluso dando un paso más, avanzaremos unas notas de lo que creemos podría ser una metodología de enseñanza combinada de PC aplicado a PG.
En la segunda parte, se estudia el diagrama como instrumento de diálogo; monólogo del diseñador consigo mismo y diálogo con su grupo de trabajo o el cliente. “(…) Como medio, el diagrama obedece a una doble función: es una forma de anotación, analítica y reflexiva que resume; pero también es un instrumento de pensamiento, de síntesis y de producción que crea” (BIJLSMA-DEEN-GARRITZMAN, 1998). O según el Diccionario Metápolis de Arquitectura Avanzada (2001), “Como un médium, el diagra-ma juega un doble papel. Es un modo de nota-ción (de análisis, de reconocimiento y de refle-xión) pero también es una máquina de acción (generativa, sintética y productiva). Diagnóstico y respuesta. Mapa y trayectoria”. El modo en que el ingeniero usa el diagrama a veces favore-ce a la primera de estas funciones, a vefavore-ces a la última. Más a menudo el diagrama constituye una solución práctica que le posibilita a uno expresar de manera simple una complejidad en la comunicación con los miembros del equipo de trabajo, el cliente o el público general.
En este artículo nos centraremos en el diagra-ma como herramienta conceptual a través de la cual las cosas evolucionan, reapareciendo trans-formadas eventualmente (LOOTSMA, 2002). En los últimos años el diagrama ha ocupado un lugar esencial en los debates referentes al dise-ño arquitectónico. Nos serviremos de las más recientes teorías en torno al uso de los diagra-mas para tratar de importarlos y adaptarlos al proceso de diseño del ingeniero.
2. Pensamiento Crítico
El Pensamiento Crítico (PC) es ese modo de pensar según el cual el pensante mejora la cali-dad de su pensamiento al apoderarse de las estructuras inherentes al acto de pensar y some-terlas a estándares intelectuales (PAUL-ELDER, 2003). El PC ha dado lugar a multitud de meto-dologías de pensamiento aplicadas a los diferen-tes campos de la actividad humana que requie-ren una alta sistematización en sus procesos de razonamiento, análisis o toma de decisiones. El modelo que propone PAUL-ELDER, de extensa aplicación en la enseñanza, se resume así:
El modelo de Pensamiento Crítico elaborado por PAUL-ELDER (2003) ha sido adaptado a las necesidades específicas de la enseñanza de la ingeniería y publicado en 2006 como Engineering Reasoning (PAUL-ELDER-NIEWOEH-NER). Ésta guía proporciona un marco concep-tual y metodológico para el análisis y evaluación de las diferentes áreas temáticas de la discipli-na. Una primera aproximación a una aplicación de PC al proceso de diseño del ingeniero podría venir dada en los siguientes términos:
- PROPÓSITO:
¿Cuál es el propósito/objetivo de este dise-ño?
ESTÁNDARES INTELECTUALES UNIVERSALES
- CLARIDAD - EXACTITUD - PRECISIÓN - RELEVANCIA - PROFUNDIDAD - AMPLITUD - LÓGICA - IMPORTANCIA
→deben aplicarse a: ELEMENTOS DE PENSAMIENTO
- PROPÓSITO - PREGUNTA - INFORMACIÓN - CONCEPTOS - SUPUESTOS - CONSECUENCIAS - PUNTOS DE VISTA - IMPLICACIONES
- PREGUNTA:
¿Qué proceso satisfará los requerimientos del cliente?
- INFORMACIÓN:
¿Qué fuente de información es fiable/rele-vante?
- CONCEPTOS:
¿Qué marco teórico es aplicable a este pro-blema?
- SUPUESTOS:
¿Qué situaciones operativas/de contexto se asumen?
- CONSECUENCIAS:
¿Cuál es el rango posible de soluciones via-bles?
- PTOS. DE VISTA:
¿Qué otros actores/intereses merecen ser considerados?
- IMPLICACIONES:
¿Hasta qué punto influirá el diseño en su entorno?
3. Pensamiento Gráfico
El Pensamiento Gráfico (PG) es un concepto creado para designar el pensamiento asistido por el dibujo (LASEAU, 1989). Es utilizado habi-tualmente para describir el razonamiento que tiene lugar dentro de un proceso de diseño. Se trata, por tanto, de un tipo de dibujo que debe entenderse como un medio para descubrir, y no como una forma de expresión artística con una finalidad estética. El PG trata de los dibujos de proceso, en los cuales la imagen gráfica y el pen-samiento se encuentran interrelacionados, for-mando una unidad, de manera que la una no puede entenderse sin el otro. El éxito del PG en el proceso de diseño radica precisamente en el constante flujo de información que se da entre la mente del diseñador y la imagen dibujada, método especialmente estimulante para el des-arrollo de las ideas en el campo de la arquitectu-ra y la ingeniería.
El proceso de diseño
Si entendemos el proceso de diseño como un proceso de resolución de problemas, podemos apoyarnos en el modelo que describe LASEAU (1989) de cinco pasos:
1. Definición del problema: identificar especí-ficamente el problema y los objetivos. 2. Desarrollo de alternativas: explorar
posi-bles soluciones, desarrollar alternativas. 3. Evaluación: examinar las distintas
solucio-nes según los criterios de los objetivos.
4. Selección: en base a los resultados de la evaluación, seleccionar la mejor solución (o bien la optimización de la solución ele-gida con aspectos de las otras alternati-vas).
5. Comunicación: la solución final al proble-ma debe ser descrita (traducida) al forproble-mato en que pueda ser útil (continuable) para la siguiente etapa del proyecto.
La comunicación en el proceso de diseño: La transparencia
El concepto de transparencia es usado aquí en el sentido de desvelar, hacer visibleel pro-ceso de proyecto (JAQUE, 2004).
Los dibujos generados durante el proceso de diseño tienen importancia porque muestran cómo se piensa sobre un proyecto, no sólo lo que se piensa de él. En este sentido, el dibujo será tanto más eficaz, más comunicable, cuanto más transparente sea, esto es, cuanta más infor-mación ofrezca acerca del proceso real que se ha seguido y las condiciones de contexto que han dado forma al proyecto.
4. Pensamiento Crítico para el
Pensamiento Gráfico: notas
metodológicas
El Pensamiento Crítico se caracteriza básica-mente por la suspensión del juicio apriorístico y por el empleo sistemático de la investigación en
forma de búsqueda de pruebas o informaciones adicionales a la hora de resolver un problema. Un pensamiento no-crítico supone la aceptación inmediata de información de forma irreflexiva. El ingeniero que piensa críticamente elabora un juicio (de las variables que identifican el proble-ma), efectúa una evaluación (de las posibles soluciones) y emite una conclusión.
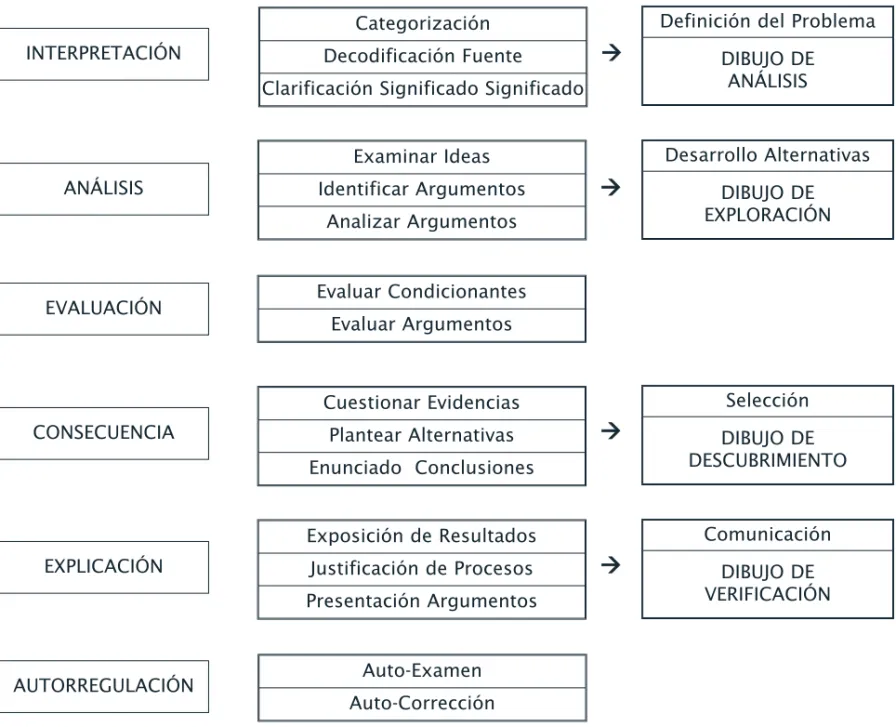
Si nos servimos del listado de capacidades cognitivas propias del Pensamiento Crítico que se extrae de The Delphi Report(FACIONE, 1990) y lo aplicamos a las etapas que dan forma a un proceso de diseño (LASEAU, 1989) obtenemos un esquema de las capacidades intelectuales que deben acompañar al proceso creativo:
5. El diagrama
diagrama. (Del lat. diagramma, y este del gr. διατραµµα, diseño).
Dibujo geométrico que sirve para demostrar una proposición, resolver un problema o figurar de una manera gráfica la ley de variación de un fenómeno. 2. Dibujo en el que se muestran las relaciones entre las diferentes partes de un con-junto o sistema. (RAE. Diccionario de la Lengua Española. Edición on line. www.rae.es, acc. 2007).
A diferencia del croquis, que se define por la técnica (diseño hecho sin precisión y sin apoyo
INTERPRETACIÓN
ANÁLISIS
EVALUACIÓN
CONSECUENCIA
EXPLICACIÓN
AUTORREGULACIÓN
Categorización Decodificación Fuente Clarificación Significado Significado
Examinar Ideas Identificar Argumentos
Analizar Argumentos
Cuestionar Evidencias Plantear Alternativas Enunciado Conclusiones
Exposición de Resultados Justificación de Procesos Presentación Argumentos
Evaluar Condicionantes Evaluar Argumentos
Auto-Examen Auto-Corrección
Definición del Problema DIBUJO DE
ANÁLISIS
Desarrollo Alternativas DIBUJO DE EXPLORACIÓN
Selección DIBUJO DE DESCUBRIMIENTO
Comunicación DIBUJO DE VERIFICACIÓN
de instrumentos geométricos) o el boceto, que se caracteriza por el lugar que ocupa en el pro-ceso creativo (apunte previo a la ejecución de una obra artística), el diagrama se define por su utilidad, para qué sirve, por lo que engloba toda técnica y admite cualquier lugar dentro del pro-ceso de diseño.
El diagrama es una técnica abstracta. Trabaja mediante la reducción, la abstracción y la repre-sentación. Contrariamente a un esquema, donde se sintetiza al máximo, el diagrama contiene toda la información del proceso de proyecto (SORIANO, 2002).
ANTES. Tradicionalmente el diagrama era un esquema geométrico inicial.
HOY. El diagrama es la expresión de un procedimiento:
¿Hay alguna actividad que se pueda represen-tar con una parada en el tiempo? –Sí..
¿Hay alguna actividad que se pueda proyectar con una parada en el tiempo? –No.
Al proyectar es necesario generar documen-tos abierdocumen-tos y que contengan el valor del tiempo. Por lo tanto, el diagrama no es un instrumento de representación. Es un proyecto. El diagrama contiene el proyecto y el resultado (SANTACA-NA, 2002).
Importando el concepto utilizado por CHIN-CHILLA-MUNIESA (2004), podría decirse que el diagrama es un instrumento de restitución, res-tituyeel proyecto al que hace referencia, lo sus-tituye en su totalidad, lo traduce o lo describe. El diagrama es una herramienta autosuficiente, porque es capaz de contener toda la compleji-dad del proyecto. Como afirma SORIANO (2002), un diagrama hoy es arquitectura [ingeniería]. No es un esquema, una simplificación, un dibujo preparatorio que necesita ser adaptado a otro lenguaje o disciplina específica. Es un mecanis-mo de intelecto tanto comecanis-mo imagen final de la
arquitectura [ingeniería]. El diagrama aboga por la ejecución directa entre pensamiento y ejecu-ción. Su valor instrumental reside en que restitu-ye el prorestitu-yecto así como el proceso que lo gene-ra.
6. El Diagrama: una clasificación
Para la presente clasificación no se han teni-do en cuenta otras variables definitorias tales como técnicas, soportes o instrumentos, ni su campo disciplinar de aplicación.
A. SEGÚN SU VINCULACIÓN AL PROYECTO A.1. AUTOSUFICIENTES
Son expresiones de ideas autónomas, con valor conceptual por sí mismos, aislados del proceso de proyecto.
A.2. INSTRUMENTALES
Sólo tienen sentido como parte específica de un proceso creativo.
B. SEGÚN SU TEMA PREDOMINANTE B.1. ASOCIATIVOS
Asociación de valores específicos que usualmente no podrían ponerse en re-lación, u ocupando el mismo espacio común.
B.2. CRONOGRÁFICOS
No representa un estado en el tiempo, sino su propia evolución.
B.3. DESCRIPTIVOS
Representan un estado, una posición, si-tuación concreta y final.
B.4. DISPONENTES
Disposición frente a composición. No re-glas, sino negociaciones.
B.6. DE PROCEDIMIENTOS
Señalan procesos sensibles a modificar sus reglas para adaptarse, en cada paso, una situación nueva. Son diagramas abier-tos.
B.7.OPERATIVOS
Instrucciones que fijan líneas de compor-tamiento.
B.8. SINTÉTICOS
C. SEGÚN SU FINALIDAD ÚLTIMA C.1. EXPLORATORIOS
C.2. RECOPILATORIOS C.3. ANALÍTICOS
7. Método
a. El diagrama comunicable
Tradicionalmente se tiende a establecer una división en el conjunto de los documentos que componen un proyecto, diferenciando entre documentos deproceso(de trabajo) y documen-tos finales(de comunicación o exposición públi-ca).
El diagrama dentro de un proceso contempo-ráneo de diseño rompe de inicio con esa dicoto-mía diagrama de trabajo/diagrama de presen-tación. El diagrama tiene hoy la capacidad de ser instrumentalizado como herramienta de trabajo, y a la vez la cualidad de tener un formato comu-nicable y, por tanto, continuablepor otros.
b. El diagrama optimizable
El proceso de proyecto pasa a entenderse como un proceso de incremento de su eficacia para responder a los distintos actores o intere-ses que definen el problema (CHINCHILLA-MUNIESA, 2004). Por tanto, el diagrama, que se abre al inicio del proceso, permanece abierto recibiendo los cambios que sobre él se aplican, quedando así registrada y legible la evolución en el propio diagrama.
c. El diagrama evaluable
Cada diagrama que compone el proyecto lleva incorporado su propio sistema de evalua-ción, de manera que se tenga constancia en todo momento del grado en el que satisfacen los requerimientos del cliente, y el estado en que se encuentra el proyecto en cada fase del proceso. Es una forma de objetivizar, universalizar y transparentar el proceso de diseño.
8. Conclusiones
El estudio que proponemos combina los prin-cipios metodológicos de Pensamiento Crítico, ampliamente aplicados a la enseñanza, con los aspectos que definen el Pensamiento Gráfico, con el fin de avanzar una sistematización del proceso de diseño en ingeniería. El resultado al que se ha llegado toma forma de esquema pre-liminar de una metodología combinada que pueda ser de utilidad para el ingeniero a la hora de resolver problemas complejos. El método se articula en torno a una serie de capacidades básicas para asegurar la calidad del resultado-diseño: interpretación, análisis, evaluación, con-secuencia, explicacióny autorregulación.
Figura 5. Proyecto de Parque Forestal de Valdebebas, J. Álvarez-Builla, 2006
COMUNICABLE: el propio documento CAD de trabajo sirve como documento final de presentación.
Al aplicar estos puntos a la utilización del dia-grama como elemento sintetizador del diseño, se describen tres características que definen el proceso proyectual contemporáneo: comunica-ble, optimizable y evaluable. El diagrama temporáneo debe operar en torno a estos con-ceptos para convertirse en una herramienta que
sea capaz de restituir eficazmente la realidad a la que da respuesta, permitiendo un alto grado de transparencia en todas las fases del proceso de diseño. Con estos resultados no sólo se busca detectar una nueva teoría del diagrama sino sentar las bases de una nueva metodología del diseño.
Referencias
[1] F. Soriano, Diagramas @, pp. 4-8, Índice de Diagramas, pp.12-13 Fisuras de la Cultura Contemporánea, n. 12 1/2 , Madrid, 2002.
[2] A. Santacana, También una Fotografía, pp. 186-188.
Fisuras de la Cultura Contemporánea, n. 12 1/2 , Madrid, 2002.
[3] J. M. de la Puerta, El Croquis, Proyecto y Arquitectura, Celeste Ediciones, Madrid, 1997.
[4] P. Laseau, Graphic Thinking for Architects and Designers, Van Nostrand Reinhold, New York, 1989.
[5] R. Paul y L. Elder, La mini-guía para el Pensamiento Crítico. Conceptos y Herramientas. Foundation for Critical thinking, Sonoma, CA., 2003.
[6] R. Paul, R. Niewoehner y L. Elder, Engineering Reasoning, Foundation for Critical Thinking, Sonoma, CA., 2006.
[7] I. Chinchilla y F. Muniesa, La Controversia como Herramienta Proyectual, La Sostenibilidad en el Proyecto Arquitectónico y Urbanístico, Mairea Libros, Madrid, 2005.
form part of the engineer’s own design and problem-solving methodology, to be fundamental. Going still further, we provide some notes on what we believe could be a combined teaching method of CT applied to GT.
The second part discusses the diagram as an instrument for dia-logue - a monodia-logue of the desig-ner with himself and a dialogue with a working group or with the client. “…as a medium, the dia-gram has two functions: it is a form of analytic and reflexive note-taking that summarises, but it is also an instrument for thin-king, for synthesis and for pro-duction that creates” (Bijlsma-Deen-Garritzman, 1998). Or, according to the Diccionario Metápolis de Arquitectura Avanzada (2001), “The diagram has two roles as a medium. It is a mode of note-taking (for analysis, recognition and reflection) but it is also a machine for action (gene-rating, synthesising and produ-cing). Diagnosis and response. Map and route.” The way in which the engineer uses a diagram sometimes favours the first of these functions and sometimes the second. More often, the dia-gram is a practical solution that allows a complexity to be expres-sed simply in communication with members of the work team, the client or the general public.
This article concentrates on the diagram as a conceptual tool through which things develop, eventually to re-appear transfor-med (Lootsma, 2002). In the last few years, the diagram has occu-pied an essential place in debates on architectural design. We can use the most recent theories on the use of diagrams to import them and adapt them to the engi-neer’s design process.
2. Critical thinking
Critical thinking (CT) is a way of thinking in which the thinker
improves the quality of his thought by using the structures inherent in the act of thinking and submitting them to intellectual standards (Paul-Elder, 2003). CT has given rise to a multitude of thinking methods applied to diffe-rent fields of human activity that require a high systemisation in their processes of reasoning, analysis and decision-taking. The model proposed by Paul-Elder, used extensively in teaching, is summarised thus: Figure 1.
The critical thinking model pre-pared by Paul-Elder (2003) has been adapted to the specific needs of teaching engineering and published in 2006 as Engineering Reasoning
(Paul-Elder-Niewoehner). This guide provides a conceptual framework and method for analysing and evalua-ting the thematic areas in the dis-cipline. A first approach to an application of CT to the enginee-ring design process could be given in the following terms:
- PURPOSE:
What is the proposal/objective of this design?
- QUESTION:
What process will satisfy the client’s requirements? - INFORMATION:
What source of information is reliable/relevant?
- CONCEPTS:
What theoretical framework is applicable to this problem? - ASSUMPTIONS:
What operational/contextual situations are assumed? - INFERENCES:
What is the possible range of viable solutions?
- POINTS OF VIEW:
What other persons/interests should be considered? - IMPLICATIONS:
Up to what point will the design influence its surroundings?
Abstract
Critical thinking is defined by Passmore (1967) as a process that is both reflexive and imaginative, essential aspects of the design process. This paper focuses on the use of critical thinking to improve what we call graphic thin-king.
The content is twofold. The first part establishes a theoretical fra-mework around the concepts of critical thinkingand graphic thin-king, in order to propose a method for teaching engineering through the combination of both concepts. The second deals with those concepts, which are applied to one of the basic tools within the design process, the diagram, analysing the contemporary way of designing.
Keywords: critical thinking, gra-phic thinking, diagram, design.
1. Introduction
All thinking is difficult to separa-te from its mode of expression and formulation. In order for an object (intellectual, architectural, industrial) to appear with quality it is necessary that the process that generated it be of quality too. Critical thinking (CT) and graphic thinking (GT) are methods that belong to different fields but they share the process of systemising complex processes with the same end: the solving of problems with quality means and results.
The first part of this article dis-cusses the concepts of CT and GT as well as their most recent appli-cations in the field of teaching design in engineering. In its widest sense, engineering consists of developing heterogeneous associations between separate ele-ments (Chinchilla-Muniesa, 2005). It is therefore essential to provide the engineer with the conceptual tools that allow him to handle complex systems with confidence. We therefore consider that tea-ching two methods of systemisa-tion such as CT and GT, which can
made without precision and without the use of geometric ins-truments) or a draft, defined by the place it occupies in the creati-ve process (notes before carrying out an artistic work), the diagram is defined by its usefulness,that for which it serves, so that it includes all techniques and allows any place within the design pro-cess.
The diagram is an abstract tech-nique. It works by reduction, abs-traction and representation. Unlike a schematic, which is synthesised to the maximum, the diagram contains all the informa-tion of the design process (Soriano, 2002).
IN THE PAST. Traditionally, the diagram was an initial geometric schematic.
TODAY. The diagram is the expression of a procedure:
Figure 4.
Is there any activity that can be shown by stopping time? Yes.
Is there any activity that can be projectedon a stoppage in time? No.
When projecting, it is necessary to generate open documents that contain thetimevalue. Therefore, the diagram is not an instrument of representation. It is a design. The diagram contains the design and the result (Santacana, 2002). Importing the concept used by Chinchilla-Muniesa (2004), it can be said that the diagram is an ins-trument of restitution, it restores the design to which it refers, it replaces it in its entirety, it trans-lates or describes it. The diagram is a self-sufficient tool because it can contain all the complexity of the design. As Soriano (2002) sta-tes, a diagram today is architectu-re [engineering]. It is not a sche-matic, a simplification, a prepara-tory drawing that needs to be adapted to another language or to a specific discipline. It is an inte-llectual mechanism and a final image of the architecture [engine-ering]. The diagram is a direct connection between thought and undertaking. Its instrumental
3. Graphic thinking
Graphic thinking (GT) is a con-cept created to designate thinking assisted by drawing (Laseau, 1989). It is normally used to des-cribe the reasoning that takes place within a design process. It is therefore a type of drawing that must be understood as a means for discovery and not as a form of artistic expression with aesthetic purposes. GT is concer-ned with process drawings in which the graphical image and thought are inter-related, forming a unit, so that one cannot be understood without the other. The success of GT in the design process is due precisely to the constant flow of information bet-ween the designer’s mind and the drawn image, a method especially stimulating for developing ideas in the fields of architecture and engineering.
The designprocess
If we understand the design process as a problem-solving pro-cess, we can use the five step model described by Laseau (1989):
1. Definition of the problem: specifically identify the problem and objectives.
2. Development of alternatives: explore possible solutions, develop alternatives. 3. Evaluation: examine the various solutions according to the criteria of the objectives. 4. Choice: based on the results of the evaluation, choose the best solution (or the optimisa-tion of the chosen soluoptimisa-tion with aspects of the other alternati-ves).
5. Communication: the final answer to the problem must be described (translated) in the for-mat that will be useful ( conti-nuable) for the next stage of the project.
Communication in the design process: Transparency
The concept of transparencyis used here in the meaning of
reve-alingor making visiblethe design process (Jaque, 2004).
The drawings generated during the design process are important because they show what is being thought about a project, not only what is being thought of it. In this sense, the drawing will be more effective, more communicable, the more transparent it is, that is, the more information it offers on the real process that has been followed and the contextual con-ditions that have given form to the design. (Figure 2)
.
4. Critical thinking for graphic thinking: method notes
Critical thinking basically featu-res the suspension of initial judg-ment and the systematic use of research in the form of searching for proof or information when sol-ving a problem. Non-critical thin-king involves the unthinthin-king and immediate acceptance of informa-tion. The engineer who thinks cri-tically develops a judgment (of the variables that identify the pro-blem), carries out an evaluation (of the possible answers) and arri-ves at a conclusion.
If we use the list of cognitive capacities of critical thinking from The Delphi Report(Facione, 1990) and we apply it to the stages that form the design process (Laseau, 1989), we arrive at a scheme of the intellectual capabilities that must accompany the creative pro-cess: Figure 3.
5. The diagram
diagram (from the Latin dia-gramma, from the Greek διατραµ− µα, design).
A geometric drawing that serves to demonstrate a proposition, solve a problem or show graphi-cally the law of variation of a phe-nomenon. 2. Drawing showing the relationships between the various parts of an assembly or system. (Diccionario de la Lengua Española. On-line edition.
7. Method
a. The communicable diagram
Traditionally, a division has been made within the group of docu-ments in a design, differentiating between process(working) docu-ments and final (communication or publishing) documents. Within the contemporary design process, the diagram breaks from the start with this working/presentation diagram dichotomy. Today, the diagram can be instrumentalised as a working tool and at the same time can have a communicable format, one which is continuable by others. (Figure 5).
b. The optimisable diagram
The design process becomes understood as a process of increa-sing its effectivenessto respond to the various persons or interests that define the problem
(Chinchilla-Muniesa, 2004). Thus the diagram opened at the start the process remains open, recei-ving the changes applied to it, with the development thus remai-ning recorded and legible in the diagram itself. (Figure 6).
c.The evaluable diagram
Each diagram in the project includes its own system of evalua-tion, showing at all times the degree to which the client’s requi-rements are satisfied and the state of the project in each phase of the process. This is a form of making the design process objec-tive, universal and transparent.
8. Conclusions
The study that we propose com-bines the methodological princi-ples of critical thinking, widely applied in teaching, with the aspects that define graphic thin-king, in order to provide a syste-misation of the design process in engineering. The result takes the form of a preliminary schematic of a combined methodology that could be used for engineering when solving complex problems. The method revolves around a series of basic capabilities to ensure the quality of the results/design: interpretation,
analysis, evaluation, consequence, explanation and self-regulation.
Applying these points to the use of the diagram as a synthesising element in design, three proper-ties are described that define the contemporary design process: communicable, optimisableand evaluable. The contemporary dia-gram must operate around these concepts to become a tool that can effectively restorethe reality to which the response is given, allowing a high degree of transpa-rency in all phases of the design process. With these results, not only is a new theory of the dia-gram sought but also the bases of a new design method.
Figure 2. Plan, bus station, Talavera de la Reina. S&Aa. (The plan was generated using the entry and exit routes of the trans-port flows.)
Figure 4. Ben Van Berkel & Caroline Bos, Moebius house, 1995
Figure 5.Design for Valdebebas forest park,
J Álvarez-Builla, 2006.
COMMUNICABLE: the working CAD document itself serves as the final presentation document.
Figure 6. Telecommunications tower in
El Turó de la Rovira, Barcelona. Actar, Cecil Balmond (Ove Arup), 2001.
OPTIMISABLE: the diagram itself records the changes and modifica-tions that were made during the process, because these are directly affect it.
value lies in the fact that it resto-res the design as well as the pro-cess that generates it.
6. The diagram: a classification
This specification has not consi-dered other defining variables such as techniques, media or ins-truments, nor the disciplinary field of its application.
A. ACCORDING TO ITS CONNEC-TION WITH THE DESIGN
A.1. SELF-SUFFICIENT
These are expressions of self-contained ideas, with a con-ceptual value to themselves, isolated from the design pro-cess.
A.2. INSTRUMENTAL
These have meaning only as a specific part of a creative pro-cess.
B. ACCORDING TO THEIR PREDO-MINANT SUBJECT
B.1. ASSOCIATIVE
Association of specific values that are usually cannot be related, or occupying the same common space. B.2. CHRONOGRAPHIC These do not show estate in time it but its development. B.3. DESCRIPTIVE
Show a state, a position, a specific and final situation. B.4. ARRANGEMENTS Arrangement in a composi-tion. No rules, but negotia-tions.
B.5. STRUCTURAL B.6. PROCEDURAL
Show processes the rules of which can be adapted at each step to a new situation. These are open diagrams.
B.7. OPERATIONAL
Instructions that set lines of behaviour.
B.8. SYNTHETIC
C. ACCORDING TO THEIR FINAL PURPOSE
UNIVERSAL INTELLECTUAL STANDARDS
-CLARITY - ACCURACY - PRECISION - SIGNIFICANCE - DEPTH - BREADTH - LOGICAL VALIDITY - RELEVANCE
→must be applied to: ELEMENTS OF THOUGHT
- PURPOSE
- QUESTION AT HAND - INFORMATION - CONCEPTS - ASSUMPTIONS - INFERENCES - POINTS OF VIEW - IMPLICATIONS
Figure 1. Paul-Elder critical thinking model
INTERPRETATION
ANALYSIS
EVALUATION
CONSEQUENCE
EXPLANATION
SELF-REGULATION
Categorisation
Source decoding
Clarification of meaning
Examine ideas
Identify arguments
Analyse arguments
Question evidence
Plan alternatives
Announce conclusions
Description of results
Justification of processes
Presentation of arguments Evaluate conditioners
Evaluate arguments
Self-examination
Self-correction
Definition of problem
ANALYSIS DRAWING
Develop alternatives
EXPLORATION DRAWING
Choice
DISCOVERY DRAWING
Communication
VERIFICATION DRAWING