15
IMPLEMENTATION OF SAFETY BASED
INCENTIVES IN PUBLIC PRIVATE
PARTNERSHIPS (PPPS): AN EMPIRICAL
ANALYSIS FOR THE CASE OF SPAIN
Thais Rangel1, José Manuel Vassallo2 and Blanca Arenas3
1, 2 Transport Research Centre (TRANSyT), ETSI Caminos, Canales y Puertos, Technical University of Madrid
3University Institute for Automobile Research (INSIA), ETSI Industriales, Technical University of Madrid
Email: [email protected]
Public Private Partnerships (PPPs) are mostly implemented to circumvent budgetary constraints, and to encourage efficiency and quality in the provision of public infrastructure in order to reach social welfare. One of the ways of reaching the latter objective is by the introduction of performance based standards tied to bonuses and penalties to reward or punish the performance of the contractor. This paper focuses on the implementation of safety based incentives in PPPs in such a way that the better the safety outcome the greater larger will be the economic reward to the contractor. The main aim of this paper is to identify whether the incentives to improve road safety in PPPs are ultimately effective in improving safety ratios in Spain. To that end, Poisson and negative binomial regression models have been applied using information of motorways of the Spanish network of 2006. The findings indicate that even though road safety is highly influenced by variables that are not much controllable by the contractor such as the Average Annual Daily Traffic and the percentage of heavy vehicles, the implementation of safety incentives in PPPs has a positive influence in the reduction of fatalities, injuries and accidents.
Keywords: Pubic Private Partnerships, performance based standards, road safety, incentives, motorway concession contract.
INTRODUCTION
16
infrastructure to a private consortium, in exchange for which that consortium receives the right to charge a fee to the user or to the government on behalf of the user, for a period of time contractually agreed in advance (Vassallo and Gallego 2005).
One of the key aspects of PPPs is to encourage the private sector to manage and operate the infrastructure in the best way. To that end, in the last few years, PPPs are evolving from mere demand-based contracts (when the revenues of the contractor are related to the traffic demand) to performance-based contracts referred to different aspects such as availability, congestion, state of the pavement, safety, and so on. Consequently, the revenues of the contractor tend to depend more and more to the quality of the services rather than on traffic demand (Harding et al 2010).
Two reasons lie behind this trend. First, PPP contractors can manage better the service performance they offer than the traffic flows in the infrastructure. And second, by encouraging the PPP contractors to provide a better service, by aligning the social and the private benefits, they will end up producing a more efficient outcome for society.
Traditionally, most of the infrastructure management contracts, including PPPs, had not introduced explicit incentives to improve quality. However, nowadays most PPP contracts are encouraging the introduction of incentives to foster the contractor to provide an optimal quality level. In this way, the contracts incorporate a set of standards that the contractor must fulfill. If the contractor fails to comply with these requirements, the public authority will penalize the contractor or even rescind the contract. There are two ways of rewarding or penalizing the contractor: incentives related to the extension of the deadline of the project, and incentives related to increase the fee to be paid to the PPP contractor.
This approach has moved many countries to introduce performance based indicators tied to bonuses and penalties in their PPP contracts. Some countries such as United Kingdom, Finland, Portugal and Spain have introduced these kind of incentives.
17
The authors have not found any empirical study about safety incentives offered to the PPP contractors.
ANALYSIS OF EXPERIENCES IN THE INTRODUCTION
OF ROAD SAFETY INCENTIVES IN EUROPE
Europe is the world‘s region with the greater tradition of incorporating performance-based incentives in PPPs. There are few countries with PPP roads that introduce positive incentives based on explicit road safety indicators. These countries where this was done, it became a normal practice and the latest PPP contracts continue to introduce and improve these incentives. This happens in Spain, Finland, Hungary, Norway, Portugal and United Kingdom. Italy introduced price-caps tied to road safety indicators in such a way that the concessionaire is allow to set higher tolls if the safety ratios are better. In Ireland, PPP road contracts include some road safety indicators but they do not provide bonuses. In other countries, like Denmark, the Netherlands and Belgium, there are new and sophisticated PPP contracts, but they do not have positive incentives based on explicit road safety indicators.
The design of the road safety indicators is quite heterogeneous across different countries. There are differences both in the variable adopted to measure the outcome and in the final formula employed. Most of the PPPs include number of injuries, number of fatalities or a combination of number of light accidents, serious accidents and fatal accidents to build the indicator.
On the other hand, including the exposure to the risk (expressed by traffic) is a generalized practice. Very often, the initial accident data is divided by the annual traffic, usually measured in terms of millions or billions of vehicles-kilometers. E18 road (Muurla–Lohja) in Finland, the M6 road in Hungary, several PPPs in Portugal (the IP-4, for instance) and the latest PPP roads awarded in Spain use this methodology. The advantage of introducing the exposure to the risk (traffic) explicitly is that distortions in road safety results are reduced.
18
Regarding the way of rewarding or penalizing the contractor, it was identified two trends: incentives related to the extension of the deadline of the project, and incentives related to increase the fee to be paid to the PPP contractor.
CHARACTERISTICS OF MOTORWAYS IN SPAIN
Spain has extensive experience in managing and financing motorways through public-private-partnerships (PPPs). Most of the PPPs have been put into effect through concession contracts that have a long tradition in Spanish administrative law. Most of the motorway concessions awarded in Spain have been toll motorways. However, in the last few years, there was a large increase in the number of other PPP approaches, such as shadow-toll or performance-based contracts.
Three different periods regarding the implementation of motorway concessions in Spain can be identified: from 1967 to 1975, from 1976 to 1995, and from 1996 to the present. Between 1967 and 1975, 2,042 km of toll motorways were granted by the central government of Spain. The results of the implementation of concession contracts in Spain during this period were rather controversial. On the one hand, motorway concessions achieved the goal of providing the country with a modern motorway network at a time when the public budget of Spain was not sufficient to afford such a huge cost. On the other hand, the guarantees made by the government to facilitate concessions‘ funding over time became very costly for the country (Izquierdo and Vassallo 2004).
The second stage of motorway concessions is from 1976 to 1995. In this period, no motorway concessions were awarded. There were several reasons for this. First, the two petroleum crises in the 1970s destabilized the Spanish economy. Second, after Franco‘s death, the political atmosphere in Spain was uncertain. Third, and most important, the Socialist government, which took office in 1982 and remained until 1996, was politically opposed to promoting private concessions as a means to finance motorways. Instead, the socialist government opted for modernizing the Spanish road network by widening and upgrading the most important roads, turning them into dual-roadway fast lanes. These free motorways were called ―autovías”.
19
Since 2000, the quality standards in the construction of autovías improved notably to make comparable with toll motorways. These are called second generation autovías. There is no technical difference between second generation autovías and toll motorways. The first generation autovías and second generation autovías were built, funded and managed by the Spanish government. None of the public motorways (autovías) has economic incentives to improve road safety though the government is committed to building and maintaining the autovías with socially expected quality standards.
The third stage began in 1996 and continues into the present. In 1996, the conservative Popular Party took office in Spain. The need to contain Spain‘s public deficit was the most difficult challenge facing the new government. This was the main reason why the new government decided to implement once again the policy of offering concessions so as to encourage the participation of the private sector in financing new transportation infrastructure. From 1996 to now, 1,003 kilometers of new toll motorway concessions have been awarded by the central government of Spain through this approach. Another novelty of the period since 1996 is that not only the Spanish central government, but also the regional and even the local governments have started using the concession approach to implement both toll and shadow-toll motorways.
Most of the PPPs implemented in the last stage include a provision to extend the contract duration up to four years if several performance-based indicators tied to quality aspects like queuing in toll plazas, congestion, state of the pavement, safety, and satisfaction of the users are ultimately fulfilled. Other PPP‘s awarded recently in Spain also include incentives in terms of annual bonuses to be incorporated to the periodic fee paid by the government to the contactor.
20
MODELS THAT EXPLAIN ROAD SAFETY: A
LITERATURE REVIEW
This paper analyzes whether the incentives to improve road safety in PPPs are effective. The statistical models most commonly used to explain the relationship between motor vehicle accidents and a set of predictor variables are the Poisson and NB regression models (Miaou and Lum 1993; Noland and Oh 2004; Chang 2005; Caliendo et al 2007).
From an empirical stand-point, the relationship between accident frequency and traffic flows can be found in Jovanis and Chang (1986), Abdel-Aty and Essam Radwan (2000) and Persaud et al (2000); and the relationship between accident rate and traffic flow can be found in Vitaliano and Held (1991) and Hauer and Bamfo (1997). The relationship between accident frequency or accident rate and traffic flows show a great variation in theirs results.
Jovanis and Chang (1986), Abdel-Aty and Essam Radwan (2000) and Persaud et al (2000) point out that accident frequency increases with Average Annual Daily Traffic (AADT). On the other hand, Vitaliano and Held (1991) cannot detect any significant increase in the accident rate when AADT increases. According to Hauer and Bamfo (1997) the accident rate even decreases with an increasing AADT.
Few studies have analyzed the effect of heterogeneous flows, and specifically the effect that the presence of heavy good vehicles (HGVs) in the traffic flow has on accidents. Hiselius (2004) analyzed the relationship between accident frequency and traffic flow in four different road types according to speed limit and road width in two conditions: homogenous and heterogeneous traffic. The results show that the expected number of accidents increases less than proportionally with the traffic flow, in the homogenous case. For the heterogeneous case, the expected number of accidents decreases with increasing number of trucks. According to Arenas et al (2009), the expected number of accident increases with the addition of one vehicle in AADT, and increases with one additional HGV when comparing high capacity roads to single carriageway roads.
21
regression models were applied to know the relationship between safety incentives and road safety in Spain. This paper focuses on variables related to traffic flow, infrastructure characteristics (intersections), road operation and incentives given to the PPP contractors. The authors have not found any empirical study about safety incentives offered to the PPP contractors.
DATA FOR THE CASE OF SPAIN
The models that were calibrated in this paper cover the year 2006. We chose this year because it is the most recent year where a complete database is available.
The data used for the empirical model came from two different sources: police-reported accident data supplied by the Ministry of Internal Affairs (Ministerio del Interior, 2006) and traffic data supplied by the Ministry of Public Works (Ministerio de Fomento, 2006). Using these databases it was necessary to build the final database combining both accident data and traffic data. The population for the models were made up of road stretches of the Spanish high-capacity network both PPP motorways (toll motorways) and public motorways (autovías).
Some exogenous variables that may potentially influence safety and do not depend on the concessionaire‘s ability to manage the road were selected. These are: continuous variables such as (1) Average annual daily traffic (AADT), (2) Percentage of heavy goods vehicles (%HGV) and (3) Number of intersections for each stretch (INT) and two selected variables that may explain any relation between PPPs and accidents, (4) Road operation (RO) and (5) Incentives (INC). Furthermore, in order to fit the model it was considered the vehicle exposure (vk). It was measured in millions of vehicle-kilometers as vkj = 365 lj AADTj/106, where AADTj and lj are respectively
the average annual daily traffic and length (km) of road section j obtained from traffic database.
The number of intersections for each stretch (INT) introduced as discrete value with 2 levels (it takes 1 for stretches with at least 1 intersection and it takes 0 otherwise) was obtained from the Geographic Information System (GIS), the analyses was performed using ArcGis 9.2. Each stretch of the sample was analyzed using the GIS application to count the number of intersections.
22
de Fomento, 2006b), which can be for the case of the Spanish high capacity network: second generation autovías (AV), first generation autovías (1AV) or toll motorways (TM). TH are PPPs, AV and 1AV are public motorways.
To know which segments had road safety incentives (INC) it was analyzed each concession contract in force in 2006. The first Spanish concession contract awarded with implementation of road safety incentives was in 2002. All of the contracts from 2002 to 2006 were analyzed. INC is a discrete variable with 2 levels (it takes 1 for stretches with safety incentives and it takes 0 otherwise).
For this study, the dependent variables are the fatal, injury and accident rates. 1,042 road segments were extracted out of a total of 6,293 from the 2006 traffic map, after selection criteria based on complete information for traffic flow and infrastructure variables. It was considered stretches with and without accidents to avoid selection bias. The study includes PPPs (toll motorways) and public motorways (first and second generation autovías). For this study was considered only stretches of the Spanish Interurban Road State Network. The final data base represents 62% of the total Spanish high-capacity network. The total number of segments (with and without accidents) and the length by road operation are presented in Table 1.
Table 1. Road segment data
Road operation Segments Length
(Km)
Nº %
with accidents
without accidents
Total with accidents
without accidents
Total
AV 275 287 562 26.39 27.54 53.93 3,790.46
1AV 43 266 309 4.13 25.53 29.66 2,285.02
TM 60 111 171 5.76 10.65 16.41 1,372.24
Total 378 664 1,042 36.28 63.72 100 7,447.72
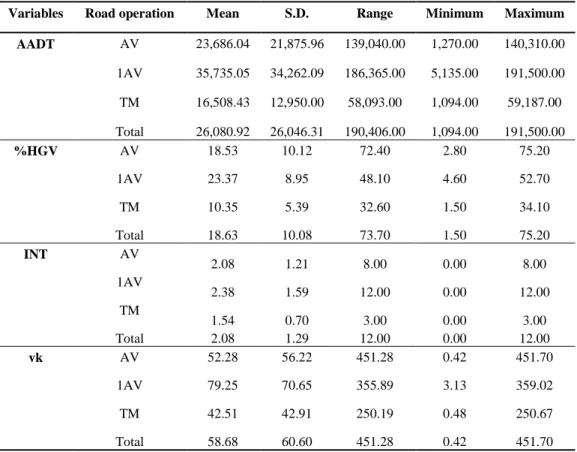
The descriptive statistics are represented in Table 2. The descriptive statistics indicate that the mean traffic intensity (AADT) is higher on 1AV than AV and TM. The low traffic intensity in TM could be explained because the users pay tolls.
23
Table 2. Descriptive statistics by road operation and total. Year 2006
Variables Road operation Mean S.D. Range Minimum Maximum
AADT AV 23,686.04 21,875.96 139,040.00 1,270.00 140,310.00
1AV 35,735.05 34,262.09 186,365.00 5,135.00 191,500.00
TM 16,508.43 12,950.00 58,093.00 1,094.00 59,187.00
Total 26,080.92 26,046.31 190,406.00 1,094.00 191,500.00
%HGV AV 18.53 10.12 72.40 2.80 75.20
1AV 23.37 8.95 48.10 4.60 52.70
TM 10.35 5.39 32.60 1.50 34.10
Total 18.63 10.08 73.70 1.50 75.20
INT AV
2.08 1.21 8.00 0.00 8.00 1AV
2.38 1.59 12.00 0.00 12.00 TM
1.54 0.70 3.00 0.00 3.00 Total 2.08 1.29 12.00 0.00 12.00
vk AV 52.28 56.22 451.28 0.42 451.70
1AV 79.25 70.65 355.89 3.13 359.02
TM 42.51 42.91 250.19 0.48 250.67
Total 58.68 60.60 451.28 0.42 451.70
METHODOLOGY AND RESULTS
Poisson and NB regressions were applied to determine the relationship between fatalities, injuries and accidents and traffic variables, number of intersections for each stretch, road operation and road safety incentives offered to the concessionaire. In this work the response variables are number of fatalities, injuries and accidents.
The Poisson overdispersion parameter indicates that the data may be overdispersed. When Pearson's chi-square divided by the degrees of freedom is greater than 1, the data may be overdispersed, otherwise the data may be underdispersed. All Poisson models presented Value/df greater than 1, therefore it was necessary to test the NB as an alternative model, which enables the variance of the dependent variable to differ from its mean.
24
then expressed as [ ] , using the log-link function to relate the response to the linear predictor.
The general expression for the estimated model is:
[ ̂ ( ] ̂ ∑ ̂
̂ )
With the restriction ̂
The accident rate is expressed as: ̂ [ ]
̂
Table 3 summarizes the estimated NB regressions. Each column refers to a model with the endogenous variables and every row to exogenous variables. There is an estimated parameters for each variable. The significance of coefficients was checked using Wald statistic (in bracket), which rejects the null hypothesis that the coefficient is zero with a level of 95% confidence. Different goodness-of-fit statistics were used to select the model such as deviance, log-likelihood and Pearson chi-square statistics. Other measures were also evaluated such as Akaike Information Criterion (AIC) (Akaike, 1974) and the Bayesian Information Criterion (BIC) (Schwarz, 1978).
A criterion for variables inclusion was used by testing the likelihood ratio (LR). In addition, the correlation coefficient between them was prevented.
After analyzing Table 3, it could highlight the following results:
1. Log(AADT) is statistically significant for the fatality, injury and accident rates. The coefficient signs are negative for all models (fatalities, injuries and accidents), suggesting that a greater AADT is associated with lower rates for fatalities, injuries and accidents. This result confirms the hypothesis proposed by Vitaliano and Held (1991) and Hauer and Bamfo (1997) that accident rates decrease when AADT increases.
25
3. INC variable showed the expected negative sign, suggesting that establishing incentives in the PPP contracts is associated with lower rates for fatalities, injuries and accidents. The coefficient signs do not change in all models. This variable was found to be statistically significant for injury and accident models.
4. The INT (intersection) variable showed the expected positive signs suggesting that the increased number of intersections is associated with the increased level of fatalities, injuries and accidents. There are more fatalities, injuries and accidents in stretches with at least one intersection than stretches without intersections. However, this variable was found to be statistically insignificant.
The main reason for the insignificance of INT in the models could be that the kind of roads used for the analysis does not have at grade intersections which are those that most affect road safety. The Spanish high capacity network only has grade-separated intersections. These types of intersections reduce the accident potential due to vertical separation of traffic. This result is in line with the findings of Ivan and O‘Mara (1997).
5. RO indicates that there is a differentiated behavior among toll motorways, second generation autovías and first generation autovías.
Toll motorways (TM) showed the expected negative sign in all models suggesting that there are fewer fatalities, injuries and accidents in toll motorways compared to AV, which is the reference class. In other words, toll motorways managed and operated by the private sector turn out to be safer that free motorways managed and operated by the public sector.
The only odd result that was found in the analysis is that the variable 1AV has an unexpected negative sign suggesting that 1AV has fewer fatalities, injuries and accidents compared to AV. This result is strange because, as mentioned earlier in this paper, first generation autovías (1AV) have poorer design standards than second generation autovías (AV). The main reason for that is that first generation autovías are among the busiest motorways in Spain in terms of traffic so the AADT in these motorways is often close to their capacity and consequently the speed of the flow is lower, which improves safety ratios.
26
Toll motorways segments with incentives – without intersection:
̂ ( ̅̅̅̅̅̅̅̅ ( ̅̅̅̅̅̅̅̅̅
Toll motorways segments with incentives – at least 1 intersection:
̂ ( ̅̅̅̅̅̅̅̅ ( ̅̅̅̅̅̅̅̅̅
Toll motorways segments without incentives – without intersection:
̂ ( ̅̅̅̅̅̅̅̅ ( ̅̅̅̅̅̅̅̅̅
Toll motorways segments without incentives – at least 1 intersection:
̂ ( ̅̅̅̅̅̅̅̅ ( ̅̅̅̅̅̅̅̅̅
Table 3. Negative binomial regression models for fatalitites, injuries and accidents
Variables Measureme
nt level FATALITIE S INJURIE S ACCIDENT S
Intercept 0.936 0.334 -0.677
(0.403) (0.269) (0.947)
Log(AADT) S
-0.700a -0.157a -0.106b (37.977) (10.016) (4.031)
Log(%HGV) S
-0.084 -0.470a -0.507a (0.236) (37.863) (37.781)
INC C stretch with
incentives -0.818 -0.676
c
-0.943b (0.552) (2.670) (3.946)
INT S 0.817 0.125 0.167
(2.360) (0.629) (0.880)
ROAD
OPERATION C
TM -0.461 -0.398a -0.351a (2.954) (11.809) (7.562)
1AV -0.511b -0.405a -0.423a (6.545) (23.900) (22.610)
Log(vk) S 1 1 1
Deviance (Dp) 579.862 2,562.148 1,933.346 Pearson Chi-Square (X2) 1,669.727 4,202.451 2,784.678 Log Likelihood -486.091 -2,462.047 -1,978.212
AIC 986.183 4,938.093 3,970.424
BIC 1,021.121 4,973.032 4,005.362
Overdispersion parameter (k) 1.546 3.891 2.578 Measure level: Scale (S), Categorical (C)
a p<0.01 b p<0.05 c p<0.10
27
stretches without intersection, the number of accidents per 1 million vehicle-kilometers is about 2.66 times higher in toll motorways without incentives compared to toll motorways with incentives. And, for stretches with at least 1 intersection, the number of accidents per 1 million vehicle-kilometers is about 2.55 times higher in toll motorways without incentives compared to toll motorways with incentives.
CONCLUSIONS AND FUTURE RESEARCH
The most important result from this research is that safety-based incentives in PPPs is an effective measure to manage motorways. In other words, there are more fatalities, injuries and accidents on motorways segments without incentives than on motorways segments with incentives.
The INC variable was found to be statistically significant in the injury and accident model. However, if incentives have an impact on road accidents, they have an impact on fatalities as well, because of the negative sign in fatal models. If incentives given to the concessionaires avoid accidents, they avoid fatalities which are a consequence of accidents. The results indicate that incentives have an influence on road safety.
This paper has paved the way for new topics that undoubtedly would require further research. First, the analysis of the size of the economic incentive set up in the PPP contract on the ultimate improvement of safety ratios is a crucial aspect. Second, it would be useful to analyze the evolution of safety performance over the years in PPP motorways with safety-based incentives. Third, a cross-cutting comparison of the different types of incentives (incentives related to the deadline of the project vs incentives related to payments) would be of the greatest interest.
REFERENCES
Arenas, B, Aparicio, F, González, C, Gómez, A (2009) The influence of heavy good vehicle traffic on accidents on different types of Spanish interurban roads. Accident Analysis and Prevention, 41, 15-24.
Abdel-Aty, M A, Essam Radwan, E A (2000) Modeling traffic accident occurrence and involvement. ―Accident Analysis and Prevention‖, 32, 633-642.
Akaike, H (1974) A new look at the statistical model identification. ―IEEE Transaction on Automatic Control‖, 19, 716–723.
28
Chang, L Y. (2005) Analysis of freeway accident frequencies: negative binomial regression versus artificial neural network. ―Safety Science‖, 43, 541-557.
Fridstrøm, L, Ifver, J, Ingebrigtsen, S, Kumala, R. Krogsgard Thomsen, L (1995) Measuring the contribution of randomness, exposure, weather, and daylight to the variation in road accident counts. ―Accident Analysis and Prevention‖, 27, 1–20.
Harding, J, Bodarwé, H, Čadež, I (2010) Evaluation of availability and service performance based payment mechanisms for PPP Road Traffic Infrastructure Projects. In: 89th Annual Meeting of the Transportation Research Board, Washington, D.C.
Hauer, E (2004) Safety models for urban four lane undivided road segments. ―Transportation Research Board‖, 985901, 96-105.
Hauer, E, Bamfo, J (1997) Two tools for find what function links the dependent variable to the explanatory variables. In: Proceedings of the ICTCT Conference, Lund.
Hiselius, L W (2004) Estimating the relationship between accident frequency and homogeneous and inhomogeneous traffic flows. ―Accident Analysis and Prevention‖, 36, 985–992.
Ivan, J, O‘Mara, P (1997) Prediction of traffic accident rates using Poisson regression. In: 76th Annual Meeting of the Transportation Research Board Nº 970861, Washington, D.C.
Izquierdo, R and Vassallo, J M (2004) ―Nuevos sistemas de gestión y financiación de infraestructuras de transporte‖. Colegio de Ingenieros de Caminos, Canales y Puertos. Madrid.
Jovanis, P, Chang, H (1986) Modeling the relationship of accident to mile travelled. ―Transportation Research Record‖, 1068, 42–51.
Miaou, S.P, Lum, H (1993) Modeling vehicle accidents and highway geometric design relationships. ―Accident Analysis and Prevention‖, 25, 689–709.
Milton, J, Mannering, F (1998) The relationship among highway geometrics, traffic-related elements and motor vehicle accident frequencies. ―Transportation‖, 25, 395–413.
Ministerio de Fomento (2006) Mapa de Tráfico 2006. Dirección General de Carreteras, Madrid, España.
Ministerio del Interior (2006) Base de datos de accidentes. Dirección General de Tráfico, España.
Noland, R B, Oh, L (2004) The effect of infrastructure and demographic change on traffic-related fatalities and crashes: a case study of Illinois county-level data. ―Accident Analysis and Prevention‖, 36, 525-532.
29
Persaud, B, Retting, R A, and Lyon, C (2000) Guidelines for identification of hazardous highway curves. ―Transportation Research Record‖, 1717, 14-18. Schwarz, G (1978) Estimating the dimension of a model. ―The Annals of Statistics‖,
6, 461-464.
Shankar, V, Mannering, F, Barfield, W (1995) Effect of roadway geometrics and environmental factors on rural freeway accidents frequencies. Accident Analysis and Prevention, 27, 371–389.
Vassallo, J M and Gallego, J (2005) Risk-sharing in the New Public Works Concession Law in Spain. ―Transportation Research Record‖, 1932, 1-8.