Developments in Internet Financial Reporting:
Review and Analysis Across Five Developed
Countries
Amir Allam. University of Birmingham. UK. [email protected]
Andrew Lymer. University of Birmingham. UK. [email protected]
Abstract. Internet based corporate reporting is wide spread amongst companies of all sizes in most countries around the world. The development of online reporting practice has been rapid, largely mirroring, and motivated by, the development of the world-wide-web since 1994, being the primary Internet medium for online reporting. A number of studies of these developments have occurred over this time seeking to plot how companies are exploiting the media of the Internet and how they are developing their reporting practices in response to this ubiquitous route to current and potential investors, and other stakeholders. In this paper, we develop this literature further by extending the benchmarks that have been created to monitor this activity since the mid 1990s. This study focuses on the very largest companies in five countries around the world. It examines online reporting practices of 250 companies at the end of 2001 and in early 2002 by creating a detailed attribute analysis of common factors across the companies examined. In addition to illustrating developments in online reporting practices since the previous extensive studies were conducted in 1999 and early 2000, the results provide new insight into recent changes in this domain. It particularly illustrates how newer, more interactive, aspects of Internet technologies are now being exploited to enable us to benchmark these activities to follow their use in the near future. The paper then addresses the relationship between the size of companies and its level of reporting practices, and the differences between reporting practices of large companies listed primarily in the different countries examined. These results illustrate that reporting practices differ significantly between companies in different domains.
1. INTRODUCTION AND LITERATURE REVIEW
Many studies have investigated corporate reporting on the Internet. The earliest studies were produced during 1996 and 1997, only a year after the global, corporate interest in the Internet as an advertising media had commenced. Most of the earlier studies focused on the existence of Websites for top, stock exchanges listed, companies and whether these companies posted some type of financial information. Among these studies are Petravick and Gillett (1998, 1996); Louwers, Pasewark and Typpo (1996); Lymer (1997); Flynn and Gowthorpe (1997); Gray and Debreceny (1997). Following this came a number of secondary studies developing this early exploratory research either by examination of other geographic domains or by extending the range of attributes examined to develop the benchmarks that had been established by the earlier studies. These include Lymer and Tallberg (1997); Deller, Stubenrath and Weber (1998); Marston and Leow (1998); Gowthorpe (1999); Heldin (1999); Pirchegger and Wagenhofer (1999), Oyelere
et al. (2000), Ashbaugh et al. (1999), Ettredge et al. (2001a).
Recent studies conducted by professional bodies, such as the International Accounting Standards Committee (IASC, 1999), Canadian Institute of Chartered Accountants (CICA, 1999) and the Financial Accounting Standards Board (FASB, 2000), continued this trend covering other aspects such as the formats used for posting annual reports over the Internet, and the availability of real time stock quotes and press releases.
Most recently specific features of online corporate reporting, and its impact on reporting entities and users, have become a focus of published reports. This includes Ettredge et al. (2001b), Hodge (2001), Williams and Pei (1999) and Beattie and Pratt (2001) to name just a few.
This study is intended to be, in part, an update for the two previous major studies conducted by the ISAC and the FASB, albeit on different scales. However, it is also intended to develop the specific feature studies of more recent research by examining current developments in online reporting not yet part of these other studies. This is important in allowing further development of the benchmarks in this area to enable us to improve our understanding of how this area of reporting activity is moving forward.
chosen for this study are the USA, the UK, Canada, Australia, and Hong Kong. The Websites for each of the 250 companies were identified then investigated for general and financial/annual report related attributes. The general attributes focus on the ease of navigating the Website and finding desired information, the integrity of online financial information, and the degree of online communication between companies and users of information. The financial/annual report related attributes focus on the availability of financial reports and their contents within corporate Websites.
The first part of this study is designed to serve as the next stage in the ongoing development of a benchmark and to draw a complete picture of the situation of online corporate reporting during the last quarter of the year 2001 and during the first quarter of 2002. Data collection started during September 2001 and continued until early November 2001. As websites differed in design and layout, collecting data was not a routine process. Six months later, a number of companies’ Websites were re-visited as a validity check of the whole data set given the lengthy period of data collection (e.g. when compared with the mass collection for the FASB study which occurred over one weekend) and no major changes were noted in the sites examined suggesting material changes over this period did not occur.
Previous studies have examined a number of possible explanatory factors for levels of Internet Financial Reporting (IFR). These include firm size, return on assets, AIMR1 ratings of reporting practices, percentage of equity held by individual
investors and others (see for example, Ashbaugh et al., 1999, Marston and Leouw, 1998, Marston and Wu, 2000). However, each of these studies has looked at these factors in a single country domain. The data collected during the first phase of the study was used to build an index to measure the IFR level of the companies covered in the survey. Based on the index a simple regression analysis was conducted to explore the relationship between the size of companies (by market capitalization) and the level of IFR. Finally, we tested whether IFR practices differ among countries. This is the first time factor analysis of this kind has been developed for cross border IFR. This index is intended to help in comparing the IFR level among countries and industries. In addition, this measure will make it possible to compare future surveys to the results of this survey in a quantitative manner; thus, leading to better understanding of the trends in the online reporting area.
Although this study is considered, in part, to be an update to previous studies, it covers new issues that did not exist, or were not material enough to examine at the time the previous studies were conducted. These include the use of Webcasts and e-mail alert services.
The remainder of this paper consists of four sections. The following section describes our methodology in defining and selecting our sample of companies and the specific attributes to be investigated. We then describe the results of the survey with comparisons to previous studies undertaken whenever appropriate as well as comparisons among the five countries. The fourth section presents the process of building an index to measure the IFR level of companies. In this section, we also discuss how this index was used to study the relationship between size of companies and their IFR level and investigate IFR level across the five countries covered in this survey. The final section presents our conclusion, remarks and suggestions.
2. METHODOLOGY
2.1. The sampling procedure
The sample chosen for this study covered five countries on four continents. It was taken into consideration that the companies would be in English-speaking countries with relatively high use of Internet, well-established, developed, active, and well-regulated stock markets. Unlike the IASC survey that was designed to provide geographic balance and a range of advanced and developing capital markets, this study was built to provide geographic balance but only focused on advanced capital markets. In addition, in choosing the countries to be included in the survey we considered the “vital countries” concept introduced by Mason (1978)2. Using this concept, Nobes and Parker (2000) presented a list of seventeen
countries. Out of these countries and based on the criteria indicated above, the USA, the UK, Canada, Australia, and Hong Kong were chosen.
2 According to Mason, harmonization of financial reporting systems can be reached by the support of
The next step was to decide on the criteria upon which the companies would be picked from each country. It was decided that market capitalization would be the best criterion for the purposes of our survey for a number of reasons. First, it was used in other studies including both the FASB and ISAC studies; thus, the results would be directly comparable. Second, market capitalization is an objective criterion, as it is based on real share prices. Third, using appropriate techniques, market capitalization for the sampled companies within the five different companies can be determined with precision at reasonable effort. The fourth reason is related to our decision to pick the biggest companies in each of the five countries. Big companies have the resources to run a dynamic Website and often they are the leaders in technology matters. Besides, it was found in previous studies that larger companies are more likely to disclose their financial information on the Internet (Marston et al., 1998). Ashbaugh et al. (1999) found that larger more profitable companies are more likely to engage in IFR. As we wanted our survey to be of the leading edge of development in the field, it therefore seemed appropriate to focus on large companies’ developments in our chosen domains.
It was decided that the sample should include 50 companies from each of the five countries for a total of 250 companies. This number was considered adequate to give a clear picture of the current situation of leading edge Internet reporting in the countries examined. The IASC covered 30 companies in each of the 22 countries of study. The FASB study examined 100 US companies only. Therefore, having 50 companies across 5 countries was considered to be reasonable compromise to ensure consistency with the previous studies, whilst also maintaining sample adequacy.
2.2. The attributes
The first group of attributes indicates the following:
- Ease of surfing the Website, proxied by the existence of a Site Map or Search Box.
- Availability of general news about the company, proxied by the existence of News Summaries, and Links to News Summaries.
- Availability of file downloads of data; Download
- Formats used for publishing information (html, pdf, etc.)
- Importance of accounting information, proxied by the existence of a Direct Link to Annual Report on the companies’ Homepage.
- Integrity of financial information (the use of different techniques to let users know if they are inside the annual report, which represent information reviewed by auditors). Evidence exists that hyperlinking audited financial statements to unaudited information affects the investors’ judgment (Hodge, 2001) making this an important attribute to examine. The following is a list of the most used techniques to let surfers know they are inside the annual report:
· The annual report section opens in a new window (Microsoft at www.microsoft.com, WalMart, Coca Cola, Cisco).
· Appearance of a message to notify the surfer upon leaving the annual report area (Microsoft, Intel at www.intel.com)
· Use of unique design and different colours from the rest of the Website sections (Royal Bank of Scotland at www.royalbankscot.co.uk)
· Appearance of the title “Annual Report” on every page of the annual report section (Pfizer at www.pfizer.com)
· The existence of a navigation sub-window containing only links to annual report sections that a surfer can use to browse throughout the annual report (Microsoft at www.microsoft.com/msft, Intel)
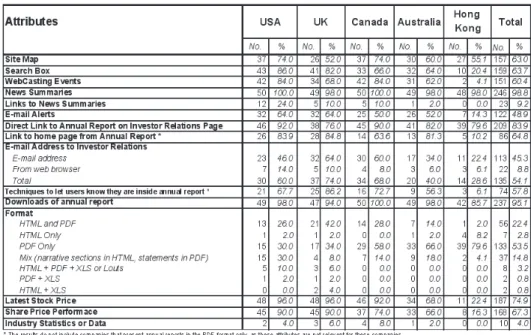
A list of these attributes is shown in Table 1 and will be discussed in detail in the following sections.
3. THE RESULTS
Of the 250 companies that were included in the survey, 249 (or 99.6%) have Websites of some description and in only one case (the 48th company in Hong Kong, Denway Motors Ltd.) no Website was located. Tables 2 and 3 show the detailed results of the attribute examination for our sample. Table 2 shows the general attributes for the five countries and the total for the whole sample, while Table 3 shows the results for the financial and annual report related attributes.
According to a survey conducted by the Association for Investment Management and Research (AIMR), 84% of companies had a Website in 1996 (FASB, 2000). Two years later, the National Investor Relations Institute (NIRI) reported that 86% of its corporate members had Websites of which 86% had investor relations (IR) sections (NIRI, 1998). The IASC survey (2000) examined 660 corporations in 22 countries in Europe, Asia-Pacific, and North and South America. The results showed that 86% of the organizations had an Internet presence at the time and that almost two-thirds of them publish some form of financial reporting over the Internet. The FASB study (2000) surveyed the Fortune 100 companies and found that 99 had Websites of which 93 had some form of investor relations’ sections.
In this study, it was found 100% of the companies with Websites have an investor relations section of some description under the title Investor Relations or under another equivalent name such as Financials, Financial Information, or Shareholder Information. This clearly indicates the importance perceived by larger companies for the need to make investor relations information available via the Internet – particularly via the web.
Table 2. General Attributes
3.1. General attributes
3.1.1. Webcasting events
Webcasting events over the Internet is a relatively new technology that allows many investors and analysts to get access to live events, such as conference calls regardless of their location as long as they have an Internet connection. Replays of these events are also made available as part of an archive of data for those unable to see the live broadcasts. The use of Webcasts in the USA has been boosted by the introduction of Regulation Fair Disclosure (FD) in October 2000 (Lymer and Allam, 2002).
Under Regulation FD, “when an issuer, or person acting on its behalf, discloses material nonpublic information to certain enumerated persons (in general, securities market professionals and holders of the issuer’s securities who may well trade on the basis of the information), it must make public disclosure of that information”(SEC, 2000:1). Through the Internet, it is possible to reach the public, at a reasonable cost for both the issuer and the user. Webcasts have therefore provided a popular technique to fulfil the requirements of this new regulation.
Webcasts are usually available either as audio, audio/video, audio accompanied by PowerPoint slides, or audio/video with slides. Typical events that are usually Webcasted are (Parker and Adler, 2001):
- Quarterly earnings conference calls - Product announcements
- Annual meetings
- Analyst and road-show meetings - Investor conference presentations - Merger and acquisition announcements - Press conferences
- Crisis communication - Training and demonstrations - Internal corporate updates
respectively. On the other hand, only 2 companies, about 4%, in Hong Kong provided Webcasts3.
The results of the survey reported in this paper, conducted approximately a year after the enactment of Regulation FD, illustrate that the effect of the regulation on Webcasting in the USA has been significant. However, the regulation is not the only incentive for the growth of Webcasting IR events as UK, Canadian, and Australian companies are also providing Webcasts without having similar regulations that explicitly targets the process of voluntary disclosures. Companies have other reasons to webcast their events online. Webcasts support a different way of reaching institutional as well as individual investors who may not otherwise be able to attend the event in person. In addition, Webcasts can be cost effective compared to other alternatives, such as conference calls that can cost between 26 to 36 cents/minute per investor (Parker et al., 2001). According to Parker et al, Cisco Systems, for example, had approximately 20,000 investors in one of its recent Webcasts. Achieving an audience this big as a conference call would cost Cisco around $500,000 and therefore be unlikely to have occurred.
3.1.2. News summaries and links
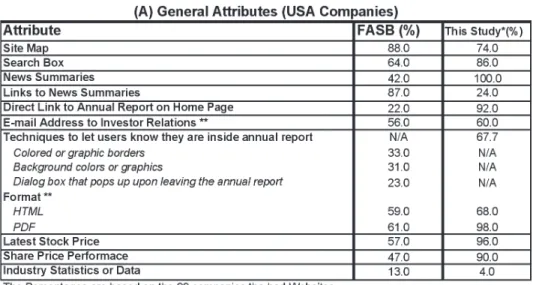
Almost 99% of the companies surveyed had news summaries sections on their Websites typically including press releases and general news about the company. However, only 9% or 23 companies provided links to news summaries provided by independent agencies. Compared to the results of the FASB study (see Table 5 A), more companies in the US now provide news summaries (42% the FASB, 100% this study), whereas fewer companies provided links to third party news summaries (87% the FASB, 24% this study). Together this implies that more companies are providing news directly through their own corporate Websites compared to the situation two years before. This change can probably be explained by the development of wider online investor relations’ services through the Internet during this period. More companies now depend on external specialists in creating, hosting, and maintaining investor relations Websites, such as CCBN in the US and Investis in Europe4; a new industry that barely existed
two years ago. Other possible reasons to explain these changes are the desire of
3 No data was available in either of the FASB or the IASC surveys regarding the use of Webcasts. Both
were conducted in 1999 when the use of Webcasts was not popular.
companies to guarantee that the information is accurate, complete, and timely. Third party created news quality may vary and importantly lacks the direct control of the corporation. Liability issues may also arise when a company provides links to third parties’ Websites. Hyperlinks are considered to be a source for more risk by incorporating the information at another site linked into the company’s own disclosures (Ettredge, Richardson, and Scholz, 2001a). The SEC has attempted to address this issue by defining three factors for determining whether a hyperlink may confuse users; context, potential for investor confusion, and the presentation of the hyperlink (SEC, 2000). However, according to Ettredge et al. (2001), these criteria are still not clear enough for practical usage and therefore this issue remains unresolved.
3.1.3. E-mail alerting services
An e-mail alert is a “push” technology5 that provides recipients with
information such as notification of IR events related to the release of financial information, press releases or plans for Webcasts. Most of the companies’ Websites that provide e-mail alerts allow users to subscribe and unsubscribe directly and define about which aspects they wish to be notified. Intel’s Website, for example, currently allows users to choose all or some of five options: Calendar Item, Earnings Release, Conference Presentation, Financial Reports, and SEC Filings. A key advantage of such services is to keep investors, and other interested parties, updated of changing events without the need for them directly visit the corporation’s Website – an active IR strategy partly aimed at developing community between the company and the recipients of the alerts.
On average, 49% of the surveyed companies provided e-mail alerts of some kind. US and UK companies lead with 64% providing this kind of service; Canadian and Australian companies follow with 50% and 52% respectively. Only 7 companies (14%) in Hong Kong provided this service6.
3.1.4. Investor relations’ contacts (e-mail address)
It was found that only 54% of the companies surveyed provided e-mail contacts on their web pages. Companies provide e-mail contacts usually using one of two
5 Sent to, rather than accessed by, users
6 The IASC and the FASB studies did not report the usage of e-mail alerts; thus, we were not able to track
methods. About 45% (113 companies) provide an e-mail address and 9% instead allow investors to send messages from a web page within the company’s or investor relations’ Website. The first approach may be preferable as investors can save the address in their mailing list and send requests at any time without the need to go to the company’s Website.
The IASC survey did not provide any data regarding the use of e-mail services, the FASB survey reported that 56% of the sampled companies in the US provided e-mail addresses to investor relations. In the current study, 60% of the 50 companies surveyed in the US provided e-mail addresses; a slight increase compared to the results of the FASB’s survey.
Perhaps interesting to note is the fact that no restrictions regarding the type of queries that should be directed to Investor Relations were defined anywhere in any Website examined. Obviously, companies left the option to the user’s own judgment to decide which issues would be appropriate to be directed to the IR staff. However, as the company is under no compulsion to reply to inappropriate questions, this may not have been considered necessary.
3.1.5. Integrity/reliability of information
The information provided within annual reports is usually accepted as being more reliable when independent parties have audited it. Thus, hard copies of annual reports, as an audited package of financial information, are expected to be a reliable source of information for users to depend upon when making investment and other decisions. However, this may not be the case for online annual reports as companies may provide hyperlinks to unaudited information within the online audited financial information. This provides a potential loophole that can be used to mislead users. What makes this situation more dangerous is the potential that such links can be inserted and subsequently delete at a later date; thus jeopardizing the reliability of annual reports.
the two groups. Thus he concluded, “firms can influence financial report users’ perceptions by hyperlinking unaudited information to information in their audited financial statements, and that a simple disclosure rule reduces this influence.” Thus, companies should use proper techniques to differentiate between audited and non-audited information.
In our study, it was found that about 58% of the companies used “Inside Annual Report” (IAR) techniques to let users know they are inside the (audited) annual report section. Examples of techniques used for this purpose are given in Figure (1). UK companies lead this trend with 86.2% using some IAR techniques, followed by Canada (72.7%), USA (67.7%), Australia (56.3%), and HK (6.1%)7.
It can be argued that the companies that do not apply IAR techniques are working in a Web environment vulnerable to the risk of mixing audited and non-audited information in users’ evaluation of presented data. The above results show that about one third of the top 50 US companies, one fourth of their counterparts in Canada, 43% of those surveyed in Australia and 94% of the biggest 50 companies in Hong Kong do not apply any IAR techniques to distinguish audited information. Obviously, these numbers should direct our attention to the vulnerability of the current situation of online reporting. Consistent with Hodge’s conclusion, a disclosure rule may be required to force companies to put clear limits between audited and non-audited financial information.
Hodge (2001) also found that misclassification of audited or un-audited information may mislead investors. He suggested the establishment of a service whose objective is to provide “assurance to financial-report users that a firm’s web-based financial disclosures meet certain criteria, such as explicitly labelling, or prohibiting, direct links between audited and unaudited information”. Hodge suggested that this service would be similar to WebTrust8, established by the AICPA
and the Canadian Institute of Chartered Accountants. The objective of WebTrust is to provide assurance for electronic commerce. Consistent with Hodge’s recommendation, one of the criteria to be set by such a service is to deal with the IAR techniques.
7 It should be noted that companies that provided their annual reports in the PDF format (only without the
HTML format) were excluded from the calculations of the above percentages. Hyperlinks from within PDF files to other web pages on the Internet were not widely available or used at the time of data collection. In addition, annual reports in the PDF format are the same in design and content as the hardcopies. So, the techniques to let users know whether they are inside the annual report section are not relevant for this format. Formats are explained later.
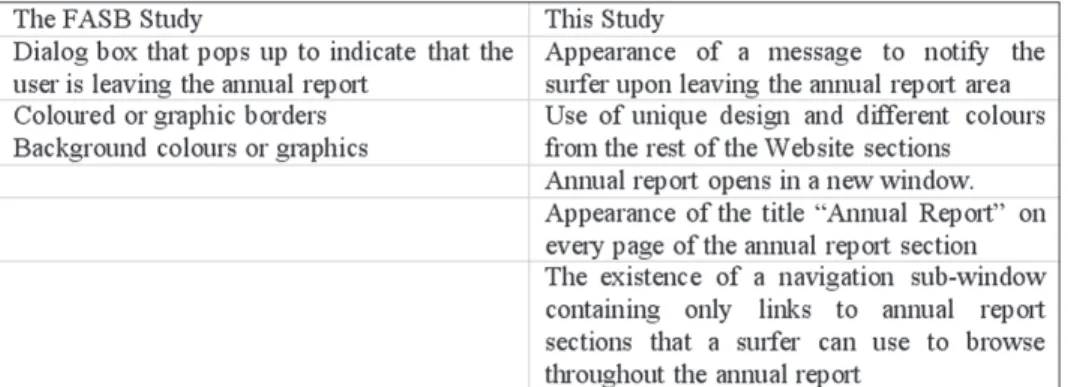
Figure 1. Inside Annual Report Techniques
The FASB’s study defined three criteria to decide whether a company is using techniques to let users know they are inside the annual report. However, direct comparisons between the results of this study and the results of the FASB’s for the US companies are not appropriate as each study used different measures for the IAR techniques – partly illustrating developments in this area between the two studies. Figure 1 shows the techniques that were considered under each of the two studies. The results of the two studies are presented in Table 5, in the Appendices. This study followed an overall approach for the use of the techniques. In other words, if a company used at least one of the techniques listed in figure 1, it would be considered as using IAR techniques. On the other hand, the FASB’s study reported its results individually for each technique (see Table 5A for details). The same company might be using more than one of the techniques listed in figure 1, for the FASB study. Thus, the percentages shown in Table 5A cannot be summed as it will lead to duplications.
3.1.6. Formats and styles used for presenting annual reports
The most popular format used in building Websites is HTML (Hyper Text Markup Language) or close derivatives of HTML (e.g. Cold Fusion9). However,
for the purposes of reporting financial information and presenting annual reports, the most popular formats are HTML and PDF (Portable Document File). Each format has its own advantages and disadvantages10.
9 see http://www.macromedia.com/software/coldfusion/
10 For more information refer to FASB. 2000. Electronic Distribution of Business Reporting Information:
In Table 2 appear the results of the different styles and formats used in presenting annual reports on the Internet. In this respect, style stands for the use of one format “only” or a combination of two or more formats (HTML, PDF, XLS, and/or Lotus123).
The “PDF only” style is the most used in presenting annual reports. Approximately 53% of the sample used this style. However, it should be noted that the use of this style is not consistent among the five countries. The use of the PDF only style in the sampled companies in the USA and the UK is 30% and 34% consecutively, much less than the use in the other three countries. Of the surveyed companies in Hong Kong for example, 78%, used the PDF format as the only way they make financial information available.
The use of the HTML format only to present annual reports without support of any other formats was found not to be popular. Only 2.8% of the companies surveyed used this method only. However, this should not give the impression that the HTML format is not popular as companies often used the HTML format in addition to the PDF format to offer users a choice of viewing methods. Of the 250 companies, it was found that 56 companies (22.4%) used both the HTML and the PDF formats to present their annual reports over the Internet. A small number of companies (5 in the USA and 3 in the UK) also used both formats simultaneously in addition to presenting some financial statements in the form of Excel or Lotus spreadsheets.
It was also found that 15% of the companies presented their annual reports in a mix of HTML and PDF formats. The narrative section of the annual report would typically be in HTML, while the numeric section would be in PDF format. More companies in the USA used this style compared to the other four countries. Thirty percent of American companies applied this style, followed by Australia 18%, Canada 14%, whilst only four (8%) UK companies and two (4%) HK companies adopted this approach.
The other styles presented in Table 2 were not found to be popular. Of the whole sample, only two companies presented their annual reports in a combination of PDF and Excel spreadsheets (with no substantial HTML based information) and another two presented the information in a combination of HTML and Excel spreadsheets, less than 1% of the sample in each case.
used the HTML format (solely or joined with another format), while 98% of the companies used the PDF format (solely or joined with another format).
The rational behind the use of different styles to present annual reports in the five countries is not clear through this study. More investigation is required to find the reason behind such diversity, which could be due to cultural differences, management philosophy, local rather than international trend following, or Internet accessibility.
3.2. Financial/annual report related attributes
This set of attributes reports the availability of financial information contained within reports made available on the Internet. The results of this part of the study are shown in Table 3. Comparable results of the IASC survey are shown in Table 4, and of the FASB survey are shown in Table 5.
It should be noted that disclosure rules vary between countries. For example, quarterly statements are required in the USA and Canada for all listed companies but this is not a requirement in the other three countries examined in this study. Others examples of disclosure differences include use of proxy statements, provision of segmental reports, and the presentation of a statement of directors. In addition, the titles of the sections were not always the same. For example, the title “Management Discussion and Analysis” (MD&A) is used in the USA and Canada, whereas, in the UK a largely similar document is called the “Operations and Financial Review”.
These facts should be taken into consideration when attempting to interpret the overall results (total column) shown in Table 3. Few companies provide non-obligatory information. For example, only 5 companies in the UK provided quarterly statements and these companies are all listed in the USA.
3.2.1. Financial ratios
As shown in Table 3, it was found that on average 57.8% of the companies covered in this study provided financial ratios in tables presented as a formal part of the annual report. Although the other 42% did not provide this information so formally, most companies used financial ratios within the narrative parts of their annual reports. Where companies formally posted ratios, it was typically for two or more years allowing comparisons and showing the performance trends of the company.
More US companies (68%) provided tables for financial ratios than the other 4 countries. Canada and Australia followed, 62% and 60% respectively whereas 56% of the UK companies and 42% of the Hong Kong companies provided tables of ratios.
3.2.2. Auditor’s report
The auditor’s report is an important source of credibility and reliability for annual reports. A formal auditor’s report must be signed and dated by the auditor for all companies in each domain we examined. Although it is expected that companies would meet these requirements in hard copies of annual accounts, nine (3.6%) of the companies surveyed did not make the auditor’s report available online and 44.6% provided un-signed reports11. This situation does vary
dramatically among the countries examined as the data illustrated.
Only 51.8% of the online auditors’ reports for the companies surveyed satisfied the normal reporting standards of auditing that require the report to be signed by the auditor to be a valid document. We also noted that no company provided any form of a digitally signed report12.
11 In all cases, the name of the auditor was typed at the bottom of the report but it was not signed in any way
usual, or electronic sense for that term. There is no requirement for reports online to be signed in anyway in any jurisdiction studied – although various advisory guidance now available indicates this would be desirable (see Lymer and Debreceny, 2003, for a wider discussion of this issue).
12 Among the advantages associated with digital signatures are authentication, data integrity (i.e. the
From the comparison with IASC and FASB studies, it can be concluded that more companies are now providing auditors’ reports (in the five countries) than was previously the case. Moreover, more companies in the USA are providing signed reports than has yet become the norm elsewhere.
3.2.3. Corporate citizenship
Most of the companies surveyed provided information about either or both of their social and/or environmental activities. Many companies dedicated a special section within their Website (primarily online HTML format); other companies provided this information within their annual reports. Only 20.5% of the whole sample did not provide such information. Almost half of our sample reported on both their social and environmental activities.
As is consistently the case in many categories reviewed, the situation within the five countries varied. Most of our sampled UK companies (86%) reported online on both activities. In the USA, Canada, and Australia, companies tended to report on both social and environmental activities (percentages ranged between 44-48%), or report only on the social activities. More than half of the companies in Hong Kong, 57%, did not report such information; however, those that did followed the pattern found in the USA, Canada, and Australia. The reason for the high percentage of companies in Hong Kong not reporting on their social and environmental activities might be the lack of incentives under the socio-political economic conditions in this country (Williams, 1998). Managers are not motivated to publish such information due to fears of increased costs and liabilities (Jaggi and Zhao, 1996). In addition, Williams et al. (1999) found that HK companies tend to report less corporate social information on their websites compared to annual reports. They proposed that this might be due to managers’ perception that target markets for this type of information are small thus, generating a feeling amongst reporting companies that the use of websites may not be a useful method of delivering information compared to the utility gained from distributing annual reports this way.
3.2.4. Other information
Chairman Message (Letter to Shareholders): Most of the companies provided a letter from the chairman addressed to the shareholders. Only 14 companies did not provide such a letter, the majority of which are registered in Hong Kong. Many of the companies that did not provide this section also did not provide their full annual report online or provided the information through a third-party’s Website.
The IASC study reported that 52% of the companies provided a chair’s report for the five countries covered in our survey. We found that 94% of the companies provided this. The FASB survey reported that 80% of the biggest 100 US companies made the chairman’s message available online, whereas we found that 98% of the biggest 50 US companies provide such a message. This comparison indicates the increase in reporting this often important piece of information, which has been reported in other studies as one of the most used by investors in making their investment decisions (Bartlett and Chandler, 1997).
Management Discussion and Analysis13: As shown in Table 3, most (95%)
companies provided an MD&A within their annual reports. The equivalent result reported by the IASC study for the same five countries was 36%. For the US companies, the FASB study reported that 61% of the companies provided this section, while we found that 90% provided it. These comparisons give another indication of the developments in depth and quality of online reporting during the last three years.
Statement of Directors: In this section, company directors declare responsibility for the results presented in the financial statements. Most of the companies provided a statement by their directors, with the notable exception of Hong Kong’s companies. No company in Hong Kong reported this section, although it is not required by regulation that is likely to be the key reason for this omission. As a result, the 74% average presented in Table 3 is not indicative of the true average for this survey. Re-calculating the average for the 200 companies (excluding Hong Kong) would result in 92.5%. Ninety six percent of Canadian and Australian companies reported such section, whereas 94% of UK companies and only 84% of US companies reported it. Given recent changes in the USA (e.g. Sarbanes/Oxley Act, 2002) being discussed and mirrored elsewhere in the world, it is likely this number will continue to rise in the future.
Corporate Information: This section includes general information about the company such as the address of its headquarters, contact address for shareholder services, and stock exchanges in which the company is listed14. We found that
96% of the companies provided this general corporate information online. The IASC study reported that 63% of the companies covered in its survey provided such information. Obviously, more companies are realizing the importance of providing such information to their investors and other stakeholders.
Proxy Statement: The Securities and Exchange Commission (SEC) in the USA requires this statement and each company is obliged to send to its shareholders to provide material facts concerning matters on which the shareholders will vote. Usually, this statement is sent to shareholders using regular mail. Though this statement is a statutory requirement in the USA and Canada, some companies within the other three countries also provided it (see the details in Table 3).
We found that 70% of the US companies covered in our survey make this statement available online, an increase of 29% (in absolute terms) from what the FASB study in 2000. More companies are taking advantage of the power of the Internet to satisfy statutory requirements at a cost-effective manner.
Customer and Employee Profile: The information provided about customers and employees was the category of information provided by the fewest companies either in their annual report or within any other section of their Websites. Only seven companies provided information about their customers and 24 companies reported information about their employees’ profile.
A company was considered as providing a customer profile if it had made available, within its annual report or another section of its Website, information about either its type of customers, or details of its major customers (such as their locations). Such information could be considered important for investors in determining the liquidity of the company or its risk profile, for example. Out of the seven companies that provided such information, four companies are located in the US and three in the UK.
A company was considered to be providing a employee profile if it made available information about either the number of employees (e.g. headcount) by
location (worldwide), age and gender, and/or functional break down (for example, Microsoft employees are broken down into three main functions: Research and Development, Sales & Support and Operations). Twenty of the 24 companies that provided online employee profile existed in the UK.
3.2.5. Stock prices and share price performance
As shown in Table 3, more companies in the US, UK, and Canada are providing the latest stock prices (most commonly on a delayed 20 minutes basis) and share price performance, compared to those in Australia and HK. However, it should be noted that Australian companies are providing much more information regarding stock prices than HK companies.
The FASB survey results show that 57% of their US based sample provided their latest stock prices and 47% provided information regarding their share price performance (see Table 5A). This study, found that 96% of the biggest 50 companies in the USA provided the latest stock price and 90% provided their share price performance information. This is a clear indication of the advancements in investor relations’ services provided through the Internet in the last two years as the ability to make this data available has been possible for some time and therefore a greater serviced-based view within the companies examined must be the more significant motivating factor.
4. MEASURING THE IFR LEVEL
The key reason for measuring the IFR level in a semi-formal way is that it can be used as a benchmark for companies in determining their relative positions of corporate reporting and, hence, comparing their positions over time and tracking their progress in the IFR field. In addition, the benchmark or index can be used in providing some comparison of companies across countries and industries. It will help to answer a number of questions such as: does the size of the company affect the quantity of information provided over the Internet?, is there a significant difference between companies in different countries? and is there a significant difference between companies in different industries? In order to measure the level of online financial reporting provided by companies, it was necessary to quantify the results of our survey of the 250 companies.
The following section describes the process of building our index to measure the IFR level of each company. However, it should be noted that the logic behind assigning points to the attributes does not depend on the importance of the attribute nor on the quality of the information provided by the company. Rather, it provides a measure of the quantity of information made available on the Internet and the facilities available to help users in browsing this information.
4.1. Building the index
In building the index, one point was given to the company for attributes of those shown on Table 1, if it was present on the Website. In addition, companies were given one point for each format used in presenting the annual report. For example, if a company had its annual report in HTML and PDF formats and its statements in a downloadable spreadsheet format it would be given 3 points15.
Regarding Corporate Citizenship, companies were given one point for either social or environmental reporting and two points for reporting both. For the Auditor’s Report, companies were given one point for making the report available and two points if the report was signed.
15 A company can score a maximum of 3 points for this attribute. The popular styles (combination of
In order to provide a valid comparison between the different countries and due to the different requirements for financial reporting, the following attributes were dropped from the index; Segment Report, Statement of Directors, Proxy Statement, and Quarterly Statement. In addition, another two attributes were excluded due to their irrelevance to some companies. The “Link to Homepage” and “Inside Annual Report” attributes were irrelevant for those companies that used only the PDF format in presenting their annual report. Hyperlinks from PDF files to Web pages outside the documents were not popular at the time of the survey and were not used in any of the companies we surveyed.
Using the above rules, a company can score a maximum of 36 points on this index and a minimum of zero. The total number of points can be broken down into two sets (as mentioned in section 3 of this paper). The general attributes focus on how the information is delivered and financial attributes focus on what is delivered. A company can score a maximum of 14 points on the first and 22 points on the second. Table 6 presents a summary of the survey results.
Compared to other countries, US companies have higher levels of IFR for both groups of attributes. UK and Canadian companies were, however, close to US companies on both categories. Australian companies ranked fourth, based on averages, whereas Hong Kong companies lagged behind the other countries on both categories. These results suggest that IFR levels differ across the five counties but could be similar across the US, the UK and Canada. This will be investigated in section 4.3.
Based on this index, as a scale for financial reporting on the Internet, some statistical analysis can be conducted to attempt to understand and describe the relationship between various attributes and features of reporting companies and their IFR level. Here we explore the size of the company (by market capitalization), and its level of IFR (represented by the number of points each company scored on the index). This measure has been reported in other studies as being more commonly explanatory of levels of IFR than others so far tested (e.g. see Ashbaugh
4.2. Size and IFR level
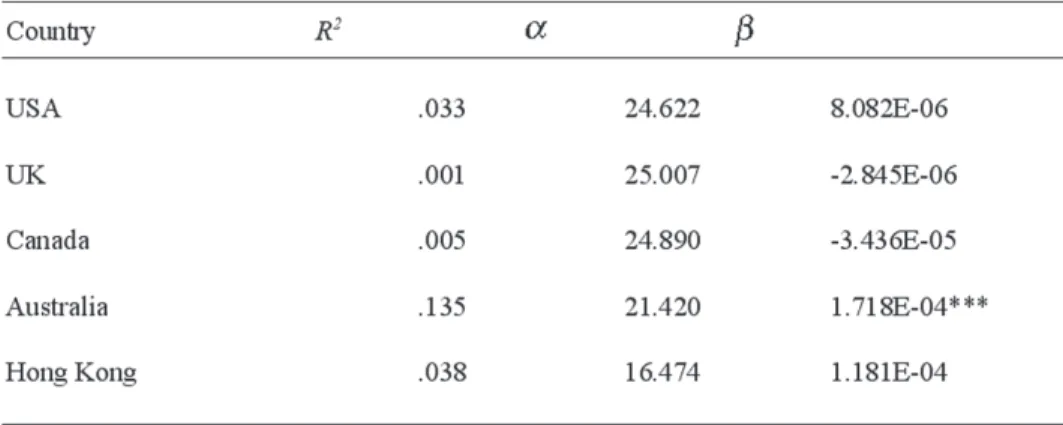
Is there a relationship between the size of the company and its level of Internet reporting? Although this study focused on big companies and picked the biggest 50 companies (by market capitalization) in five countries, there are big gaps among companies in absolute terms of market capitalization. To illustrate, on the 3rd of September 2001, General Electric (ranked 1 in the US by market capitalization) had a market capitalization of almost US$407 billion, Boeing (ranked 46) had about 44.6 billion US$, and Boots (ranked 44 in the UK) had about 9 billion US. Other companies in our sample had a market capitalization of less than 1 billion US$. So, does the size of the company affect its level of reporting or is this level affected by other factors, such as the structure of ownership (institutional versus individual stockholders). To partially answer this question, we conducted a regression analysis to study the relationship between the size of the company and its IFR level. This was performed on a country-by-country basis in order to reduce the absolute capitalization impact somewhat. The results in Table 7 suggest that for all the countries, with the exception of Australia, there was no relationship between the size of the companies and their IFR level. The relationships were found not to be significant in each of the US, UK, Canada and Hong Kong. Thus, it can be concluded, at least amongst the very largest companies in their market places, that the IFR level of the company does not depend on its size, for each of these four countries16.
16 This may also indicate a loss of any pre-existing size impact as reported elsewhere (e.g. Marston and
Leouw, 1998 in the UK, Tawfik (2001) in the banking sector in Egypt and Marston and Wu (2000) in the case of Japanese companies.
According to Xiao et al. (1996), “large companies are more likely than small ones to use IT (Information Technology) to improve financial reporting to meet the greater demand for information”. Since all the companies covered in our survey are large, it could be expected that Xiao et al rule would not apply in this case. One possible explanation for this finding is that although the companies covered in our survey differ significantly in size (ranging from $1 billion to $400 billion), they all seem to pass what can be considered as a “threshold”. However, based on our data, we cannot determine the exact threshold. Another survey that covers big, medium, and small cap companies should be conducted to determine such point.
Debreceny et al. (2002) reported positive relationship between company size by market capitalization and the level of IFR. These results contradict with our findings. In our opinion, such contradiction may be explained by two reasons. The first is time as the data collection for Debreceny et al. study started on November 1998, where as our data collection started almost three years later in September 2001. The results of our survey compared to previous studies suggest that more companies post their financials online and more disclosure is taking place over time. Due to advances in the Internet and the IR business, the costs associated with going online are expected to be dropping over time; thus weakening the cost as one of the critical factors when deciding on whether to go online and to which extent. The second reason for the contradiction might be due to the fact that Debreceny et al. “did not examine the details of disclosure” (p.382) compared to the level of investigation conducted in our study.
4.3. Countries and IFR level
The Internet as a mean of communication and the growth of multinational companies are two of the most important factors that are bringing different counties and their corporate reporting cultures closer over time – as we have illustrated throughout this paper. However, does this mean that we should find no difference between companies registered in different countries regarding their IFR level? We applied the Kruskal-Wallis test to explore whether IFR practices differ among countries in our sample17.
The Kruskal-Wallis test results, shown in Table 8 (Panel A), suggests that the variation across countries is significant (p<0.01). We can conclude therefore that IFR practices indeed differ according the country within which the company is registered. However, as mentioned earlier, the data presented in Table 8 gives an impression that the biggest 50 companies in each of the US, UK and Canada are similar for both categories of general and financial attributes. Therefore, we applied a further Kruskal-Wallis test to examine whether or not the IFR level across the three countries is in fact similar. The results are shown in Table 8 (Panel B). The results shown in Panel B suggest a significant variation across the three countries. In other words, IFR practices are different between the three countries not as appeared to be the case initially.
We next investigated the difference between each pair of the three apparently similar countries. However, it should be noted that we are not conducting the following tests as alternative to the above Kruskal-Wallis tests18.
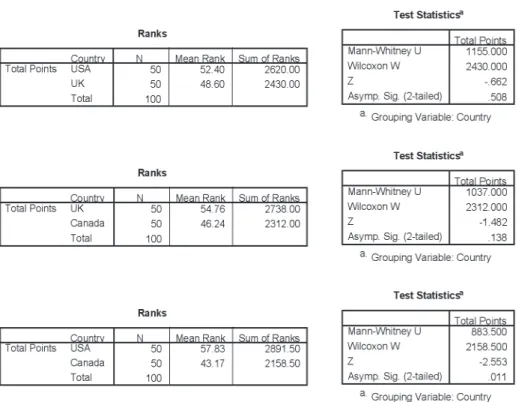
To investigate the difference between pairs of countries, we applied the Mann-Whitney test to our data and found no significant difference between the US and the UK (p>0.05) and the UK and Canada (p>0.05) (See Table 9). This suggests similarity between the companies within each pair of countries regarding their
17 This non-parametric test was used due to the fact that our data did not meet the assumptions required to
run an ANOVA test. Our data did not follow a normal distribution and could not be adjusted through data transformations in order to use the usually preferred ANOVA test, generally considered a more powerful test compared to the Kruskal-Wallis test.
18 Studying the difference among three groups by conducting comparisons of means test on each pair of
IFR practices. However, the Mann-Whitney test results when comparing US and Canadian companies IFR points means produced a significant difference between the practices within the two countries (p<0.05). Given close geographic and economic ties between Canada and the USA, and increasingly close reporting requirements, this result is not unsurprising but is important in terms of its implications for IFR commonality – as illustration performed for the first time we believe.
Table 8a. Panel A: Kruskal-Wallis Test Results for the 5 countries
Table 9. The Mann-Whitney Test Results
It will also be interesting to continue to monitor comparative reporting activity across our sample countries as in the case of at least the UK, Australia and Hong Kong, they move towards a common reporting framework (using International Accounting Standards) such that only non-statutory factors would then be likely to influence levels of IFR compared to the more complex inter-relationships of non-statutory and statutory factors as at present.
5. CONCLUSIONS AND LIMITATIONS
In order to measure the IFR level of companies, we built an index by assigning points to the attributes included in our survey. The resulting index show that US, UK and Canadian companies are close and on the lead regarding reporting over the Internet. Australian companies follow with a small gap, while Hong Kong companies lagged behind with considerable differences on both technological and content matters. The index was used to test the existence of a relationship between the size and the IFR level of companies. No relationship was found to be significant in any of the five countries with exception to Australia. Finally, we investigated the existence of different IFR levels across countries and found significant difference among the companies. However, no significant differences were found between US and UK companies and the same result applies for UK and Canadian companies.
This study is subject to two limitations. First, data collection from Websites depended on our own browsing experience. Websites usually were large and contained many sections. Although we did our best to include all proper information, we may have inadvertently missed some data. However, where omissions appeared significant, these were checked and reviewed to ensure the information was in fact not provided. The second limitation relates to the method we followed in building our IFR level index in respect to how we chose to assign points to attributes. However, similar approaches were followed in previous studies (Ettredge et al., 2001a).
Future research will be useful in this, and related areas of corporate reporting. This will include continuing to develop the benchmarks discussed at the start of this paper, and developed as a part of the contribution of this work. This is particularly important in the light of the developments that will occur over the next few years leading up to, and following on from, wider adoption of International Accounting Standards as the primary framework for large company listings across the world.
Further examination of aspects of the differences in reporting practices (such as the use of audit reports online) is also called for to provide a better understanding of the different needs of users and potential for effective reporting activity using online reporting practices. This domain is still very much in its infancy and continuing to draw heavily on the paper-based reporting models at present.
of interest and further development of the benchmarks of online reporting would be a useful way to monitor the impacts of these changes over time.
Some assessment of the use of, and demand for, online reporting is also called for. This review is largely absent in our understanding of reporting practices leaving us largely with a supply side understanding of the reporting activity undertaken by large companies. Linked to this is the value of monitoring further developments in the voluntary reporting trends in IFR and the role best practice has in influencing reporting activities in the largest multinationals, and down the capitalization strata to smaller reporting entities.
6. REFERENCES
ASHBAUGH, H.; JOHNSTONE, K.; WARFIELD, T. (1999): “Corporate Reporting on the Internet”, Accounting Horizons, 13(3): 241-257.
BARTLETT, S.A.; CHANDLER, R.A. (1997): “The Corporate Report and the Private Shareholder: Lee and Tweedie Twenty Years On”, British Accounting Review, 29: 245-261.
BEATTIE, V.; PRATT, K. (2001): Business Reporting: Harnessing the Power of the Internet for Users: Institute of Chartered Accountants of Scotland Research Report.
CICA. (1999): The Impact of Technology on Financial and Business Reporting, Research Study for the Canadian Institute of Chartered Accountants by G. Trites, October.
DELLER, D.; STUBENRATH, M.; WEBER, C. (1998): “Investor Relations and the Internet: Background, Potential application and Evidence from the USA, UK and Germany”. 21st Annual Congress of the European Accounting Association, Antwerp, Belgium.
ETTREDGE, M.; RICHARDSON, V.J.; SCHOLZ, S. (2001a):. “The Presentation of financial Information at Corporate Web Sites”, International Journal of Accounting Information Systems, 2: 149-168.
FASB (2000): Electronic Distribution of Business Reporting Information, Financial Accounting Standard Board.
FIELD, A. (2000): Discovering Statistics Using SPSS for Windows. London: SAGE.
FLYNN, G.; GOWTHORPE, C. (1997): “Volunteering Financial Data on the World Wide Web: A Study of Financial Reporting from a Stakeholder Perspective”, First Financial Reporting and Business Communication Conference, Cardiff.
FRANCIS, J.S.; KATHERINE (1999): “Have financial statements lost their relevance?”, Journal of Accounting Research, Vol. 37: 319: Blackwell Publishing Limited.
GOWTHORPE, C. (1999): “Corporate Reporting on the Internet: Developing Opportunities for Research”, The Journal of Applied Accounting Research, 5(3): 2-28.
GRAY, G.L.; DEBRECENY, R. (1997): “Corporate Reporting on the Internet: Opportunities and Chanllenges”, Seventh Asian-Pacific Conference on International Accounting Issues, Bangkok.
HODGE, F.D. (2001): “Hyperlinking Unaudited Information to Audited Financial Statements: Effects on Investor Judgments”, The Accounting Review, 76(4): 675-691.
IASC (1999): Business Reporting on the Internet, International Accounting Standard Committee.
JAGGI, B.; ZHAO, R. (1996): “Environmental Performance and Reporting: Perceptions of Managers and Accounting Professionals in Hong Kong”, The International Journal of Accounting, 31(3): 333-346.
LOUWERS, T.J.; PASEWARK, W.R.; TYPPO, E. W. (1996): “The Internet: Changing the Way Corporations Tell Their Story”, The CPA Journal: 24-52 (Complete Missing Pages).
LYMER, A. (1997): “The Use of the Internet for Corporate Reporting - A Discussion of the Issues and Survey of Current Usage in the UK”, Journal of Financial Information Systems.
LYMER, A.; DEBRECENY, R. (2003): “The Auditor and Corporate Reporting on the Internet: Challenges and Institutional Responses”, International Journal of Auditing, 7(2): 103-120.
LYMER, A.; TALLBERG, A. (1997): “Corporate Reporting and the Internet - A Survey and Commentary on the Use of the WWW in Corporate Reporting in the UK and Finland”, 20th Annual Congress of the European Accounting Association, Antwerp, Belgium. April.
MARSTON, C.; LEOW, C.Y. (1998): “Financial Reporting on the Internet by Leading UK Companies”, 21st Annual Congress of the European Accounting Association, Antwerp.
MARSTON, C.; WU, W. (2000): “Financial Reporting on the Internet by Leading Japanese Companies”, Scottish Regional Conference of the British Accounting Association, Aberdeen.
MASON, A.K. (1978): The Development of International Financial Reporting Standards, ICRA Paper No.17. Lancaster.
NIRI (1998): Utilizing Technology in the Practice of Investor Relations Second Measurement: National Investor Relations Institute.
NOBES, C.; PARKER, R. (2000): Comparative International Accounting (6th ed.). London: Pearson Education Limited.
OYELERE, P.; LASWAD, F.; FISHER, R. (2000): “The Determinants of Internet Financial Reporting by New Zealand Listed Companies”, Accounting Association of Australia and New Zealand Conference, Hamilton Island, July.
PARKER, J.P.; ADLER, R.I. (2001): Investor Relations in the Internet Age: A CCBN Perspective: Panacea Press, Inc., Naperville, Illinois.
PETRAVICK, S.; GILLETT, J. (1998): “Distributing Earnings Reports on the Internet”, Management Accounting, October: 54-56.
PIRCHEGGER, B.; WAGENHOFER, A. (1999): “Financial Information of the Internet: A Survey of the Homepages of Austrian Companies”, European Accounting Review, 8(2): 383-395.
SEC (2001): Final Rule: Selective Disclosure and Insider Trading: U.S. Securities and Exchange Commission.
TAWFIK, M.S. (2001): “Financial Reporting on the Internet: A study of the Affecting Variables in Banking Sector”, The Scientific Magazine, Al Azhar University, Cairo, Egypt, 26, January: 229-275.
WEETMAN, P.; COLLINS, B. (1996): Operating and Financial Review: Experiences and Exploration. Edinburgh: The Institute of Chartered Accountants of Scotland.
WILLIAMS, S.M. (1998): “Voluntary Environmental and Social Accounting Disclosure Practices in the Asia-Pacific Region”, Unpublished doctoral thesis, Murdoch University, Western Australia.
WILLIAMS, S.M.; PEI, C. (1999): Corporate Social Disclosures by Listed Companies on Their Web Sites: An International Comparison. International Journal of Accounting, 34(3).