White Matter Damage Disorganizes Brain Functional
Networks in Amnestic Mild Cognitive Impairment
José Angel Pineda-Pardo Pilar Garcés, María Eugenia López, Sara Aurtenetxe, Pablo Cuesta,
Alberto Marcos, Pedro Montejo, Miguel Yus, Juan Antonio Hernández-Tamames,
Francisco del Pozo, James T. Becker, and Fernando Maestu
Abstract
Although progressive functional brain network disruption has been one of the hallmarks of Alzheimer's
Dis-ease, little is known about the origin of this functional impairment that underlies cognitive symptoms. We
in-vestigated how the loss of white matter (WM) integrity disrupts the organization of the functional networks at
different frequency bands. The analyses were performed in a sample of healthy elders and mild cognitive
im-pairment (MCI) subjects. Spontaneous brain magnetic activity (measured with magnetoencephalography) was
characterized with phase synchronization analysis, and graph theory was applied to the functional networks.
We identified WM areas (using diffusion weighted magnetic resonance imaging) that showed a statistical
de-pendence between the fractional anisotropy and the graph metrics. These regions are part of an episodic
mem-ory network and were also related to cognitive functions. Our data support the hypothesis that disruption of the
anatomical networks influences the organization at the functional level resulting in the prodromal dementia
syndrome of MCI.
Key words: diffusion tensor image; graph theory; magnetoencephalography; mild cognitive impairment;
multi-modal integration; phase synchronization
Introduction
A
LZHEIMER'S DISEASE(AD) is the pathological cause of
the most common dementia in the world, and as many
as 50% of people older than age 85 may be afflicted (Corrada
et al., 2010; Evans et al, 1989; Fitzpatnck et al, 2004). The
diagnostic hallmarks of AD are neurofibrillary tangles and
amyloid plaques that are easily identified in postmortem
ex-amination (Braak and Braak, 1991), and more recently with
in vivo brain imaging techniques (Frisoni et al., 2013). This
disease causes significant alterations in brain function, loss
of cortical gray matter, and results in premature death
(Brookmeyer et al., 2002; Ganguli et al, 2005).
However, in the mild stage of the dementia syndrome, and
even in the pre-dementia stage of mild cognitive impairment
(MCI), the exact relationships between brain structure,
func-tion, and clinical symptoms, are not well understood. For
ex-ample, there is a significant disruption of the connections
between neurons at synaptic level (Selkoe, 2002), which
resulted in the "disconnection syndrome" (Bajo et al.,
2010; Delbeuck et al, 2003; Geschwind, 1965; Geschwind
and Kaplan, 1962; Morrison et al, 1986) model of AD.
The defining characteristic is the loss of interregional
con-nectivity (and subsequent clinical symptomatology), but it
is still unknown how these changes affect brain function.
Impairment at the neural network level can be evaluated
by techniques of recording brain activity in real time
the disruption of functional brain network architecture
(Buldú et al., 2011; Stam et al., 2009) across the spectrum
of cognition in aging ranging from a state of normal
cogni-tion, through subjective (but not objective) memory
symp-toms, to MCI to frank dementia (Bajo et al., 2010; Buldú
et al., 2011; Stam et al., 2006). Studies of the anatomical
net-works and connectivity with DTI have shown impairment of
the white matter (WM) in MCI (Medina et al., 2006;
O'Dwyer et al., 2011). However, little is known about the
re-lationship between these two components of brain network
organization (Teipel et al., 2009).
Here, we have attempted to answer a core question related
to the underlying disruptions of brain structure and function
that characterizes the prodromal dementia syndrome of MCI.
That is, what are the relationships among changes in the
structural integrity of the connections between brain regions,
the dynamic patterns of the brain activity measured with
MEG, and the clinical symptoms of MCI? We used the
meth-odologies of graph theory (Bullmore and Sporns, 2009) to
analyze the functional connectivity (FC) networks that we
obtained through our MEG scans. We then combined these
data with those derived from DTI, which allows
measure-ment of the integrity of the connective tracts between brain
regions. We were specifically interested in knowing the
ex-tent to which physical changes in the brain, manifested as
a disruption of the connecting fibers as revealed by DTI,
resulted in alterations in the FC networks as measured by
MEG, and to changes in cognitive function.
We addressed this question by studying 89 elderly
indi-viduals: 52 healthy elderly subjects, and 37 MCI patients
whose main feature was a significant loss of memory referred
to as amnestic mild cognitive impairment (aMCI) (Petersen,
2011). We studied the relationship between graph
theory-derived measures of FC, anatomical interconnectedness
mea-sured with DTI data, and neuropsychological test performance.
We found significant correlations between the integrity of WM
and functional integrity measured in the patients with MCI. Of
most importance, we found that those WM tracts that were
linked to the measures of FC corresponded to parts of an
ana-tomically defined network that supports episodic memory.
Thus, we have identified, for the first time, using multimodal
imaging techniques, a direct link between anatomical
intercon-nectedness as measured by magnetic resonance imaging
(MRI), and functional interconnectedness as measured by
MEG imaging. These results provide important confirmation
of the disconnection hypothesis of the structure-function
ab-normalities in AD, and suggest a possible mechanism that
may increase the risk of MCI in normal aging.
Materials and Methods
Sample selection
Eighty-nine individuals participated in this study: 52
elderly healthy controls (HC) and 37 MCI patients
(demo-graphical description is included in Table 1). The two groups
showed significant differences (p<0.01) in the age,
educa-tion scores, and MMSE evaluaeduca-tion after a paired f-test. No
significant differences were found for the gender
distribu-tions after a Chi-square test (p = 0.11). None of the
partic-ipants had histories of major psychiatric disorders or
neurological diseases. There was no evidence of stroke
or tumor from the structural MRI scans.
TABLE 1. DEMOGRAPHIC VARIABLES INCLUDING GENDER, AGE,
MMSE
SCORES AND EDUCATION SCORESGender:
% male Age MMSE Education
Group (p = 0.1 If (p<0.01)
b(p<0.01)
b(p<0.01)
bHC(rc = 52) 28 69.92(4.45) 29.31(0.86) 3.64(1.21)
MCI(rc = 37) 52 74.22(6.48) 27.44(2.45) 2.82(1.34)
Education level is quantified as: 1. Illiterate; 2. Elementary school
studies; 3. Secondary school studies; 4. Technical or Mid-level
stud-ies; 5. Higher-education or University studies. Data is given as mean
(standard deviation).
a
Thep-value was obtained by Pearson Chi-square.
bThe p-value was obtained by two-sample two-tailed f-test.
MMSE, mini-mental state examination; HC, healthy control;
MCI, mild cognitive impairment.
The diagnosis of MCI was based on a neuropsychological
examination made at the Hospital Clínico de Madrid and the
"UPDC del Ayuntamiento de Madrid." Healthy people were
recruited from the "Seniors Center of the district of
Chamar-tin, Madrid." MCI patients were classified at stage 3 of the
GDS and were diagnosed according to the Grundman et al.
(2004) criteria. All of the MCI patients had a Clinical
Dementia Rating (Berg, 1988) score of 0.5, and none were
taking cholinesterase inhibitors (e.g., donepezil) or other
cognitive enhancing medications (e.g., memantine) before
MRI and MEG scanning.
The research described in this report was reviewed by the
Ethics Committee of the Technical University of Madrid. All
of the participants signed a written informed consent before
participating in any research activities.
MEG acquisition and analysis
MEG data were acquired with a 306 channel Vectorview
system (Elekta-Neuromag) at the Center for Biomedical
Technology (Madrid, Spain). The system comprises 102
magnetometers and 204 planar gradiometers, located inside
a magnetically shielded room. Sampling frequency was
1 kHz and online filtering 0.1-330 Hz was applied. A head
position indicator (HPI) system and a three-dimensional
dig-itizer (FastrakPolhemus) were used to determine the position
of the head with respect to the sensor array. Four HPI coils
were attached to the subject (one on each mastoid, two on
the forehead), and their position with respect to the three
fi-ducials (nasion and left and right preauricular points) was
de-termined. We recorded vertical eye movements, using two
electrodes attached above and below the left eye, and a
ref-erence electrode on the left earlobe. Subjects were asked to
stay calm with their eyes closed for 3 min.
were not considered for further analyses. Notch filters were
used to remove the frequency of the power line (50 Hz) and
its harmonics, and a bandpass filter of 1-150 Hz was applied.
The time series were then filtered into five frequency bands:
delta (2-4 Hz), theta (4-8 Hz), alpha (8-12 Hz), beta
(12-30 Hz), and gamma ((12-30-60 Hz) with linear finite impulse
re-sponse filters of order 1000 and 1 sec padding.
We computed the FC between all 5151 unique pairs of the
102 magnetometers in all frequency bands using phase
lock-ing value (PLV), a measure of phase synchronization
(Mor-mann et al., 2000). Phase synchronization is not sensitive to
the amplitudes of the signals. The instantaneous phase of a
signal cpj (f) is first computed using the Hilbert transform,
then 1 sec is removed from edges on each side. The
instanta-neous phase difference is then computed between pairs of
signals cpj (f). The PLV was obtained as the mean phase
vec-tor, which is based on the circular variance of the phase
dif-ferences projected onto the unit circle:
be calculated as Cj =
L
,k,meNwJiwimwJ-1
PLV= —
M
y gKVjOm)- <?*&.))
where M=4000 is the number of samples in the time series
(4 sec sampled at 1000 Hz). PLV indices have values that
range from 0.0 to 1.0, where 0.0 indicates uncorrected
phase differences and 1.0 corresponds to perfect phase
syn-chronization.
The computation of PLV between all pair of
magnetome-ters yields a measure of the PLV networks (PLVn), which
consists of all 102 nodes connected by their PLV. The
net-works were fully connected because PLV was never 0.
PLVn were averaged across trials leading to one PLVn for
each frequency band and subject. The PLVn were processed
with graph analysis using two metrics that have already been
shown to discriminate AD from healthy elderly people (Stam
et al., 2009): network clustering (C) and the characteristic
path length (L) normalized over random networks {C, £}
[see Rubinov and Sporns (2010) for a review].
The clustering of a node Cj reflects the probability of
find-ing connected triangles in the network with this node. It can
, where w^ represents the
k (Onnela et al.,
weight (PLVs) between nodes j and
2005), and N is the set of nodes (102 magnetometers). The
network clustering is obtained by averaging C'=^^.
gArC/.
The characteristic path length depends on the distance
between nodes. The distance between a pair of nodes is
con-sidered as the inverse of the weights between these two nodes
dj
k= 1/wjk- We define now a path as a sequence of links that
connect a pair of nodes. The shortest path between every
two nodes lj
kis computed using Dijkstra's (1959) algorithm.
The characteristic path length is the average of all shortest
paths between nodes in the network L= ^ r £ -
keNljk (Watts
and Strogatz, 1998). ''
Graph metrics such as C and L are absolute measures of
the network segregation and integration properties
respec-tively. However, these measures are biased by the strength
of the connections and their interpretation is not
straightfor-ward. Because we are more interested in the topological
properties of these measures, that is, the network
organiza-tion, we needed to eliminate the contribution of the
connec-tion strength. For that we followed the method described by
Maslov and Sneppen (2002).
The original networks were "randomized" 100 times, by
permuting the weights of the connections. C and L were
recomputed for each random matrix and averaged across
ma-trices. Finally, we "normalized" the metrics by dividing the
original network parameters by the average of the same
pa-rameter from the random networks (Fig. 1). If {C, £} are
close to 1.0, this means that the measures of segregation
(C) and integration (L) are similar to those of random
net-works. By contrast, if the normalized graph metrics differ
from 1.0, the network parameters (clustering and characteristic
path length) indicate that the system is deviating from a pure
random organization, but they do not shed light on what
kind of guiding rules are responsible for this deviation. In
ad-dition, we computed the network strength, S, a measure of the
global level of connectivity of the network. S is calculated as
the average of all node's strengths S= j/YjeN^J' $ being
the sum of all weights connected to node j Sj = Y_,
keNWjk-3. Graph analysis
Originar network
Clustering; < Clustering; C Shortest Path; L
Random network
Clustering: Crlim < C
Shortest Path: L+, < L
L = L
The graph metrics were compared between groups with mul-tivariate ANOVA tests. Kolmogorov-Smirnov and Levene tests were used to ensure normality of the data and equal var-iances across groups. Three-way ANOVA analysis was per-formed considering diagnosis, age, and gender as factors. We tested the significance of any observed differences in the diagnosis main effect using a false discovery rate (FDR) (Genovese et a l , 2002) of q< 0.1.
MRI acquisition and analysis
All images were collected using a General Electric 1.5T magnetic resonance (MR) scanner, using a high-resolution an-tenna and a homogenization PURE filter. Three-dimensional Tl-weighted anatomical brain MRI scans were acquired with a Fast Spoiled Gradient Echo (FSPGR) sequence with the following parameters: TR/TE/TI=11.2/4.2/450ms; flip
angle 12°; 1mm slice thickness, a 2 5 6 x 2 5 6 matrix, and ^ FOV 25 cm. T2-weighted and FLAIR images were also ac- § quired to identify vascular lesions and WM abnormalities. §
Diffusion weighted images (DWI) were acquired with a ^ single shot echo planar imaging sequence with the following U parameters: TE/TR 96.1/12,000 ms; NEX 3 for increasing ^ the signal to noise ratio; 2.4 mm slice thickness, 1 2 8 x 1 2 8 Q matrix, and 30.7 cm FOV yielding an isotropic voxel of < 2.4 mm; 1 image with no diffusion sensitization (i.e., T2- y
weighted b0 images); and 25 DWI (b = 900 sec/mm ) X
55
DWI were pre-processed with FMRIB's Diffusion Tool- g box (http://fsl.fmrib.ox.ac.uk/fsl/fslwiki/FslOverview/). Pre- £ processing consisted of eddy-current correction, motion w correction, and the removal of non-brain tissue using the ro- ^ bust Brian Extraction Tool (Smith, 2002). Diffusion tensor g images (DTI) were created using the weighed least squares ^ fitting method. We derived images of fractional anisotropy |j (FA) from the DTI, where higher values (i.e., anisotropic Q movement) are considered a marker of healthy WM tracts t« (Basser and Pierpaoli, 1996). We used a voxel-based analysis g (VBA) pipeline to find differences in FA between groups, m and later to find correlations between FA and graph metrics 2
from FC networks. £
<
Voxel-based analyses
oi
VBA of FA images was carried out with SPM8 software w
(www.fil.ion.ucl.ac.uk/spm/software/spm8/). First, b0 im- «
ages were manually aligned to the AC-AC line, and the H same alignment was applied to the FA images. Then, these
Multimodal MEG-FA regression analysis
Here, we use a VBA to discover dependencies between graph metrics from FC networks and FA in aMCI subjects. This methodological pipeline was previously employed in a recent research (Fernández et al., 2011), identifying rela-tionships between complexity in MEG signals and FA. Here instead, we introduced into the VBA the graph metrics as covariates to evaluate our initial hypothesis that the integ-rity of the functional organization of the networks is related to the structural integrity of the WM. We built 10 SPM8 de-sign matrices (5 frequency bands x 2 graph metrics) and obtained statistical parametric maps representing the depen-dency of FA (measured at the voxel-level) with the graph theory parameters. We used an FDR threshold of q < 0.01 with an extent threshold of 50 voxels.
Results
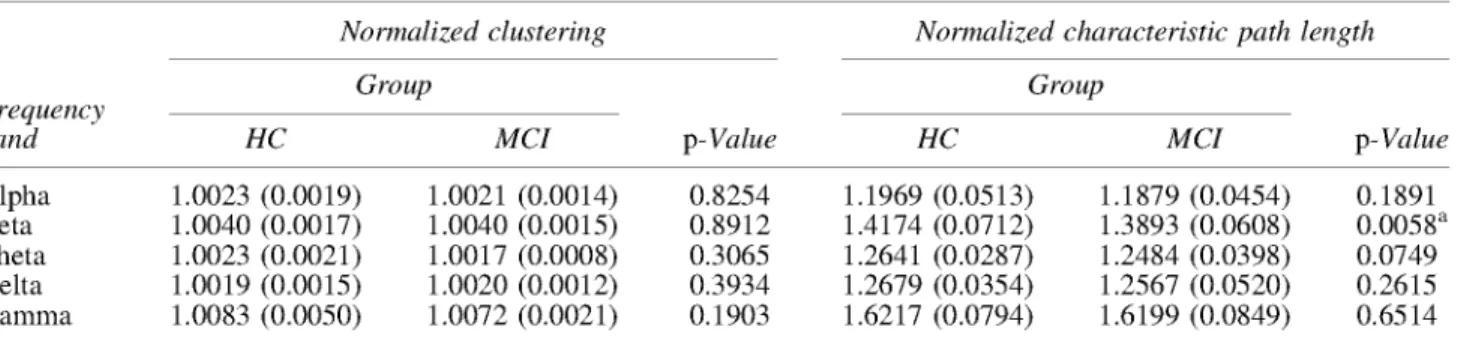
Graph absolute measures C and L showed differences be-tween HC and aMCI groups. C was lower for the HC in beta frequency band (p < 0.05), while L was higher for the HC in beta frequency band ( p < 0 . 0 1 ) (Table 2). However, these parameters depend on the strength of the connections: as S increases, C increases and L decreases (Table 2). Thus, nor-malized graph metrics seems to be a better marker that over-come these differences and just describe the network topography. The results obtained with {C, ¿ } indicate that the normalized characteristic path length in aMCI is lower than controls for beta frequency band (p<0.01) (Table 3). No differences were observed for the normalized clustering. Additionally, we observed that for both groups and for all frequency bands there was no sign of small-world organiza-tion (Watts and Strogatz, 1998).
We identified the anatomical basis of the brain network or-ganization by analyzing the integrity of the WM tracts using DTI. We found significant areas of unhealthy WM in the aMCI patients relative to the controls including long fiber bundles connecting to and from the frontal lobes, and more localized damage affecting the integrity of the Papez Circuit, which is critical for memory processing (Fig. 2 and Table 4). There was damage to the anterior thalamic radiations in the left hemisphere, which connects the anterior and medial tha-lamic nuclei to the frontal lobes (Hua et al., 2008). There were differences in the inferior fronto-occipital fasciculus in both hemispheres, which project caudally from the frontal
lobes via the corona radiata to the temporal and occipital lobes (Hua et al., 2008). The interhemispheric connections of the forceps major (occipital lobes) were also abnormal in aMCI patients (Fig. 2). Finally, we found damage in the long inter-regional connections formed by the inferior and superior longitudinal fasciculi, and more localized damage to the cingulum of the hippocampus, which is a critical path-way within the Papez Circuit (Shah et al., 2012).
We then examined the relationship in both groups (HC and aMCI) between FA (at the voxel level) and all the normalized graph indices in an exploratory analysis, to identify which metrics were dependent on the integrity of the WM. We ana-lyzed the associations between the C and £ measures in each frequency with FA in a whole-brain SPM8 model; we in-cluded age and sex as covariates (FDR q < 0.01).
We did not find significant associations between graph metrics and FA for the HC group. For aMCI we found signif-icant associations between the normalized measure of clus-tering (C) and FA in the delta, theta, and alpha bands, but no significant links between normalized characteristic path length and FA (Fig. 3 and Table 5). We observed significant correlations of the FA in the cingulum of the hippocampus in both hemispheres for C in the delta, theta, and alpha bands. Also, clusters of voxels in the forceps minor and the inferior longitudinal fasciculus (ILF) in the left hemisphere corre-lated with C. We found more frequency-limited correlations between FA and C in delta and theta bands in the right ante-rior thalamic radiation, and in the alpha band in the left hemi-sphere. We studied the WM integrity in these clusters of association identified for the aMCI group. Average FA was computed across the clusters for both groups. We observed that there was a significant FA decrease in most clusters for the aMCI group compared with HC group (Table 5).
These WM regions were also related to the cognitive func-tions of the aMCI patients. We correlated performance on our neuropsychological tests with the average FA of the clus-ters. We found that interregional and interhemispheric con-nections were critical for the successful performance of these tasks. Specifically, phonemic fluency ("tell me as many words as you can beginning with the letter F " ) corre-lated with FA in the forceps minor (connecting the frontal lobes), and that semantic fluency (i.e., "name as many ani-mals as possible within one minute") was not only correlated with FA in the forceps minor, but also the right anterior tha-lamic radiation, the right inferior fronto-occipital fasciculus,
Frequency band
TABLE 3. NORMALIZED G R A P H METRICS COMPARISON B E T W E E N HC AND A M C I GROUPS
Normalized clustering Normalized characteristic path length
Group Group
p-Value
HC MCI HC MCI p-Value
Alpha Beta Theta Delta Gamma
1.0023 (0.0019) 1.0040 (0.0017) 1.0023 (0.0021) 1.0019 (0.0015) 1.0083 (0.0050)
1.0021 (0.0014) 1.0040 (0.0015) 1.0017 (0.0008) 1.0020 (0.0012) 1.0072 (0.0021)
0.8254 0.8912 0.3065 0.3934 0.1903
1.1969 (0.0513) 1.4174 (0.0712) 1.2641 (0.0287) 1.2679 (0.0354) 1.6217 (0.0794)
1.1879 (0.0454) 1.3893 (0.0608) 1.2484 (0.0398) 1.2567 (0.0520) 1.6199 (0.0849)
0.1891 0.0058a 0.0749 0.2615 0.6514
Data are given as mean (standard deviation). The p-values were obtained by multifactorial ANOVA, where age and gender were included as factors.
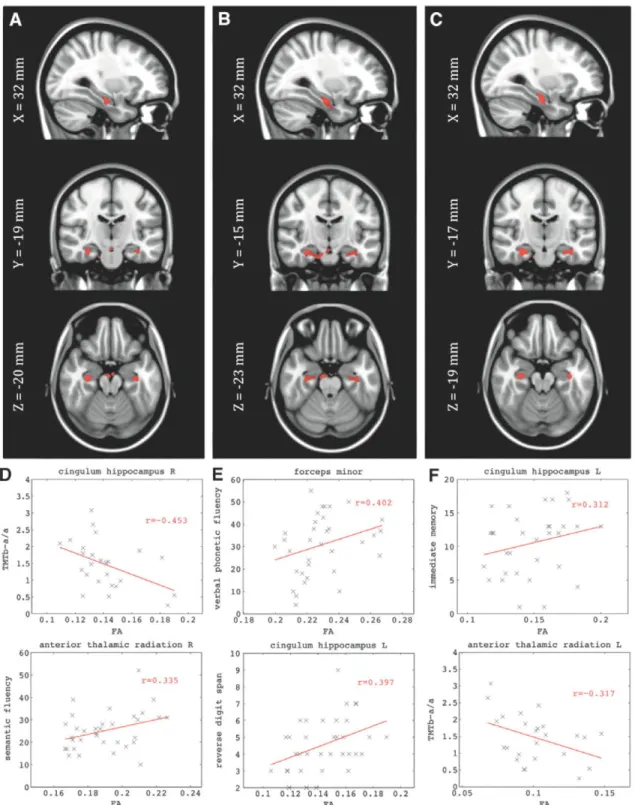
FIG. 2. Fractional anisotropy (FA) voxel-based analysis between healthy control (HC) and amnestic mild cognitive impair-ment (aMCI) groups. Regions that showed higher FA values in HC compared to aMCI (uncorrected p-value p < 0.001 and min-imum cluster size of 20 voxels) have been highlighted in orange-yellow colors. The colors represent the t-value of the voxels. Color images available online at www.liebertpub.com/brain
and the right ILF—that is the long interregional connections (Table 6). The ability of the aMCI patients to recall short prose passages immediately after presentation was associ-ated with FA in the right inferior fronto-occipital fasciculus, right ILF, and the left cingulum of the hippocampus. Recall of those same prose passages after a delay of 20min was
linked to FA in the right inferior fronto-occipital fasciculus. Finally, a measure of frontal system function (i.e., the Trail-making Test) was correlated with FA in the right cingulum of the hippocampus, the right anterior thalamic radiation, and the forceps minor.
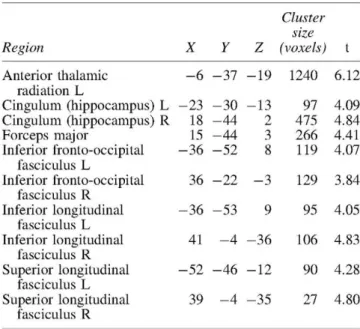
TABLE 4. MNI COORDINATES OF THE VBA RESULTS SHOWING DIFFERENCES IN FA B E T W E E N HC AND A M C I GROUPS (UNCORRECTED p-Value p < 0.001
AND M I N I M U M CLUSTER S I Z E OF 20 VOXELS)
Region
Anterior thalamic
radiation L
Cingulum (hippocampus) L
Cingulum (hippocampus) R
Forceps major
Inferior fronto-occipital
fasciculus L
Inferior fronto-occipital
fasciculus R
Inferior longitudinal
fasciculus L
Inferior longitudinal
fasciculus R
Superior longitudinal
fasciculus L
Superior longitudinal
fasciculus R
X
- 6
- 2 3
18
15
- 3 6
36
- 3 6
41
- 5 2
39
Y
- 3 7
- 3 0
- 4 4
- 4 4
- 5 2
- 2 2
- 5 3
- 4
- 4 6
- 4
Z
- 1 9
- 1 3
2
3
8
- 3
9
- 3 6
- 1 2
- 3 5
Cluster
size
(voxels)
1240
97
475
266
119
129
95
106
90
27
t
6.12
4.09
4.84
4.41
4.07
3.84
4.05
4.83
4.28
4.80
The tracts were identified with the probabilistic atlas from Johns Hopkins University (Hua et al., 2008). In the table are shown the main tracts where the differences were identified. The table includes the MNI coordinates of the voxel with highest significance, the clus-ter size and the peak f-value.
MNI, Montreal Neurological Institute; VBA, voxel-based analy-sis; FA, fractional anisotropy.
Discussion
First, and most important, we report here for the first time the significant associations between the structural integrity of WM as revealed by the DTI, and the functional integrity of the neuronal networks in aMCI patients as revealed by graph theory metrics. In the process of reaching these find-ings, we also confirmed prior observations of the significant alterations in the integrity of WM in aMCI patients relative to healthy controls (Medina et al., 2006; O'Dwyer et al., 2011), and that there are disruptions of FC of the neuronal networks measured with MEG (Buldú et al., 2011; Stam et al., 2009). It is worth mentioning that this study counts with some limitations; (1) the groups did not match in age nor education level. Although we included age and gender as regressors in all statistical analyses, this could bias the re-sults and hence more homogeneous samples are needed to confirm the findings; (2) the differences in the graph analyses were not statistically robust as they just overcome an FDR correction of q<0.1, however, due to the low number of comparisons we consider this threshold to be enough; further analyses with the networks will be needed to identify more robust markers of the pathology in the topography of the functional networks; (3) the lack of small-world organization in the functional networks has also been observed (Stam et al., 2009), and it could be a consequence of using fully connected weighted un-thresholded networks.
•"* -i
3.5 3
a 2.5
1J
I0.5
O
cingulum hippocampus R
I- 60
•
* 40 o
I 30
1 O OH 20
«1
& 10
X
forceps minor
X
* x
•T*
15*
5
Xjf X
^
.x
>:
r = 0 . 4 0 2>í
-*""£*
¡t. Xcingulum hippocampus L
I "
0.1 0.12 0.14 0,16 0.18 0.2 FA
anterior thalamic radiation R
.18 0.2 0.22 0.24 0.26 0.2G FA
cingulum hippocampus L
1.1 0.15 0.2 FA
anterior thalamic radiation L
0.1 0.12 0.14 0.16 0.1S 0.2 FA
FIG. 3. (A-C) Dependency of the FA with the random normalized graph metrics in the aMCI group: (A) Normalized
clus-tering in delta band; (B) normalized clusclus-tering in theta band; (C) normalized clusclus-tering in alpha band. Montreal Neurological
Institute (MNI) Tl template of 1 mm isotropic voxel was chosen for representation. The highlighted voxels (red) showed
statistical significance corrected for multiple comparisons with false discovery rate (FDR) q < 0.01. (D-F) Depict the
neuro-psychological scores versus the average FA for the highlighted clusters in (A-C) respectively. Color images available online
at
www.liebertpub.com/brain
they were in the cognitively healthy individuals. The more a
normalized graph metric differs from one, the further from
random the network organization is. In our results all
normal-ized graph metrics were higher than one, therefore positive
correlations between the metrics and FA means that this
measure of network integrity is related to the "health" of
the WM in that particular fiber tract.
TABLE 5. MNI COORDINATES FOR THE TRACTS SHOWING DEPENDENCE B E T W E E N FA AND THE NORMALIZED G R A P H THEORY METRICS IN THE A M C I G R O U P
Metrics/region X Cluster size (FA) aMCI (FA) HC p-Value
C (2-4 Hz)
Anterior thalamic radiation R Cingulum (hippocampus) L Cingulum (hippocampus) R Forceps minor
Inferior longitudinal fasciculus L
C (4-8 Hz)
Anterior thalamic radiation R Cingulum (hippocampus) L Cingulum (hippocampus) R Forceps minor
Inferior fronto-occipital fasciculus R Inferior longitudinal fasciculus L Inferior longitudinal fasciculus R
C (8-12 Hz)
Anterior thalamic radiation L Cingulum (hippocampus) L Cingulum (hippocampus) R Forceps minor
Inferior fronto-occipital fasciculus R Inferior longitudinal fasciculus L
5 - 3 4 32 6 - 3 5
5 - 3 7 30 7 26 - 3 6 25
- 1 6 - 3 6 32 - 1 5 33 - 3 6
- 1 4 - 1 8 - 1 8 - 1 3 - 1 8
- 1 3 - 1 8 - 1 6 - 1 3 - 7 6 - 1 8 - 7 7
26 - 1 6 - 1 8 26 - 2 2 - 1 7
- 2 1 - 2 1 - 2 3 - 2 1 - 2 1
- 2 0 - 2 1 - 2 2 - 2 1 - 1 7 - 2 1 - 1 7
1 - 2 3 - 2 3 2 - 1 5 - 2 1
9 60 74 13 48 17 128 194 16 140 111 53 26 191 203 131 20 110 6.42 6.52 7.06 7.41 7.05 6.93 7.81 7.89 8.11 8.88 8.85 8.23 6.46 6.95 7.70 6.99 7.15 7.31 0.19 (0.02) 0.14 (0.02) 0.14 (0.02) 0.23 (0.02) 0.14 (0.02) 0.19 (0.02) 0.14 (0.02) 0.15 (0.02) 0.23 (0.02) 0.11 (0.01) 0.15 (0.02) 0.11 (0.01) 0.10 (0.02) 0.15 (0.02) 0.15 (0.03) 0.10 (0.02) 0.13 (0.02) 0.16 (0.02) 0.19 (0.02) 0.16 (0.02) 0.16 (0.02) 0.24 (0.02) 0.16 (0.02) 0.19 (0.02) 0.16 (0.02) 0.16 (0.02) 0.24 (0.02) 0.11 (0.01) 0.17 (0.02) 0.11 (0.01) 0.12 (0.02) 0.16 (0.02) 0.17 (0.02) 0.12 (0.02) 0.14 (0.02) 0.18 (0.02) 0.495 0.005a 0.012a 0.021a 0.001a 0.533 0.024a 0.006a 0.034a 0.636 0.001a 0.268 0.129 0.028a 0.058 0.123 0.029a 0.003a
Only the normalized clustering in delta, theta and alpha bands showed significant dependence (FDR q< 0.01) with the FA in the indicated tracts. These tracts were identified with the probabilistic atlas from Johns Hopkins University (Hua et al., 2008). The table includes the MNI coordinates of the voxel with highest significance, the cluster size (i.e., number of voxels) and the peak t-value. The last three columns con-tain the average FA and standard deviations across subjects in the WM clusters, and the p-values after a multifactorial ANOVA, including age and gender as factors.
aFDR correction for multiple comparisons (q<0.\). WM, white matter.
distant brain regions. The affected frequency bands, delta, theta, and beta all show the loss of clustering organization, which is one sign of a tendency to form a random network among the MCI patients. The WM loss disrupts the normal communication along the entire episodic memory functional network (Lockhart et al., 2012). Although we did not find a significant association between FA and the normalized graph metrics for the HC group, healthy subjects showed a higher average FA in the clusters identified for the aMCI group. This led us to consider that the damage of those regions might form the anatomical basis of cognitive and functional decline.
In our work, a lower performance in episodic memory tests was associated with a reduced network organization during resting state in the MCI group. This is consistent with the observations that the resting state network architec-ture has been linked to episodic memory performance in
healthy control subjects (Buckner et al., 2008), in patients with damage in the medial temporal lobe (MTL) (McCor-mick et al., 2013), and in AD patients (Stam et a l , 2009). The tendency toward a random architecture of the network that we found during "rest," coupled with the loss of WM integrity, could, at the very least affect memory processing by disrupting encoding and recall stages. This is supported by the observation that there is a correlation between disrup-ted WM (i.e., lower FA) in the inferior fasciculus and the cin-gulum of the hippocampus with both encoding and delayed recall of prose passages. Thus, it appears that the MTL, ILF, anterior thalamus, and the forceps minor are forming a network necessary to encode, maintain, and recall informa-tion from episodic memory.
Although damage to WM can sometimes be considered secondary to gray matter loss, there is evidence of dam-age to the WM in the absence of gray matter loss both in
TABLE 6. CORRELATES OF THE NEUROPSYCHOLOGICAL SCORES W I T H THE M E A N FA VALUES IN SPECIFIC WM TRACTS
Region Neuropsycological test Rho-Spearman
Anterior thalamic radiation R Cingulum (hippocampus) L Cingulum (hippocampus) R
Inferior fronto-occipital fasciculus R Inferior longitudinal fasciculus R Forceps minor
Semantic fluency, TMT b, TMT b-a 0.33; - 0 . 3 6 ; - 0 . 3 6 Logical memory I, reverse digit span 0.31; 0.44
TMT b-a, reverse digit span - 0 . 4 0 ; 040 Semantic fluency, logical memory I, logical memory II 0.37; 0.37; 0.31 Semantic fluency, logical memory I 0.31, 0.34 Phonetic fluency, semantic fluency, TMT b-a 0.40; 0.35; —0.36
human and animal models (Desai et al., 2009; Seines et al.,
2012). Perhaps most important, is the fact that at least
some of the WM damage is related to the vascular changes,
which are often represented as WM hyperintensities (Zhuang
et al, 2010).
Our findings are provocative because they lend support to
the idea that the clinical syndrome of AD is at least partially
represented as a disconnection syndrome, and that such
dis-connection can be observed in the prodromal phase between
normal cognition and clinical dementia (i.e., MCI). The joint
use of anatomical and neurophysiological data in this study
provides us with the opportunity to address this question in
a way that could not be done with either modality alone.
What is not clear from our data is the extent to which other
variables, including the presence of the APOE*4 risk gene
or the extent of beta-amyloid deposition, affect brain
struc-tural and functional health.
The data that we report here are fully consistent with prior
MEG studies [see Zamrini et al. (2011) for review]. AD
pa-tients have a general decrease in FC across all frequencies
(Stam, 2010), indicating less organized functional networks.
However, MCI patients are able to muster a possible
com-pensatory response by increasing inter-regional connectivity
to support their performance on memory tasks (Bajo et al.,
2010), and which may be one expression of brain or
cogni-tive reserve (Satz, 1993; Stern et al., 1992, 1994). The
net-work architecture in MCI patients has a loss of cluster
organization and a tendency toward a more random (i.e.,
less organized) network structure (Buldu et al., 2011), and
those patients who subsequently become demented have
higher synchronization values (Bajo et al., 2012a). This latter
point is important because it suggests that
hypersynchroniza-tion reflects a pathological state within the neuronal
net-works. By contrast, individuals with subjective memory
complaints (but no evidence of object memory loss) actually
underexpress a network that supports recognition memory
(Bajo et al., 2012b). Thus, there seems to be a dynamic
change in brain function over the spectrum of normal
aging through subjective memory complaints to MCI to
de-mentia. Our data suggest a consistency in the observations
regarding the neural networks in MCI patients, and add to
our understanding of the altered function by providing a
structural basis for the functional changes.
It is important to note the contributions of graph theory
(Bullmore and Sporns, 2009) to our understanding of brain
functional networks. In graph theory we conceptualize an
un-derlying network as consisting of a series of nodes or
verti-ces, and a set of links that connect the nodes. While the
nodes in our MEG analysis are grounded in physical space—
they represent the individual MEG sensors—the links
be-tween the nodes, or path lengths, are related to functional,
not physical proximity. Thus, the shortest path length
param-eter may connect spatially disparate points but which have a
high degree of interconnectedness with a relatively few
num-ber of intervening nodes. While these graph theory metrics
have been used in other electrophysiological studies (Bassett
et al., 2006; Stam et al., 2009), this is the first time that these
metrics have been shown to be related to brain structural
in-tegrity, and specifically the physical connections between
brain regions. Teipel et al. (2009) showed a correlation
be-tween WM structure in the thalamus, among other structures,
and the frontal coherence values at the alpha band with
elec-troencephalography. However, they did not report how the
damage of specific WM tracts disrupted the organization of
the whole brain network.
There is a growing body of evidence that suggests that
measures of the brain functional organization as revealed
by MEG show a progressive pattern of change as an
individ-ual moves from a state of normal cognition, through
subjec-tive memory complaints, to MCI, and finally to clinical
dementia. The extent of brain functional abnormality may
be related to the speed at which an individual may develop
dementia, or may be viewed as representing the extent of
neuronal network abnormality that is not completely
cap-tured by clinical examination. As the requirements of science
demand our ability to detect the earliest evidence of
patho-logical change in the brains of individuals destined to
de-velop the dementia of AD, the sensitivity of MEG to brain
functional changes prior to clinical change may be critical.
Conclusion
We have provided evidence that the impairment in specific
WM tracts is related to a shift of the functional networks
to-ward a random organization. How these changes fit into the
natural history of AD and dementia is yet to be determined.
However, these and related data go a long way toward
vali-dating the utility of the anatomical-FC (DTI/MEG) in our
studies of the natural history of AD.
Ackowledgments
This work was supported in part by funds from the Spanish
Ministry of Economy and Competitiveness
(PSI2012-38375-C03-01) and the Spanish Ministry of Science
(PSI2009-14415-C03-01). The authors are grateful to the research participants
and their families for their participation in this study. J.A.P.P.
was supported by the Spanish Ministry of Education through
the National Program FPU (AP2010-1317). P.G. was supported
by a grant of the Campus de Excelencia Moncloa. M.E.L. was
supported by a predoctoral fellowship from the Ministry of
Education (FPU AP-2008-00175). S.A. was supported by a
pre-doctoral grant of the Basque Government. J.T.B. was
sup-ported, in part, by funds from the National Institutes of
Health (AG05133, MH098745).
Author Disclosure Statements
No competing financial interests exist.
References
Ashburner J. 2007. A fast diffeomorphic image registration
algo-rithm. Neuroimage 38:95-113.
Bajo R, Castellanos NP, Cuesta P, Aurtenetxe S, Garcia-Prieto J,
Gil-Gregorio P, del-Pozo F, Maestu F. 2012a. Differential
patterns of connectivity in progressive mild cognitive
impair-ment. Brain Connect 2:21-24.
Bajo R, Castellanos NP, López ME, Ruiz JM, Montejo P,
Mon-tenegro M, Llanero M, Gil P, Yubero R, Baykova E, Paul N,
Aurtenetxe S, Del Pozo F, Maestu F. 2012b. Early
dysfunc-tion of funcdysfunc-tional connectivity in healthy elderly with
subjec-tive memory complaints. Age (Dordr) 34:497-506.
Bajo R, Maestú F, Nevado A, Sancho M, Gutiérrez R, Campo P,
during a memory task: implications for the disconnection hy-pothesis. J Alzheimers Dis 22:183-193.
Basser PJ, Pierpaoli C. 1996. Microstructural and physiological features of tissues elucidated by quantitative-diffusion-tensor MRI. J Magn Reson B 111:209-219.
Bassett DS, Meyer-Lindenberg A, Achard S, Duke T, Bullmore E. 2006. Adaptive reconfiguration of fractal small-world human brain functional networks. Proc Natl Acad Sci U S A 103:19518-19523.
Berg L. 1988. Clinical Dementia Rating (CDR). Psychopharma-col Bull 24:637-639.
BraakH, BraakE. 1991. Demonstration of amyloid deposits and neurofibrillary changes in whole brain sections. Brain Pathol 1:213-216.
Brookmeyer R, Corrada MM, Curriero FC, Kawas C. 2002. Sur-vival following a diagnosis of Alzheimer disease. Arch Neu-rol 59:1764-1767.
Buckner RL, Andrews-Hanna JR, Schacter DL. 2008. The brain's default network: anatomy, function, and relevance to disease. Ann N Y Acad Sci 1124:1-38.
Buldu JM, Bajo R, Maestu F, Castellanos N, Leyva I, Gil P, Sen-diña-Nadal I, Almendral JA, Nevado A, del-Pozo F, Bocca-letti S. 2011. Reorganization of functional networks in mild cognitive impairment. PLoS One 6:el9584.
Bullmore E, Sporns O. 2009. Complex brain networks: graph theoretical analysis of structural and functional systems. Nat Rev Neurosci 10:186-198.
Collignon A, Maes F. 1995. Automated multi-modality image registration based on information theory. Proc Inf Process Med Imaging 263-274.
Corrada MM, Brookmeyer R, Paganini-Hill A, Berlau D, Kawas CH. 2010. Dementia incidence continues to increase with age in the oldest old: the 90+ study. Ann Neurol 67:114-121. Delbeuck X, Van Der Linden M, Collette F. 2003. Alzheimer' s
disease as a disconnection syndrome? Neuropsychol Rev 13:78-92.
Desai MK, Sudol KL, Janelsins MC, Mastrangelo MA, Frazer ME, Bowers WJ. 2009. Triple-transgenic Alzheimer's dis-ease mice exhibit region-specific abnormalities in brain mye-lination patterns prior to appearance of amyloid and tau pathology. Glia 57:54-65.
Dijkstra EW. 1959. A note on two problems in connexion with graphs. Num Math 1:269-271.
Evans DA, Funkenstein HH, Albert MS, Scherr PA, Cook NR, Chown MJ, Hebert LE, Hennekens CH, Taylor JO. 1989. Prevalence of Alzheimer's disease in a community popula-tion of older persons. Higher than previously reported. JAMA 262:2551-2556.
Fernández A, RíosLago M, Abasólo D, Hornero R, Alvarez -Linera J, Paul N, Maestú F, Ortiz T. 2011. The correlation be-tween white-matter microstructure and the complexity of spontaneous brain activity: a difussion tensor imaging-MEG study. Neuroimage 57:1300-1307.
Fitzpatrick AL, Kuller LH, Ives DG, Lopez OL, Jagust W, Breit-ner JCS, Jones B, Lyketsos C, Dulberg C. 2004. Incidence and prevalence of dementia in the cardiovascular health study. J Am Geriatr Soc 52:195-204.
Frisoni GB, Bocchetta M, Chételat G, Rabinovici GD, de Leon MJ, Kaye J, Reiman EM, Scheltens P, Barkhof F, Black SE, Brooks DJ, Carrillo MC, Fox NC, Herholz K, Nordberg A, Jack CR, Jagust WJ, Johnson KA, Rowe CC, Sperling RA, Thies W, Wahlund L-O, Weiner MW, Pasqualetti P, Decarli C. 2013. Imaging markers for Alzheimer disease: which vs how. Neurology 81:487-500.
Ganguli M, Dodge HH, Shen C, Pandav RS, DeKosky ST. 2005. Alzheimer disease and mortality: a 15-year epidemiological study. Arch Neurol 62:779-784.
Genovese CR, Lazar NA, Nichols T. 2002. Thresholding of sta-tistical maps in functional neuroimaging using the false dis-covery rate. Neuroimage 15:870-878.
Geschwind N. 1965. Disconnexion syndromes in animals and man. II. Brain 88:585-644.
Geschwind N, Kaplan E. 1962. A human cerebral deconnection syndrome. A preliminary report. Neurology 12:675-685. Grundman M, Petersen RC, Ferris SH, Thomas RG, Aisen PS,
Bennett, DA, Foster NL, Jack CR, Galasko DR, Doody R, Kaye J, Sano M, Mohs R, Gauthier S, Kim HT, Jin S, Schultz AN, Schafer K, Mulnard R, van Dyck CH, Mintzer J, Zamrini EY, Cahn-Weiner D, Thai LJ. 2004. Mild cogni-tive impairment can be distinguished from Alzheimer dis-ease and normal aging for clinical trials. Arch Neurol 61: 59-66.
Hua K, Zhang J, Wakana S, Jiang H, Li X, Reich DS, Calabresi PA, Pekar JJ, van Zijl PCM, Mori S. 2008. Tract probability maps in stereotaxic spaces: analyses of white matter anatomy and tract-specific quantification. Neuroimage 39:336-347. Lockhart SN, Mayda ABV, Roach AE, Fletcher E, Carmichael
O, Maillard P, Schwarz CG, Yonelinas AP, Ranganath C, Decarli C. 2012. Episodic memory function is associated with multiple measures of white matter integrity in cognitive aging. Front Hum Neurosci 6:56.
Maslov S, Sneppen K. 2002. Specificity and stability in topology of protein networks. Science 296:910-913.
McCormick C, Quraan M, Cohn M, Vahante TA, McAndrews MP. 2013. Default mode network connectivity indicates epi-sodic memory capacity in mesial temporal lobe epilepsy. Epilepsia 54:809-818.
Medina D, DeToledo-Morrell L, Urresta F, Gabrieli JDE, Mose-ley M, Fleischman D, Bennett DA, Leurgans S, Turner DA, Stebbins GT. 2006. White matter changes in mild cognitive impairment and AD: a diffusion tensor imaging study. Neu-robiol Aging 27:663-672.
Mormann F, Lehnertz K, David PE, Elger C. 2000. Mean phase coherence as a measure for phase synchronization and its ap-plication to the EEG of epilepsy patients. Phys D Nonlin Phe-nom 144:358-369.
Morrison J, Scherr S, Lewis D, Campbell M, Bloom F, Rogers J, Benoit R. 1986. The laminar and regional distribution of neo-cortical somatostatin and neuritic plaques: implications for Alzheimer's disease as a global neocortical disconnection syndrome. In: Scheibel A, Wechsler A, Brazier M (eds.),
The Biological Substrates of Alzheimer's Disease. Orlando:
Academic Press, pp. 115-131.
O'Dwyer L, Lamberton F, Bokde ALW, Ewers M, Faluyi YO, Tanner C, Mazoyer B, O'Neill D, Bartley M, Collins DR, Coughlan T, Prvulovic D, Hampel H. 2011. Multiple indices of diffusion identifies white matter damage in mild cogni-tive impairment and Alzheimer's disease. PLoS One 6: e21745.
Onnela J-P, Saramáki J, Kertész J, Kaski K. 2005. Intensity and coherence of motifs in weighted complex networks. Phys Rev E 71:065103.
Oostenveld R, Fries P, Maris E, Schoffelen J-M. 2011. Field-Trip: open source software for advanced analysis of MEG, EEG, and invasive electrophysiological data. Comput Intell Neurosci 2011, 156869.
Rubinov M, Sporns O. 2010. Complex network measures of brain connectivity: uses and interpretations. Neuroimage 52: 1059-1069.
Satz P. 1993. Brain reserve capacity on symptom onset after brain injury: a formulation and review of evidence for thresh-old theory. Neuropsychology 7:273-295.
Selkoe DJ. 2002. Alzheimer's disease is a synaptic failure. Sci-ence 298:789-791.
Seines P, Fjell AM, Gjerstad L, Bj0rnerud A, Wallin A, Due-T0nnessen P, Grambaite R, Stenset V, Fladby T. 2012. White matter imaging changes in subjective and mild cogni-tive impairment. Alzheimers Dement 8:S112-S121. Shah A, Jhawar SS, Goel A. 2012. Analysis of the anatomy of
the Papez circuit and adjoining limbic system by fiber dissec-tion techniques. J Clin Neurosci 19:289-298.
Smith SM. 2002. Fast robust automated brain extraction. Hum Brain Mapp 17:143-155.
Stam CJ. 2010. Use of magnetoencephalography (MEG) to study functional brain networks in neurodegenerative disor-ders. J Neurol Sci 289:128-134.
Stam CJ, de Haan W, Daffertshofer A, Jones BF, Manshanden I, van Cappellen van Walsum A, Montez T, Verbunt JPA, de Munck JC, van Dijk BW, Berendse HW, Scheltens P. 2009. Graph theoretical analysis of magnetoencephalographic func-tional connectivity in Alzheimer's disease. Brain 132:213-224. Stam CJ, Jones BF, Manshanden I, van Cappellen van Walsum A M, Montez T, Verbunt JPA, de Munck JC, van Dijk BW, Berendse HW, Scheltens P. 2006. Magnetoencephalographic evaluation of resting-state functional connectivity in Alz-heimer's disease. Neuroimage 32:1335-1344.
Stern Y, Alexander GE, Prohovnik I, Mayeux R. 1992. Inverse relationship between education and parietotemporal perfu-sion deficit in Alzheimer's disease. Ann Neurol 32:371-375. Stern Y, Gurland B, Tatemichi TK, Tang MX, Wilder D,
Mayeux R. 1994. Influence of education and occupation
on the incidence of Alzheimer's disease. JAMA 271:1004-1010.
Taulu S, Kajola M. 2005. Presentation of electromagnetic mul-tichannel data: the signal space separation method. J Appl Phys 97:124905.
Teipel SJ, Pogarell O, Meindl T, Dietrich O, Sydykova D, Hunk-linger U, Georgii B, Mulert C, Reiser MF, Moller H-J, Ham-pel H. 2009. Regional networks underlying interhemispheric connectivity: an EEG and DTI study in healthy ageing and amnestic mild cognitive impairment. Hum Brain Mapp 30: 2098-2119.
Watts DJ, Strogatz SH. 1998. Collective dynamics of "small-world" networks. Nature 393:440-442.
Zamrini E, Maestu F, Pekkonen E, Funke M, Makela J, Riley M, Bajo R, Sudre G, Fernandez A, Castellanos N, Del Pozo F, Stam CJ, van Dijk BW, Bagic A, Becker JT. 2011. Magneto-encephalography as a putative biomarker for Alzheimer's disease. Int J Alzheimers Dis 2011, 280289.