Abstract—Communications Based Train Control Systems require high quality radio data communications for train signaling and control. Actually most of these systems use 2.4GHz band with proprietary radio transceivers and leaky feeder as distribution system. All them demand a high QoS radio network to improve the efficiency of railway networks. We present narrow band, broad band and data correlated measurements taken in Madrid underground with a transmission system at 2.4 GHz in a test network of 2 km length in subway tunnels. The architecture proposed has a strong overlap in between cells to improve reliability and QoS. The radio planning of the network is carefully described and modeled with narrow band and broadband measurements and statistics. The result is a network with 99.7% of packets transmitted correctly and average propagation delay of 20ms. These results fulfill the specifications QoS of CBTC systems.
Index Terms—Railway, CBTC, train control, Tunnels, quality of service, simulcast.
I. INTRODUCTION
Railways are becoming very important for mass people movement. Advanced metropolitan railway must have high capacity, reliability and security and these requires the use of communications based train control systems (CBTC) [1],[2]. This technology is basic for train capacity and is beginning to get used in most advanced subways.
CBTC is an automated control system for railways that improves and ensures the safe operation of rail vehicles using wireless data communication between the trains and the control centre. CBTC is a modern successor of the traditional railway signaling systems which provide a limited control using track circuits, interlocking, and signals.
All CBTC systems operate in the same basic way: an off board computer can control all trains operating on a track linked to the computer. This allows trains to be spaced closer together than on a manually controlled line. The computer sends information to the computers aboard the train using wireless communications.
CBTC systems use a radio data communications network to send objective speed information to the trains and to receive location and actual speed from trains. The system uses a communications network composed of several base stations connected to the train control system. The off board computer is polling one by one all the moving train in a part of the track.
Each train polled must answer sending their location and speed and then the off board computer sends the objective speed or distance to each train according to their relative position. This information is updated every 100 to 300 ms. If one train do not answer during a period of time from 500 ms to 1 second all trains in the control area must reduce speed or carry out and emergency braking. Therefore radio network must have a high quality of service and an low transmission delay.
Most of modern CBTC systems use data communications in the 2.4 GHz band with proprietary radio transceivers [3]. To achieve a high quality of service most of new networks are using leaky feeder [4] as transmission system in between radio base stations and trains.
Leaky feeder network in a complex tunnels environment of a large subway is difficult and expensive to install and do not guarantee a high QoS in all cases. Propagation studies [5] [6] have shown that radio coverage in tunnels can also be achieve with good quality using antennas. We proposed a solution based on the use of base stations with antennas. This solution requires more engineering work but it is fast and easy to deploy than a leaky feeder and our test has shown that it can reach a high quality of service in a real complex environment of tunnels. The antennas solution has a cost 1/4 of leaky feeder solution and also installation and maintenance is easier and cheaper.
On this paper we present the complete test of a radio network with high QoS for broadband data transmissions in subway tunnels. The solutions has been modeled and tested with narrow band and broadband measurements, and data transmissions. All the results are correlated so we can easy and carefully evaluate the influence of propagation in the transmission data errors.
II. MEASUREMENTS SYSTEM AND ENVIRONMENT
The objective of the measurements was to evaluate the quality of service obtained with a wireless transmission system in a complex tunnels environment at 2.4GHz using antennas. For this purpose three types of measurements were made: Narrow band propagation, broadband channel modeling and data transmission measurements. The results are correlated and can be used to evaluate quality of service (QoS) of the channel and two verify the good design of the radio network.
The measurements have been carried out in a typical line of Madrids underground. Fig. 1 shows the section of the tunnels,
Design and Test of a High QoS Radio Network
for CBTC Systems in Subway Tunnels
C. Cortés Alcalá* , Siyu Lin**, Ruisi He** C. Briso-Rodriguez*
*EUIT Telecomunicación. Universidad Politécnica de Madrid,
28031, Madrid Spain.
**State Key LAboratory of Rail Traffic Control and Safety.
Beijing Jiaotong University,100044, Beijing, China.
E-mail [email protected]
where a 2000m length track has been select with one station at the beging, one in the mid end, and the transmitters separated 400m in b stations were separated 400m one from each to propagation computation [5].
Fig.1. Typical tunnel of the test track. Arched shape w height in the middle and 9.6m width
A. Narrow band measurements
The test system for narrow band me composed of four 20dBm transmitters, eac 12dBi antennas, circular polarization. Ea pointing to one side of the tunnel. Inside antennas were located 4m over the floor and tunnel walls, as shownin Fig. 4.
The receiver was installed on a 60 m leng with two antennas, one in the front and one in The antennas of the train were 8dBi gain, li and each one have a low noise amplifier attac both antennas were combined with a power sp of the receiver. The receiver was a sp controlled with a PC computer and a special s was recorded from train tachometer.
The test system was able to take 100 m second. With this recording speed we have measurement each 1/2wavelength at 2.4 GHz train speed of 20 km/h.
Fig.2. Power along the track. Narrow band tra
-100 -90 -80 -70 -60 -50 -40 -30 -20 -10 0
TX 3
TX 2
TX1
[dBm]
ted for measuring ddle an one at the between them The other, according
with 6.1m maximum h
easurements was ch one with two
ch antenna was e the tunnel, the
d 25cm from the gth standard train, n the rear.
inear polarization ched. The output o plitters at the input prectum analyzer
software. Position measurements per
got a rate of one with a maximum
ansmission.
The first results, Fig. 2, are narr the coverage of the three transmitt coverage is very good except by a st train pass in front of the transmitter line of sight in between antennas of The rest of the time the signal le 2000m the track.
Basic statistics from point 300 to fucntions for fast fading and slow fa This parameters are simple and ea used for basic radio planning.
B. Broadband measurements The second group of measurem channel sounder installed in the pos antenna configuration. This sound modelling of the behaviour of p transmitter.
The sounder uses the frequ transmitting a flat 5 MHz spectrum a the response of the channel with a m Results are shown on Fig.3 wi bandwidth and signal power receive distinguish three propagation regio Non Line of Sight (NLOS) and far three regions have different behavio Detailed 6 ray delay and amplitud from measurements and is given on
Fig. 3. Measured 3D wideband received s bandwidth at 2.4
Interesting results are the long pr tunnel due to reflections in disco curves that spread the RMS delay to
[m]
TABLEI NARROW BAND STAT
Parameter
Average signal power Standard deviation
Fast fading Ri
Slow fading Lo
row band measurements of ters. We can see that the trong fading right when the r. On this case there are no the train and transmitters. evel is over -60dBm along
2300 and best fit statistical ading are shown in Table I. asy to measure and can be
ments was made using a sition of TX3 with the same
der was used for special propagation close to the uency domain technique
at 2400 MHz and recording mobile receiver.
ith 3D graph of distance, ed. On the graph we have n ons: Line of Sight (LOS),
line of sight (FLOS). This r and multipath conditions. e model has been obtained Table II.
ignal along 200m track. 5Mhz GHz.
opagation delays along the ontinuities like stations or
250ns in NLOS conditions. TISTICS
VALUE
This situation limits the coherence bandwidth from 100% (5Mhz) in LOS to 20% in NLOS region limiting communications on this situation.
Also far from the transmitter (FLOS) there is a small coherence bandwidth reduction that can reduce data bandwidth and increase error probability.
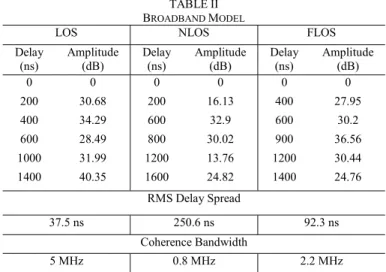
TABLEII BROADBAND MODEL
LOS NLOS FLOS Delay
(ns)
Amplitude (dB)
Delay (ns)
Amplitude (dB)
Delay (ns)
Amplitude (dB) 0 0 0 0 0 0 200 30.68 200 16.13 400 27.95 400 34.29 600 32.9 600 30.2 600 28.49 800 30.02 900 36.56 1000 31.99 1200 13.76 1200 30.44 1400 40.35 1600 24.82 1400 24.76
RMS Delay Spread
37.5 ns 250.6 ns 92.3 ns
Coherence Bandwidth
5 MHz 0.8 MHz 2.2 MHz
III. DATA TRANSMISSION
The second part of the test want to evaluate the effect of the radio coverage on the transmission network and the efficiency of the strong overlap of radio coverage. For this purpose measurements where made using data transmissions to verify the behavior of the channel in real conditions.
The test network has three base stations of the type of Fig. 4, each one with a PC computer and 2.4 GHz CDMA radio [7] transmitting a 250Kbps. The antennas used were the same of the other cases: two 12dBi directional antenna, and the transmission power was the same 20 dBm.
The train has two antennas and two radios, one in the front and one in the rear. Both radios are connected to a test computer as shown in Fig. 5. The test computer can collect data packets from the front or rear antenna. The characteristics of the radio and antennas are given in Tab. III.
Each base sends a data packets to the train every 150ms. The packets have the number of the base station, packet number and a time reference used for delay measurements with 1ms resolution. The three base stations use the same radio channel.
The measurement equipments were deployed in the locomotive cabin of one of the trains. The trains used were standard Madrid subway trains with four cars and 60m length.. The mobile station was polling each one of the three base stations every 150ms and was receiving the answer packet from the base stations through the on board radios. The PC receives the data packets and can identify the origin, packet lost and delay. There are no erroneous packets received by the computer because the radios can correct some errors in the packets or if it can´t be corrected then it is considered lost. Also the data transmission protocol is User Datagram Protocol UDP, so that it is not connection oriented and there are no acknowledge of the transmission.
Fig. 4.. Data test system with CDMA radio.
On a real network there will be only one main computer and it will be connected with the base stations through a local area network. This computer will control the trains in a region polling each train with a data packet transmitted through the fixed network and each train will answer when polled.
The polling packets are composed of the 1024 bits.
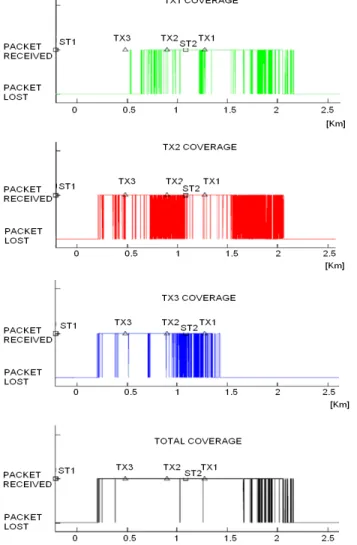
This test configuration was been used to make data transmissions trials along the track for each transmitter and general results are shown in Fig 6, for the three TX and for the complete network. These results has been correlated with the narrow band and broadband propagation modeling made in the tunnel, to obtain an specification of signal power and quality for a radio network for CBTC systems in tunnels.
PC
TRANSCEIVER ANTENNAS
PC
TRANSCEIVER ANTENNAS
Fig. 5. On board equipment and radio network.
Radio 2 Radio 1
PC
Radio 2 Radio 1
PC
TABLEIII
CHARACTERISTICS OF RADIO SYSTEM
Characteristic VALUE
Frequency 2,400-2,4835 GHz
Radio type DSSS (direct Sequence Spread Spectrum)
Transmission power 0-23dBm
Transmission bandwidth 4,6 MHz
Data rate 1Mbps
Rx sensitivity -90dBm @1Mbps
On Fig. 6 we can see that the radio coverage of each transmitter is up to 1.5 Km according to the sensitivity of the receiver that is -90dBm and signal power of measurements of Fig. 2.
The QoS for a single transmitter is poor with areas with very bad quality when the train pass in front of the transmitter, or in the region in between two transmitters
The statistics for each single transmitters are shown on Table IV, where we can see that the average packet lost is very high, from 14% to 27%. These results are unacceptable for CBTC systems.
Fig. 6 also shows the total coverage of the network. This graph represents the recovered packets along the complete test track. We can see on the figure and on Table V that the result of total coverage is fairly good with an average packet lost of 0.7% (Tab. V). These results are obtained because the train is collecting packets from the front and rear radios and as there is a strong overlap of the cells, there is always a good packet received.
The solution also solves the problem of NLOS propagation in front of the transmitters due to self shadowing of the train. Therefore the architecture of the system with three cells with strong signal overlap has result very reliable for data transmissions and are fully applicable to CBTC systems.
IV. CONCLUSION
The use of antenna solutions for subway tunnels at 2.4 Ghz has been widely study with accurate measurements of signal power, coherence bandwidth and data transmissions.
We have measured and characterized problems when the train pass close to the TX, the fast fading and multipath propagation close and far from the transmitter. With these results a network architecture with strong overlap of radio coverage overlap in between neighbour cells has been proposed and tested.
The network design adds diversity to the reception of the data on the trains and combined with simultaneous transmissions of the same packet from all TX (simulcast) can be used for CBTC system reaching efficiency of transmission higher than 99% of packets transmitted.
The solution can efficiently replace leaky feeder transmission networks with improvements in quality and specially in deployment cost.
ACKNOWLEDGMENT
We also would like to thank to the Madrid Subway Carrier (METRO) and to Dimetronic Invensys for their help and support to perform the propagation measurements.
REFERENCES
[1] “IEEE standard for Communications-Based Train Control (CBTC) performance and functional requirements,” 30. Dec. 1999.
[2] Alexander, R.P.; Mortlock, E.A.; Hamilton, B.A “Controlling and executing communications based train control (CBTC) installation & testing with a CBTC- ready vehicle.” Rail Conference, 2005. Proceedings of the 2005 ASME/IEEE Joint. 2005, pp.193 – 198
[3] Fitzmaurice, M. “Use of 2.4 GHz frequency band for Communications Based Train Control data communications systems”.Rail Conference, 2006. Proceedings of the 2006 IEEE/ASME Joint. 2006,pp:263 – 267 [4] R. J. Jakubowski, “Results of distributed antenna and leaky feeder
systems tests at 800 MHz in Washington D. C. metro system tunnels,” IEEE 44th Veh. Technol. Conf., vol. 2, 1994, pp. 1113–1116.
TABLEV
STATISTICS OF THE TOTAL COVERAGE
VALUE %
Transmitted packets 2.017 100
Received packets 2011 99.70
Error packets 0 0
Lost packets 6 0,30
Fig. 6. Packets received by the mobile station from each transmitter and the total coverage. Train with two radios one in the front and one in the rear.
TABLEIV
STATISTICS OF THE COVERAGE OF EACH TRANSMITTER
Packets
TX1 TX2 TX3
VALUE % VALUE % VALUE %
Transmitted 3601 100 1653 100 2038 100
Received 2623 72,8 1419 85,8 1643 78,9
[5] C. Briso-Rodriguez, J.M. Cruz and J.I. Alonso, “ Measurements and Modeling of Distributed Antenna Systems in Railway Tunnels,” Veh. Technol., IEEE Trans. vol. 56, Issue 5, Part 2, pp.2870 – 2879, Sept. 2007.
[6] M. Lienard and P. Degauque, “Propagation in wide tunnels at 2 GHz: A statistical analysis,” IEEE Trans. Veh. Technol., vol. 47, no. 4, pp. 1322– 1328, Nov. 1998.
[7] Yuan Cao; Ru Niu; Tianhua Xu; Tao Tang; Jiancheng Mu; “Wireless test platform of Communication Based Train Control (CBTC) system in urban mass transit. “Vehicular Electronics and Safety, 2007. ICVES. IEEE International Conference on 2007 pp:1 – 4.
![Fig. 3. Measured 3D wideband received s bandwidth at 2.4 Interesting results are the long pr tunnel due to reflections in disco curves that spread the RMS delay to[m]](https://thumb-us.123doks.com/thumbv2/123dok_es/6854164.838055/2.918.77.444.188.365/measured-wideband-received-bandwidth-interesting-results-reflections-spread.webp)