INEQUALITY CHANGES OVER TIME,
PRO-POOR GROWTH AND RE-RANKING:
LOCAL FOCUS AND GLOBAL ASSESSMENT.
Elena Bárcena Martín;
Luis José Imedio Olmedo;
Encarnación M. Parrado
Gallardo
Universidad de Málaga
Introduction
In the literature there are proposals of
indices of distributional change that may
in fact be considered as indices
measuring the degree of income mobility.
Based on entropy measures (Cowell, 1985)
Based on the Gini index (Silber, 1995)
Based on the generalized Gini class of
Introduction
Analysis of inequality changes over time
does not provide information about the
situation of especific individuals
mobility?
A change in inequality can mask different
sittuations affecting different parts of the
distribution local focus vs. Global
assesment
6600tán28a5660 6600tán28a5660 6600tán29a5660 6600tán28a5660
6600tán28a5660
6600tán29a5660 LU
B2007 B2010 6600tán28a5660 6600tán28a5660 6600tán29a5660
6600tán28a5660 6600tán28a5660 6600tán29a5660
IT
Introduction
We propose the decomposition of a wider family of
inequality measures (Imedio et al. 2013) that contains as
particular cases the generalized Gini class of indices, the
indices of Aaberge (2000) and the Bonferroni index, into
two components:
one summarizing mobility in the form of reranking and
one summarizing progressivity in income growth (pro-poor
rather than pro-rich)
Then we analyze the change in overall inequality taking
into account the different situations that take place along
the income distribution to reveal the extent to which
each part of the income distribution contributes to the
global measure of inequality, reranking and pro-poor
Measuring inequality: the
class of inequality measures
Bonferroni curve
Bonferroni index
Index of
the family:
.
Bonferroni (s=1 and t=1)
Gini (s=2 and t=1),
Generalized Gini coefficients (s=2)
and indexes of the family of Aaberge (t=1),
Weights
Measuring inequality: the
class of inequality measures
As a weighted sum of inequality measures with
“local” focus, covering the whole distribution,
from the bottom to the top
6600tán28a5660 6600tán29a5660 6600tán1a5660 6600tán2a5660 6600tán3a5660 6600tán4a5660
Inequality change
Change in I(s,t) between some base
year (0) and final year (1)
=
Apply this expresssion to the Bonferroni
index and its decomposition:
Inequality change
Decomposition of the change in
inequality in the progressivity and
reranking components. 2 steps:
1. Starting from the distribution of
income in the year 0 the individuals keep
the rank they had in year 0 but they are
now given their income in year 1. Let be
the concentration curve
2. Now we take into account the
reranking between year 0 and year 1,
final year, by rearranging the individuals
from the poorest to the richest in the
Inequality change
6600tán28a5660 6600tán28a5660 6600tán29a5660 6600tán28a5660
6600tán28a5660 6600tán29a5660
IT
Inequality change
In short we may define P(s,t) and R(s,t)
as:
It summarizes the progressivity or pro-poor
income growth across the base year income
distribution
Inequality change
Proposition 2
. The change in inequality
measured through inequality measure
belonging to the β family can be
decomposed in two terms, progressivity
and reranking, (for s=2, it is the Jenkins
and Van kerm, 2006, expression):
6600tán28a5660 6600tán28a5660 6600tán29a5660
LU
Inequality change
Proposition 3.
The change in the Bonferroni
index can be decomposed into two terms:
=
We can identify the part of the distribution in
which inequality change has more effect and
devise if the main cause was the reranking or
the progressivity income growth.
the arithmetic mean of the effect of the
reranking when the weights give more
importance to different parts of the
Empirical illustration
Source: EU_SILC
11 European countries
Period 2007-2010
two income sources: employee income and
self-employment income
Aim: to analyze the different distributive impact of
the crisis on them despite the conclusion we can
derive from global measures of inequality change.
Those incomes are expressed in constant prices of
2005.
Trimming: top 1%
0and the bottom 1%
0excluded.
Sample: 13,737 individuals for the employee income
and 2,278 individuals for self-employment income.
Country B2007 B2010 B2010- B2007 Reranking Progresivity
AT 545 502 -43 158 201
BE 415 395 -19 87 107
DK 512 500 -12 123 135
ES 453 462 8 142 134
FI 538 529 -9 130 139
IT 435 473 38 108 70
LU 515 509 -6 75 81
NL 566 543 -24 82 106
NO 523 520 -3 130 132
PT 471 496 25 124 99
UK 523 532 9 153 144
Table 2. Changes in income inequality of
employee
incomes
measured through the Bonferroni index.
Reranking and Progressivity.
Empirical illustration
Empirical illustration
Country B2007 B2010 B2010- B2007 Reranking Progresivity
AT 658 584 -74 197 271
BE 409 544 135 325 191
DK 905 891 -14 42 56
ES 482 502 20 313 293
FI 763 758 -5 127 132
IT 584 586 2 220 218
LU 629 701 72 140 68
NL 749 699 -50 115 165
NO 688 683 -4 104 108
PT 597 590 -7 258 265
UK 667 649 -18 513 531
Table 3. Changes in income inequality of
self-empoyment incomes
measured through the Bonferroni
index. Reranking and Progressivity.
Country Bonferroni I15 I24 I33 I42 I51 AT Change inequality -43 -45 -53 -47 -39 -33 Progresivity 201 338 263 186 131 89
Reranking 158 293 210 139 91 56
BE Change inequality -19 -52 -32 -13 -1 3 Progresivity 107 226 151 88 47 21
Reranking 87 174 118 75 46 24
DK Change inequality -12 -14 -18 -16 -10 -4 Progresivity 135 284 180 113 66 33
Reranking 123 270 162 98 56 30
ES Change inequality 8 18 13 7 4 0 Progresivity 134 252 172 115 80 50
Reranking 142 270 185 122 84 50
FI Change inequality -9 -5 -8 -11 -11 -10 Progresivity 139 224 190 139 92 49
Reranking 130 219 181 128 81 39
IT Change inequality 38 56 54 41 26 12 Progresivity 70 160 88 50 32 21
Reranking 108 216 143 91 58 33
LU Change inequality -6 18 12 -6 -24 -30 Progresivity 81 125 87 75 67 52
Reranking 75 142 99 69 43 22
NL Change inequality -24 -22 -35 -31 -21 -11 Progresivity 106 176 147 103 66 38
Reranking 82 154 112 72 45 27
NO Change inequality -3 10 2 -6 -10 -9 Progresivity 132 191 185 143 94 51
Reranking 130 200 187 136 84 41
PT Change inequality 25 38 26 21 22 18 Progresivity 99 207 140 83 44 19
Reranking 124 245 167 105 65 37
UK Change inequality 9 -15 0 13 23 26 Progresivity 144 230 177 138 106 68
Reranking 153 215 176 152 128 94
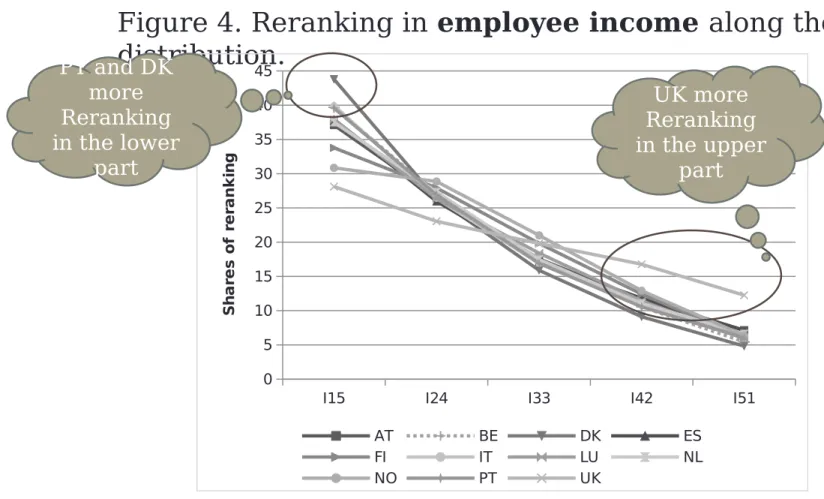
Empirical illustration: local focus
change in
inequality was
mostly
concentrated in
the lower part of
the distribution…
Exceptions
Empirical illustration: local
focus
Figure 4. Reranking in employee income along the
distribution.
I15 I24 I33 I42 I51 0 5 10 15 20 25 30 35 40 45
AT BE DK ES FI IT LU NL NO PT UK
S h a re s o f re ra n k in g
PT and DK
more
Reranking
in the lower
part
UK more
Reranking
in the upper
Country Bonferroni I15 I24 I33 I42 I51 AT Change inequality -74 -63 -89 -88 -75 -56 Progresivity 271 496 320 244 179 116
Reranking 197 432 231 156 103 60
BE Change inequality 135 136 171 156 127 84 Progresivity 191 367 241 143 118 83
Reranking 325 503 412 299 245 168
DK Change inequality -14 0 -1 -4 -17 -46 Progresivity 56 6 14 38 83 137
Reranking 42 6 13 34 67 91
ES Change inequality 20 -7 15 25 32 36 Progresivity 293 462 360 284 221 136
Reranking 313 455 375 309 253 173
FI Change inequality -5 -2 -3 -2 -5 -13 Progresivity 132 74 129 157 165 134
Reranking 127 71 126 155 160 121
IT Change inequality 2 10 6 0 -4 -2 Progresivity 218 344 269 212 162 100
Reranking 220 355 275 212 158 99
LU Change inequality 72 76 76 78 77 53 Progresivity 68 151 87 54 34 15
Reranking 140 228 164 132 110 68
NL Change inequality -50 -22 -45 -63 -67 -53 Progresivity 165 153 205 197 162 108
Reranking 115 131 159 134 95 56
NO Change inequality -4 2 -6 -8 -6 -4 Progresivity 108 99 117 120 116 88
Reranking 104 100 112 113 110 84
PT Change inequality -7 9 1 -12 -21 -15 Progresivity 265 369 326 254 206 173
Reranking 258 378 327 242 185 158
UK Change inequality -18 -32 -45 -36 -3 28 Progresivity 531 901 643 517 383 212
Reranking 513 870 598 481 379 239
Empirical illustration: local focus
self-employment
income
change in
inequality was
mostly
concentrated in
the upper part of
the distribution…
Exceptions
Progresivity and
reranking
concentrated in
the lower part of
the distribution…
Figure 5. Reranking in self-employment income along
the distribution.
I15 I24 I33 I42 I51 0 5 10 15 20 25 30 35 40 45
AT BE DK ES FI IT LU NL NO PT UK
S h a re s o f re ra n k in g