403
Analysis of infrastructure funds as an alternative tool for the financing of
public-private partnerships
Análisis de los fondos de infraestructura como herramienta alternativa para la financiación de las
asociaciones público-privadas
Antonio Lara-Galera
(Main and Corresponding Author)Civil Engineering and Construction Department, Technical University of Madrid Profesor Aranguren, 3, 28040, Madrid (Spain)
Antonio Sánchez-Soliño
Civil Engineering and Construction Department, Technical University of Madrid Profesor Aranguren, 3, 28040, Madrid (Spain)
María Gómez-Linacero
Civil Engineering and Construction Department, Technical University of Madrid Profesor Aranguren, 3, 28040, Madrid (Spain)
[email protected] Manuscript Code: 760
Date of Acceptance/Reception: 01.12.2017/22.03.2016 DOI: 10.7764/RDLC.16.3.403
Abstract
The impact of the financial crisis has reduced the scope for public investment in infrastructure within government budgets. Governments face a situation where finding new sources of funding becomes essential. In the present paper is shown a vision of infrastructure funding, where new ways of financing are explained and analyzed, focusing on the emergence of the so-called infrastructure funds. The paper provides an insight on the impact of the participation of infrastructure funds in the financing of projects. The main result is a quantitative measure of the cost of using this type of financing instead of traditional debt.
Key words: Infrastructure, funds, financing, public investment, public-private partnerships
Resumen
El impacto de la crisis financiera ha reducido el alcance de las inversiones públicas en infraestructuras por razones presupuestarias. Los gobiernos hacen frente a una situación en la que encontrar nuevas fuentes de financiación es de vital importancia. El presente artículo ofrece una visión de la financiación de infraestructuras, explicando y analizando los nuevos sistemas de financiación y, en especial, los fondos de infraestructuras. El artículo muestra el impacto de la participación de los fondos de infraestructuras en la financiación del proyecto. El resultado principal es la cuantificación del coste de esta financiación con relación al de la deuda convencional.
Palabras clave: Infraestructura, fondos, financiación, inversión pública, partenariado público-privado.
Introduction
Given the difficult situation of economies around the world, faced with high levels of public debt on balance sheets, states cannot tackle the needs of additional infrastructure through public budgets. In addition, a global infrastructure deficit is currently being faced as nations around the world have struggled to come to grips with the growing demand placed on their infrastructure assets. In this context, infrastructure is generally understood as those assets that are considered vital for economic and social development.
404 The need for investment in infrastructure in coming years remains considerable. In a recent report the OECD estimated the total sum required worldwide at USD 50-70 trillion over the next 20 years, including USD 40 trillion for the OECD countries (OCDE, 2012). This would cover both renewing existing infrastructure and building new facilities. It works out to about USD 2 trillion a year on average in OECD countries. Although public budgets will help to finance part of this enormous expenditure, an increasing share will have to come from private investors (J. P. Morgan Asset Management, 2012).
In addition to this immense demand, infrastructure generates relatively predictable, growing and low volatility cash flows that exhibit little correlation to equity and fixed income returns (Inderst, 2010). Infrastructure assets share certain features closely related to those of other assets including real estate, fixed income, and private equity. For instance, investing in a mature, government regulated utility is analogous to a fixed income investment with the advantage of having a certain degree of inflation protection (RREEF, 2007), and both real estate and infrastructure have underlying tangible assets with long lives, cash flows that provide long duration, and generate returns that are sensitive to real returns. But nevertheless, investors have also to recognize the differences between infrastructure and other assets such as bonds, equities, private equity, and real estate to appreciate the unique characteristics associated with infrastructure investments, stressing these differences not only to stocks and corporate bonds but also to private equity (e.g. longer time horizon, higher yields) and to direct real estate. Furthermore, infrastructure investments have shown favorable risk-return and diversification characteristics against other asset classes. It is the recognition of these differences that separate infrastructure as a distinct investment class with its own profile. Its distinct profile enables it to provide greater diversification benefits to an investor compared to traditional types of investment. Thus, it is important to underline its certain unique investment characteristics which clearly distinguish this sector from other investment asset classes (New-ell & Peng, 2008), such as:
Steady and predictable cash flows over time.
Long Life Asset, where revenues usually are linked to an update of rates via Consumer Price Index (CPI) regulated in the contract or via regulated return framework. For that reason, these are assets that attract conservative nature investors such as investment funds that see them as an alternative to long term fixed income since they cover the inflation risk.
High Barriers to Entry. Investing in infrastructure is virtually inaccessible to individuals. It is a very capital-intensive sector which generates therefore a great barrier against other possible competitors.
Broadly comprehensive operating margins.
Inelastic Demand. The consumer demand profile should be relatively inelastic, predictable, and grow over time.
Monopoly or Quasi-Monopoly Market Position, due to an ongoing regulatory relationship. They have an additional assurance as they constitute essential assets for the economic development of a country.
Insensitive to Changes in Technology. Infrastructures are long-term assets that have little risk of technological obso-lescence.
Description
Routes to market for infrastructure financing
As investors assess the types of infrastructure assets that are available in addition to geographic preferences, they also have a choice as to which routes to market they can utilize to participate in infrastructure investments. There is an increasing, and sometimes confusing, variety of investment vehicles available for infrastructure assets. Mainly direct and indirect investments may be distinguished (Beeferman, 2008). Furthermore, Standard & Poor’s (2008), broadly clas-sify the indirect opportunities into unlisted and listed infrastructure funds.
405 One of the main significant risks in direct infrastructure investment is regulatory/political risk (Bitsch, Buchner & Kaserer, 2010) because investors have limited influence on the outcome of the political process. This risk is a key issue, since the stability of cash flows is only guaranteed if no change occurs in legal and regulatory conditions pertaining to a project. Focusing firstly on listed infrastructure funds, they involve publicly traded securities in well-established stock market indices. Listed funds are closely associated with capital markets; thus, their values depend less on the features of their underlying instruments and more of the nature of the stock market, which is volatile by nature.
Unlisted infrastructure funds involve pooled capital arrangements through which investments are made in a variety of infrastructure assets or operating companies. Each fund has a different strategy (sector, maturity level, geographies), thereby investors can obtain the required diversification by hiring different managers. Liquidity of unlisted funds is much reduced compared to that of listed funds. Furthermore, unlisted infrastructure funds have direct control over the infra-structure asset; however, listed do not possess any kind of control over the asset management activities.
Features of infrastructure funds
Infrastructure funds are investment vehicles for investing in an infrastructure assets portfolio. These funds have become popular in Australia as a result of Macquarie Group partnering with various government entities. The fund model gained acceptance in Europe and North America during the early 2000s in response to the need for an alternative asset class after the financial crisis of the early 2000s, and due to the availability of cheap debt (Inderst, 2009). In addition, the model of these pioneer infrastructure funds was subsequently adopted by numerous investments banks and financial institutions around the world that have noted the rise of the Macquarie model and joined the rush for infrastructure assets. The progress was particularly rapid in Europe.
It becomes clear that the growth of the infrastructure funds during the years prior to the crisis was driven by the high liquidity of the market. Unfortunately, this prosperous overall picture hit trouble in 2008 because of the financial crisis. Debt that was once readily available disappeared almost overnight, bond and equity markets being in free fall and therefore fund-raising by infrastructures fund managers essentially ceased. It is not until early 2010, that funds were re-entering into the market, launching multiple new infrastructure funds, emerging a sector less reliant on complex lever-age structures for its returns, and more focused on core infrastructures assets that are able to produce the stability of yield that should attract the investment of limited partnerships. Currently, the largest infrastructure funds are focused mainly on North America, Canada and Europe (Della Croce, 2012).
How does an infrastructure fund work?
Infrastructure funds come in a rich variety. There are generalist funds but mainly funds are specialized by three key factors: assets’ risk, geographical or economic region (OECD, emerging countries) and activity sector (utilities, transpor-tation, airports, energy…). Even though funds are structured differently, they are all based on a very similar scheme of organization. This is the well-known Limited Partnerships like those used on the private-equity industry. The scheme used by the majority of infrastructure funds is an investment vehicle with a fund manager and several Limited Partners (investors, who have limited liability and are not involved in the day-to-day operations).
The fund manager (called General Partner) collects money from the Limited Partners and invests it in portfolio compa-nies on their behalf over a specified period. In addition, the General Partner (GP) charges a range of fees due to the administration and management, the called base fee, which is often a percentage of the infrastructure fund’s enterprise value’ and they also charge the performance fee as a percentage of the profits obtained, which is often 15 to 20 per cent of the amount by which the fund outperforms a benchmark index (Lawrence & Stapledon, 2008). The GPs are controlled by the initial investors and the managers board members with high experience in the infrastructure sector. Initial investors are often banks and large companies that often commit an initial contribution of capital to invest in the Fund.
On the other hand, the Limited Partners receive the capital gains and tax benefits, so that, the invested capital is re-turned to the investor. Limited Partners do not have power of decision or control, or any significant influence in the financial decision-making; they only possess economic rights based on their commitment to the Fund. The terms, struc-tures, rates, supplements and other issues governing the contractual relationship between the General Partner and the Limited Partners are set out in the so-called Letter of Agreement.
406 institutions invest in infrastructure are basically: long duration of such investments; protection against the volatility and against inflation and diversification.
In another vein, although Sovereign Wealth Funds (SWFs) have less available capital compared to the other institutional investors, the interest of sovereign wealth funds for infrastructure funds has also escalated recently. They are increas-ingly being approached for investment in infrastructure funds particularly in emerging and developing economies. Fam-ily offices are great famFam-ily assets with significant investment capacity which often also deposit their capital in these funds.
The Investment Strategy
The investment strategy may depend upon many variables and it could be very diverse. However, as in any investment, the determining factor will be the risk-return binomial. This risk-return profile of the infrastructure asset is directly linked to three main bases: asset risk, geographical region and activity sector.
Firstly, we should outline that most of the infrastructure funds are traditionally focused on developed countries, due to different reasons: institutional and legal stability, macroeconomic security, economic potential of citizens and Admin-istrations, quality of the regulatory framework, political support to the projects, management capacity, local actors ex-perience, etc. Thus, much of the capital currently being committed is directed to the European and North American markets, even for those funds that have global investment mandates.
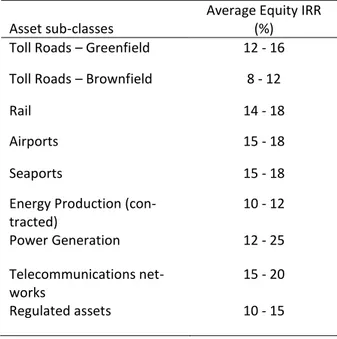
Secondly, infrastructure funds may focus on a wide variety of industrial sectors. These infrastructure subsectors are very heterogeneous and thus each one has a specific risk-return spectrum. In Table 1 the different IRR expected by funds is shown on the basis of the main infrastructure sectors.
Table 1. Asset Sub-classes. Source: J.P. Morgan Asset Management (2012).
Asset sub-classes
Average Equity IRR (%) Toll Roads – Greenfield 12 - 16 Toll Roads – Brownfield 8 - 12
Rail 14 - 18
Airports 15 - 18
Seaports 15 - 18
Energy Production (con-tracted)
10 - 12
Power Generation 12 - 25
Telecommunications net-works
15 - 20
Regulated assets 10 - 15
Finally, the third investment strategy topic is the maturity level of the infrastructure asset. It is very common to catego-rize infrastructure investment risk focused on the phases of the investment life cycles involved. Greenfield refers to early stage investment assets in higher risk locations or where there is no established demand pattern upon which to rely (Martin, 2010). Thus, Greenfield assets often exhibit higher risk but also greater expected return. Meanwhile, Brownfield investments refer to late stages investments. They involve assets that are considered mature and proven, also associated to infrastructure assets with consistent and predictable cash flows.
Case study
407 the need of the infrastructure fund input to achieve the mentioned project viability. For that purpose, we use a simula-tion method, where different levels of the infrastructure fund`s participasimula-tion are applied to the expected cash flows of a real infrastructure project.
The surrounding metropolitan areas of an important European city are not well connected to the city center as well as with the main radial highways of the country. The traffic that is generated by those areas is substantial; therefore, traffic jams are constantly generated. So, to improve traffic flows, the Government of the region in connection with the central government has planned a project which consists on the construction and exploitation of a road belt to connect those population areas between them and with the main motorways of the neighboring regions. The project has the following features:
Construction period = 2 years. Operation period = 20 years. Length: 60 kilometers. Two lanes per roadway. Investment = 324 million euros. Payment system = Shadow toll.
The Government will pay the concessionaire a fee which depends on both the number of vehicles and the kind of it.
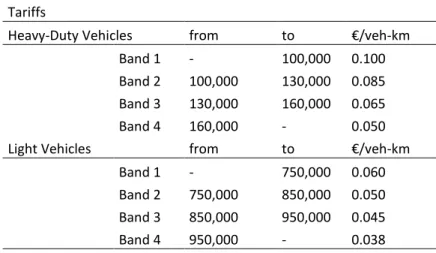
The mentioned project consists on a public private partnership under a concession scheme for a period of 22 years, 2 of them for the construction phase and the rest related to the operational phase. Shadow toll payments are defined as payments made periodically by the awarding administration to the concessionaire based on the number of vehicles using a road; these payments will also increase over time by introducing an indexation formula. Moreover, in this project the payments are based on a traffic band system, thus the volume of traffic in the toll road area will be rated separately based on the type of vehicle and according to traffic bands. The traffic band system is detailed below in Table 2.
Table 2. Traffic bands system per kind of vehicle. Source: Concessionaire offer.
Tariffs
Heavy-Duty Vehicles from to €/veh-km
Band 1 - 100,000 0.100
Band 2 100,000 130,000 0.085 Band 3 130,000 160,000 0.065
Band 4 160,000 - 0.050
Light Vehicles from to €/veh-km
Band 1 - 750,000 0.060
Band 2 750,000 850,000 0.050 Band 3 850,000 950,000 0.045
Band 4 950,000 - 0.038
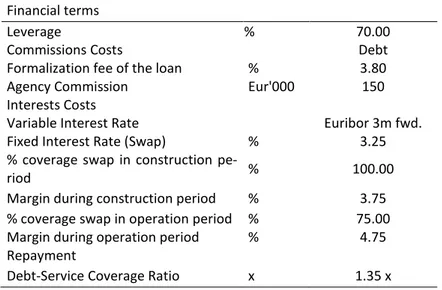
After the 22 years of the concession period, the motorway will be reversed to the Administration. The total infrature investment rises to 324 million euro. For this purpose, the project has a solid and effective support funding struc-ture which is constituted by capital and Senior debt. On the other hand, the financial clauses assumed for the develop-ment of the project are described on Table 3.
408
Table 3. Financial clauses of the project. Source: Concessionaire offer.
Financial terms
Leverage % 70.00
Commissions Costs Debt
Formalization fee of the loan % 3.80
Agency Commission Eur'000 150
Interests Costs
Variable Interest Rate Euribor 3m fwd.
Fixed Interest Rate (Swap) % 3.25
% coverage swap in construction
pe-riod % 100.00
Margin during construction period % 3.75 % coverage swap in operation period % 75.00
Margin during operation period % 4.75
Repayment
Debt-Service Coverage Ratio x 1.35 x
Methodology
As previously mentioned the effect of the infrastructure fund entry on an infrastructure project will be analyzed with the present case study. The capital injection of the fund will be necessary, if we want to make feasible the execution of the project. The reason of the fund entry comes from the initial financial structure which Banks are not ready to assume in the current economic framework. In that regard, it is a key point to detail the financial structure that will be consid-ered for all the situations described in the case. Initially, the motorway project funding is composed by: own resources
(share capita) and Senior Debt. However, due to the fund acquisition, this financial structure will be also composed by
infrastructure fund equity, thus: Own resources+ Senior Debt+ Infrastructure fund´s equity.
On the other hand, as the aim of this case study is to analyze the effect of the capital´s fund participation, the conces-sionaire own resources percentage will remain constant at 30%, i.e., “Share Capital=30%”. Under these assumptions the leverage is going to be gradually reduced a 5% in each simulation, and consequently the percentage of participation of the fund will increase accordingly. The present paper will only show the results of the base case and one of the most representative cases (Leverage=50%), as a result of the simulation model developed. Other assumptions used during the simulation are the following:
Firstly, a shareholder’s internal rate of return (IRR) of 11% (given by the offer submitted by the concessionaire) will be considered.
Secondly, it is important to highlight that tariffs are regulated; private operators are not free to fix or adjust tariffs on their own volition. Tariff is fixed in advance and adjustable over time only in accordance with predetermined contractual terms. In this simulation we are going to change freely the tariffs, but we should point that only for academically purposes. Particularly, in the present project the initial tariffs considered by the concessionaire in the offer are displayed above (Table 2). Then we will analyze how tariffs would be affected and consequently the cost of the project as a direct effect of the fund´s entry.
Thirdly, the initial leverage level of the project will be 70%, as it is shown in the financial terms detailed in Table 3 and on the base case in Table 4.
Due to the lack of financial viability of the project because of the high leverage that banks have to support, we consider the possibility of an infrastructure fund participating in the project. In this case, we will vary this volume of the fund`s capital contribution from 5% to 25% of the total financing.
409 country, which involves a mature economy on a long-term basis, so the political risks may be rated at a lower level than in emerging countries. Thereby we will assume that the level of the IRR for the infrastructure fund is 13%.
Results
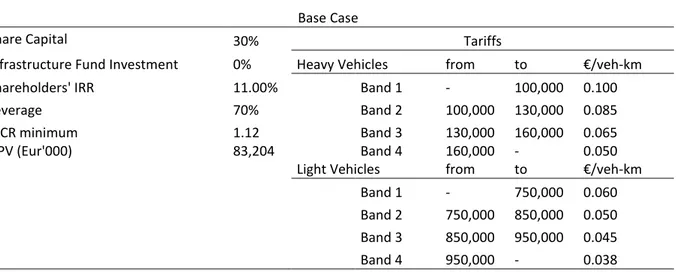
The most significant results obtained in the simulation process are shown on Tables 4 and 5. Table 4 shows the results obtained for the base case with a fund participation of 0%, while Table 5 shows the case which better reflects the reality of using the infrastructure fund service, which corresponds to a fund contribution of 20%.
Table 4. Base case. Leverage = 70%. Source: Authors.
Base Case
Share Capital 30% Tariffs
Infrastructure Fund Investment 0% Heavy Vehicles from to €/veh-km
Shareholders' IRR 11.00% Band 1 - 100,000 0.100
Leverage 70% Band 2 100,000 130,000 0.085
LLCR minimum 1.12 Band 3 130,000 160,000 0.065
NPV (Eur'000) 83,204 Band 4 160,000 - 0.050
Light Vehicles from to €/veh-km
Band 1 - 750,000 0.060
Band 2 750,000 850,000 0.050 Band 3 850,000 950,000 0.045
Band 4 950,000 - 0.038
Table 5. Case A-4. Leverage = 50%. Source: Authors.
Case A-4
Share Capital 30% Tariffs
Infrastructure Fund Investment 20% Heavy Vehicles from to €/veh-km
Fund’s IRR 13% Band 1 0 100,000 0.1016
Leverage 50% Band 2 100,000 130,000 0.0864
LLCR minimum 1.23 Band 3 130,000 160,000 0.0661
NPV (Eur'000) 117,311 Band 4 160,000 0.0508
Tariffs Growth Light Vehicles from to €/veh-km
1.62% Band 1 0 750,000 0.0610
Band 2 750,000 850,000 0.0508 Band 3 850,000 950,000 0.0457
Band 4 950,000 0.0386
Discussion
410
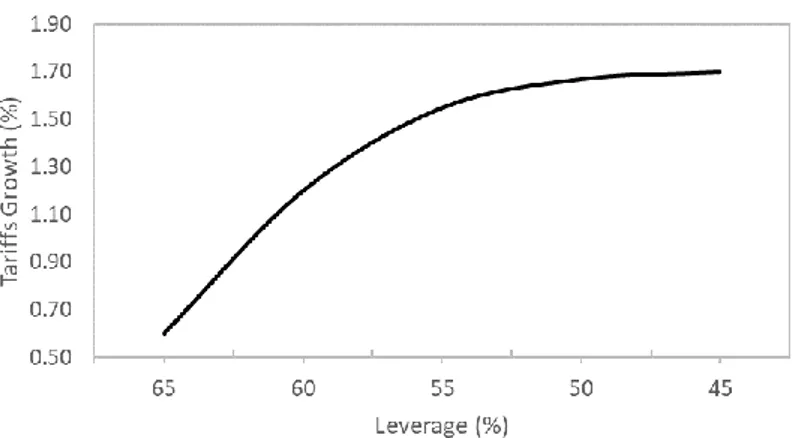
Figure 1. Tariffs growth with the infrastructure fund participation. Source: Authors.
In addition, it is also important to analyze the effect of the fund participation in the main financial ratios. We will focus on the loan life coverage ratio (LLCR) as it is broadly used by banks mainly for project finance loan life cover ratio. This ratio reflects the ability of the project to cover debt service over the entire period of loan. The LLCR computes the present value of cash flows over the debt tenor at the interest rate on debt as the numerator of the ratio:
LLCR= NPV of Available Cash flow for Debt Service over the Debt Period / Total Debt
The initial loan life coverage ratio was 1.12 as shown in the base case. However, as the effect of the fund entry, the leverage decrease and the LLCR ratio follows an upward trend, as it is described in the figure below. The reason is that the cash flow available for debt service over loan life increases as the leverage decreases. Thus, the results of the analysis make sense because the amount of debt is steadily decreasing, while tariffs grow as an effect of the fund entry.
Figure 2. LLCR evolution. Source: Authors.
To sum up, as the participation of the infrastructure fund in the financial structure is larger the tariffs will be higher. So, the rise in capital injection of the infrastructure fund will mean an increase of the tariff rates. From the point of view of the public administration, an optimal point will be reached which would make the project feasible without imposing high tariffs that the Administration could not assume in any case.
On the one hand, the presence of infrastructure funds investment is required because of the financial restriction im-posed by banks because of current regulatory requirements. Thereby, the fund entry is necessary to make the project feasible. However, as it has been demonstrated, it would have consequently the increase of the total cost of the project, which results in a price increase of the contractual tariffs and thus subsequently the Administration cost will also rise. So, it is therefore essential to find a balance between all agents involved in infrastructure projects because of the current economic and financial framework situation which demands new agents in infrastructure funding.
Conclusion
411 administrations of recent years and the crisis effects. By contrast, infrastructure investment needs are already significant and will continue to rise in coming years. Thus, given stretched public finances in OECD countries, many governments have decided to encourage private investment in infrastructure to bridge the infrastructure financing gap (Carbonara et al., 2014). Thereby, new sources of capital will be required to meet the financing requirements for new and replacement infrastructure.
A further consequence of this economic environment is the appearance of infrastructure funds as an alternative source of infrastructure funding. As we have concluded with the case study of the present paper, the presence of an infrastruc-ture fund increases moderately the cost of the project. Therefore, the Government shall pay higher tariffs to the con-cessionaire, which will indirectly affect the citizens throughout future taxes. However, more equity drives to lower risk for lenders to the project, which could in turn counterbalance the final financial cost of the project. So, every case must be carefully studied.
Nevertheless, if an infrastructure fund invests in this type of infrastructure projects, there will be two additional positive effects:
The Government will minimize its exposure to project risks due the introduction of the infrastructure fund, whose management team would analyze the project viability.
The investment fund will control that the project is executed according to the standards imposed by the Govern-ment. Moreover, the infrastructure fund will have an interest in monitoring that the operator provides the service properly.
In this way, infrastructure funds are erected as basic instruments for infrastructure projects funding, and enable to undertake infrastructure projects that would be difficult to carry out without their capital injection.
Finally, it should be noted as the main limitation of this study that the financial cost of the project may make it unviable. Higher tariffs can have a significant impact on the demand of the project that have to be valued.
References
Beeferman, W.L. (2008). Pension Fund Investment in Infrastructure: A Resource Paper. Occasional Paper Series, 3, 1-78.
Bitsch, F., Buchner, A., & Kaserer, C. (2010). Risk, return and cash flow characteristics of infrastructure fund investments. EIB Research Report, 15(1), 106-136. Luxembourg: European Investment Bank Papers.
Carbonara, N., Costantino, N. & Pellegrino, R. (2014). Concession period for PPPs: A win–win model for a fair risk sharing. International Journal of Project Management 32, 1223-1232.
Della Croce, R. (2012). Trends in Large Pension Fund Investment in Infrastructure”, OECD Working Papers on Finance, Insurance and Private Pensions, No.29, OECD Publishing.
Inderst, G. (2009). Pension Fund Investment in Infrastructure. OECD publishing, OECD Working Papers on Insurance and Private Pensions No. 32.
Inderst, G. (2010). Infrastructure as an asset class. EIB Papers, 15(1), 70-104.
J.P. Morgan Asset Management (2012). Guide to infrastructure investing. Af2i working group in partnership with J.P. Morgan Asset Management.
Lawrence, M. & Stapledon, G.P. (2008). Infrastructure Funds: Creative Use of Corporate Structure and Law – But in Whose Interests? University of Melbourne Legal Studies Research Paper No. 314. University of Melbourne, Melbourne Australia.
Martin, G. (2010). The long horizon benefits of traditional and new real assets in the institutional portfolio. The Journal of Alternative Investments, (13:1), 157-200.
Newell, G. & Peng, H.W. (2008). The Role of U.S. Infrastructure in Investment Portfolios. Journal of Real Estate Portfolio Management, 14(1), 21-34.
OCDE (2012). Strategic transport infrastructure needs to 2030. OCDE Publishing. Feb 27, 2012 - 248 pages.
RREEF (2007). Performance characteristics of infrastructure investments. RREEF Research. London, August.
Sharma, R. (2012). Infrastructure: an emerging asset class for institutional investors. The Societal Function of Investment Asset Classes: Implications for Responsible Investment Conference, October 2012.