UNIVERSIDAD POLITÉCNICA DE MADRID
ESCUELA TÉCNICA SUPERIOR DE INGENIEROS DE
CAMINOS, CANALES Y PUERTOS
ACCEPTABLE LIFE SAFETY RISKS ASSOCIATED WITH
THE EFFECTS OF GAS EXPLOSIONS ON REINFORCED
CONCRETE STRUCTURES
TESIS DOCTORAL
Ramon Hingorani
Diplom Ingenieur / Master of Science, RWTH Aachen, Alemania
DOCTORADO EN INGENIERÍA DE ESTRUCTURAS, CIMENTACIONES Y
MATERIALES
ESCUELA TÉCNICA SUPERIOR DE INGENIEROS DE
CAMINOS, CANALES Y PUERTOS
ACCEPTABLE LIFE SAFETY RISKS ASSOCIATED WITH
THE EFFECTS OF GAS EXPLOSIONS ON REINFORCED
CONCRETE STRUCTURES
TESIS DOCTORAL
Autor
Ramon Hingorani
Diplom Ingenieur / Master of Science, RWTH Aachen, Alemania
Directores
Peter TANNER
Doctor Ingeniero de Caminos, Canales y Puertos
Carlos ZANUY SÁNCHEZ
Doctor Ingeniero de Caminos, Canales y Puertos
TESIS DOCTORAL
ACCEPTABLE LIFE SAFETY RISKS ASSOCIATED WITH
THE EFFECTS OF GAS EXPLOSIONS ON REINFORCED
CONCRETE STRUCTURES
Ramon Hingorani
Diplom Ingenieur / Master of Science, RWTH Aachen, Alemania
Tribunal nombrado por el Magnífico y Excelentísimo Sr. Rector de la Universidad Politécnica de Madrid, el día de de 2017 para juzgar la Tesis Doctoral arriba citada, compuesto de la siguiente manera:
Presidente/a:
Vocal:
Vocal:
Vocal:
Vocal Secretario/a:
Acuerda otorgarle la calificación de:
El/La Presidente/a El/La Secretario/a Los Vocales
Acknowledgements
I wish to express my gratitude to the following persons :
- To Dr. Peter Tanner, the “spiritual father” of this work, who encouraged me to undertake and complete this mission and to whom I owe large part of my knowledge in the field of risk, relia-bility and forensic analysis of structures, acquired during the last twelve years of constructive and fruitful collaboration at the IETcc-CSIC. Peter, thanks a lot for your excellent professional guidance in an always personally pleasant and respectful atmosphere.
- To Dr. Carlos Zanuy Sánchez, from whom I received insightful support and advice during the elaboration of this thesis, particularly in the field of dynamic analysis of explosion-exposed structures. Carlos, special thanks for your positive attitude and the likeable treatment during our numerous and productive meetings held at the ETS-ICCP.
- To Prof. Ton Vrouwenvelder and Dr. Max Hendriks, who provided me with valuable input during my three months-stay at TU Delft, a very positive experience which added significant value to this thesis. I am deeply grateful for the kind attention received and for the time and the effort spent on me and my work.
- To my colleagues Ana, Carlos, Miguel and Filipe among others, for the outstanding company dur-ing the years at the IETcc-CSIC. It was a great pleasure for me to meet you people and to share with you many enriching and pleasant moments.
- Last, but not least, to Cristina, for her unconditional mental support and encouragement to bring this story to an end. Thanks for your patience and your huge efforts to keep our lovely “family business” running during these, not always easy times. Without you, this would surely not have been possible.
Finally, I would like to thank the Spanish Government for the financial contribution to this thesis in the framework of the research projects FOM-741 (Modelos para la evaluación y la mitigación de los riesgos
técnicos en el marco de los proyectos de las estructuras de edificación, Ministerio de Fomento) and Habitat
Abstract
Accidental actions on structures may be characterized as low probability - high consequence events. On one hand, their occurrence during the envisaged design working life of the structure is unlikely. On the other, if not appropriately accounted for, the associated effects on structures might entail significant damage. Since moreover such effects are subjected to high uncertainties, decision-making related to structural safety accounting for accidental actions is generally difficult and prone to be based on irrational grounds. Among such actions, gas explosions, are a good example. Despite the continuous modernization of gas installations and appliances, available statistics from different countries show that the occurrence rate of such explosions in buildings does not seem to decrease in a significant way. While the hazard potential is known and recognized, and although dealt with in many design codes, gas explosions are seldom accounted for in the design and evaluation of ordinary building structures. The low occurrence probability evokes reluctance to allocate resources to mitigate the associated risks, which, as a consequence, are often ignored and sometimes consciously accepted. The question if “doing nothing” is a justified practice cannot be easily answered however, since under the implicit approach adopted in everyday practice for verification of structural safety the risks are not quantified nor are acceptable risk levels established.
On this background, the study aims at exploring methods and tools for the practical application of explicit risk analysis in connection with gas explosions in buildings. A procedure is established for quantification of implicitly acceptable structure-related risks to persons, based on the probability of structural collapse and the consequences of such a failure in terms of loss of human life. The procedure adopted is applied to a representative set of building structures with RC members (beams and columns), which is obtained by varying the parameters with the greatest effect on design within reasonable limits. Following their identification, the most relevant hazard scenarios to these members are represented in terms of limit state functions (LSF). Based on the established LSF’s, a strict design (Ed = Rd) according to
a consistent set of codes is carried out, so that structural member performance complies exactly with the safety requirements that reflect current best practice. The basic variables involved in the LSF are stochastically characterized, where special attention is paid to the dynamic effects associated with the explosion-induced high loading rates on the members, such as the contribution of inertia forces, energy dissipation and strain rate-sensitive material behaviour.
In the subsequent reliability analysis of the structural members, the mentioned algorithm is coupled to a purpose-developed FOSM-based iterative procedure in order to obtain the most likely failure point for the established LSF. Taking account of the occurrence probability of a gas explosion event, implicitly acceptable structural failure probabilities for both columns and beams are derived and analyzed in the light of target ceilings demanded by structural codes. The findings suggest significant scope for a more rational formulation of design rules for accidental situations related to gas explosions.
For the estimation of the structural failure consequences, a regression model is developed from previously compiled and statistically evaluated data on explosion-induced structural collapse scenarios in buildings. The model delivers estimations for the number of fatalities as a function of the area affected by structural collapse and the occupancy rate of this area. Reasonable hypothesis are adopted in order to account for the possibility of system collapse given a local member failure.
Resumen
Las situaciones accidentales sobre estructuras se pueden considerar como eventos poco frecuentes, pero de importantes consecuencias. Por un lado, su probabilidad de ocurrencia durante el periodo de vida útil previsto de la estructura es remota, por otro, los efectos asociados sobre la estructura pueden acarrear importantes daños si no se han tenido en cuenta de forma apropiada. Como además estos efec-tos están normalmente afectados por un alto grado de incertidumbre, la adopción de decisiones relacio-nadas con la seguridad estructural en conexión con acciones accidentales es generalmente difícil y pro-pensa a carecer de una base racional. Entre tales acciones, las explosiones de gas son un buen ejemplo. A pesar de la modernización continua de los equipamientos e instalaciones para el suministro de gas en los edificios, estadísticas disponibles de diferentes países muestran que estas explosiones se siguen pro-duciendo con cierta frecuencia. Mientras su potencial de amenaza para la seguridad estructural es obje-tivamente conocido, la consideración de explosiones de gas en el dimensionado y la evaluación de es-tructuras de edificación es muy poco frecuente. La baja probabilidad de ocurrencia provoca rechazo a la hora de asignar recursos destinados a la mitigación de los riesgos asociados, que, por consecuencia, a menudo se ignoran o se aceptan conscientemente. Sin embargo, la respuesta a la pregunta de si “no hacer nada” es justificado no es evidente, puesto que, según el enfoque implícito adoptado en la práctica habitual para la verificación de los requisitos de seguridad estructural, los riegos no se cuantifican ni se establecen los niveles de riesgo aceptables.
Ante este trasfondo, el presente estudio se centra en el desarrollo de unos métodos y herramientas para el análisis explícito de los riesgos asociados con las explosiones de gas en edificios residenciales. Se es-tablece un procedimiento para cuantificar los riesgos implícitamente aceptados para las personas, aso-ciados con las estructuras. Este procedimiento está basado en la determinación de las probabilidades de colapso de los elementos resistentes del sistema analizado y de las pérdidas esperadas de vidas hu-manas en caso de producirse estos fallos. El procedimiento se aplica a un conjunto representativo de estructuras de edificación con elementos de hormigón armado (vigas y pilares), que se obtiene variando los parámetros característicos para su dimensionado dentro de unos límites razonables. Tras la identi-ficación de los escenarios de riesgo más relevantes para estos elementos, dichos escenarios se repre-sentan en términos de las funciones de estado límite (FEL). Basado en estas FEL, los elementos estruc-turales se dimensionan de forma estricta (Ed = Rd) de acuerdo con los requisitos de seguridad estructural
que se ajustan a la mejor práctica actual. Las variables básicas que intervienen en la FEL se caracterizan estocásticamente con énfasis en los efectos dinámicos asociados con las elevadas velocidades de carga a las que se someten los elementos en una explosión de gas, entre ellos la contribución de fuerzas de inercia, disipación de energía y la alteración de las propiedades de los materiales.
de equilibrio a nivel de elemento. Para las vigas, se lleva a cabo un estudio comparativo que permite validar los modelos simplificados mediante un análisis no lineal por elementos finitos. El análisis de los pilares sometidos a interacción de momentos flectores y esfuerzos axiles dinámicos requiere un algo-ritmo de solución específico que tiene en cuenta la dependencia de la resistencia estructural del nivel del axil, así como el comportamiento no lineal de los materiales y geométrico.
En el subsiguiente análisis de fiabilidad, el mencionado algoritmo se implementa en un procedimiento de análisis iterativo basado en el método FOSM, desarrollado para la determinación del punto de fallo más probable en la FEL establecida. Teniendo en cuenta la probabilidad de ocurrencia de una explosión de gas, se obtienen las probabilidades de fallo implícitamente aceptables tanto para los pilares como para las vigas. Los resultados sugieren un margen de mejora significativo para una formulación más racional de las reglas de dimensionado en situaciones accidentales caracterizadas por explosiones de gas.
Para la estimación de las consecuencias de fallos estructurales se desarrolla un modelo de regresión a partir de datos previamente recopilados sobre colapsos totales o parciales de edificios inducidos por explosiones. El modelo proporciona el número de víctimas mortales en función del área afectada por el colapso, así como de la ratio de ocupación de dicha área. Se adoptan hipótesis razonables para contem-plar la posibilidad de un colapso de sistema a partir de un fallo local de un elemento estructural.
Contents
Acknowledgements ... i
Abstract ... iii
Resumen ... v
Contents ... vii
List of Figures ... xiii
List of Tables...xxiii
Symbols ... xxv
Chapter 1
Introduction ... 1
1.1 Background ... 1
1.1.1 Risks and their treatment in structural engineering... 1
1.1.2 Risks associated with accidental design situations ... 3
1.1.3 Risks due to gas explosions in building structures ... 5
1.2 Scope ... 6
1.3 Objectives and approach ... 8
1.4 Outline of the document ... 9
Chapter 2
Risk and reliability ... 13
2.1 Principles of risk-informed decision making ... 13
2.1.1 Introduction ... 13
2.1.2 Explicit risk analysis procedure ... 13
2.1.3 Acceptance criteria ... 17
2.2 Principles of structural reliability ... 23
2.2.1 Uncertainties ... 23
2.2.2 Basic variables and their stochastical characterization ... 23
2.2.3 Probability of failure and reliability index: FOSM and FORM concepts ... 26
2.3 Treatment of risks and reliability in design codes ... 30
2.3.1 Introduction ... 30
2.3.2 Reliability verification based on design values ... 31
2.3.3 Inherent and target reliability levels ... 33
2.3.4 Accidental design situations ... 34
2.4 Reliability of structural systems ... 36
2.4.2 Series and parallel systems ... 37
2.4.3 Structural systems ... 38
2.4.4 Final observations ... 40
2.5 Reliability of RC elements under moment-axial force interaction ... 41
2.5.1 Introduction ... 41
2.5.2 Interaction diagram and load path dependency ... 41
2.5.3 Basic variables and their influence on reliability ... 43
2.5.4 Reliability methods ... 46
2.6 Summary ... 47
Chapter 3
Explosions and their effects on structures ... 49
3.1 Gas explosions ... 49
3.1.1 Introduction ... 49
3.1.2 Occurrence rate ... 49
3.1.3 Pressure generation ... 51
3.1.4 Load models ... 53
3.2 Behaviour of RC elements under blast loads ... 57
3.2.1 Introduction ... 57
3.2.2 Material behaviour ... 57
3.2.3 Structural response and failure modes ... 61
3.3 Simplified modeling approaches for explosion-induced structural response ... 63
3.3.1 Introduction ... 63
3.3.2 Strain rate effects ... 64
3.3.3 Flexural response ... 67
3.3.4 Flexural response under the influence of axial forces ... 73
3.3.5 Dynamic reaction forces ... 73
3.3.6 Applications ... 75
3.4 Summary ... 80
Chapter 4
Approach and basic developments ... 83
4.1 Assumptions for the inference of acceptable risks ... 83
4.1.1 Introduction ... 83
4.1.2 Implicit reliability level for accidental situations ... 83
4.1.3 Final remarks ... 86
4.2.2 General framework ... 86
4.2.3 Application to building structures ... 87
4.3 Procedure ... 90
4.3.1 Introduction ... 90
4.3.2 Description ... 91
4.3.3 Summary ... 92
4.4 Representative set of structures and members ... 94
4.4.1 Introduction ... 94
4.4.2 Geometry of structures ... 94
4.4.3 Explosion venting components ... 96
4.4.4 Main member characteristics ... 97
4.4.5 Combination of parameters ... 99
4.5 Accidental hazard scenarios ... 99
4.5.1 Introduction ... 99
4.5.2 Accidental scenario ... 99
4.5.3 Load arrangements and failure modes of members ... 101
4.5.4 Member failure-induced system collapse ... 103
4.6 Limit state functions... 104
4.6.1 Introduction ... 104
4.6.2 Beams ... 104
4.6.3 Columns ... 107
4.7 Strict design ... 113
4.7.1 Introduction ... 113
4.7.2 Design procedure and assumptions ... 114
4.7.3 Results ... 118
4.7.4 Differences to codes and standards in force ... 124
4.8 Characterization of basic variables ... 125
4.8.1 Introduction ... 125
4.8.2 Dynamic loads and load effects ... 126
4.8.3 Material properties ... 132
4.9 Summary ... 134
Chapter 5
Dynamic analysis ... 137
5.1 Approach ... 137
5.1.2 Dynamic load factors ... 138
5.1.3 Dynamic increase factors ... 142
5.2 Procedure ... 143
5.3 Implementation ... 146
5.3.1 Introduction ... 146
5.3.2 Beams submitted to load arrangement pEX(+) ... 146
5.3.3 Beams submitted to load arrangement pEX(-) ... 148
5.3.4 Columns ... 151
5.4 Results ... 156
5.4.1 Introduction ... 156
5.4.2 Beams submitted to load arrangement pEX(+) ... 156
5.4.3 Beams submitted to load arrangement pEX(-) ... 161
5.4.4 Columns ... 163
5.5 Validation of simplified models ... 171
5.5.1 Introduction ... 171
5.5.2 Members studied... 172
5.5.3 Development of a numerical model ... 173
5.5.4 Model validation ... 174
5.5.5 Numerical analysis procedure ... 177
5.5.6 Comparative study ... 177
5.6 Summary ... 183
Chapter 6
Reliability analysis ... 187
6.1 Analysis of columns under M-N interaction ... 188
6.1.1 Introduction ... 188
6.1.2 Procedure ... 188
6.1.3 Example... 190
6.2 Reliability level under explosion-induced load-arrangements ... 193
6.2.1 Introduction ... 193
6.2.2 Beams ... 194
6.2.3 Columns ... 200
6.2.4 Influence of changes in design code-rules ... 206
6.2.5 Final remarks ... 207
6.3.2 Analysis ... 209
6.3.3 Concluding remarks ... 210
6.4 Summary ... 210
Chapter 7
Consequence models ... 213
7.1 Context ... 213
7.2 Data compilation ... 214
7.2.1 Introduction ... 214
7.2.2 Building data ... 215
7.2.3 Incident data ... 215
7.2.4 Consequence data ... 217
7.2.5 Additional data ... 218
7.3 Data evaluation... 219
7.3.1 Introduction ... 219
7.3.2 Overview ... 219
7.3.3 Relevant incidents ... 221
7.4 Data complementation ... 223
7.4.1 Introduction ... 223
7.4.2 Area affected by the collapse ... 224
7.4.3 Occupancy of the area affected by the collapse ... 225
7.4.4 Results ... 226
7.5 Multiple linear regression analysis ... 226
7.5.1 Introduction ... 226
7.5.2 Regression model and associated criteria ... 227
7.5.3 Results ... 229
7.5.4 Discussion ... 234
7.6 Summary ... 238
Chapter 8
Risk-based acceptance criteria ... 241
8.1 Hazard scenarios ... 241
8.1.1 Introduction ... 241
8.1.2 Occurrence probabilities ... 242
8.1.3 Consequences ... 243
8.2 Implicitly acceptable risks ... 243
8.2.2 Risk profiles ... 243
8.2.3 Evaluation and representation of risks... 244
8.2.4 Comparison to prior studies ... 247
8.3 Acceptance criteria ... 249
8.3.1 Introduction ... 249
8.3.2 Individual risk ... 250
8.3.3 Societal risk ... 251
8.3.4 Conditional failure probability ... 254
8.3.5 Final remarks ... 259
8.4 Summary ... 260
Chapter 9
Conclusions and future research ... 263
9.1 Introduction ... 263
9.2 Developments and conclusions ... 265
9.2.1 Introduction ... 265
9.2.2 Methods and models for estimation of structure-related risks ... 265
9.2.3 Implicitly accepted risks to persons ... 269
9.2.4 Acceptance criteria ... 270
9.2.5 Additional findings ... 271
9.3 Original contributions ... 272
9.4 Future research ... 273
References ... 275
Annexes ... 285
Annex A
SDOF Analysis of columns including 2
ndorder effects ... 287
Annex B
Analysis of the longitudinal oscillations in blast-exposed columns .... 291
Annex C
Models for the deformation capacity of RC members ... 295
Annex D
Validation of the moment-curvature algorithm for columns ... 301
Annex E
Resistance of a short column under dynamic M-N interaction ... 307
Annex F
Preliminary FE study ... 311
Annex G
Approach for dynamic material properties in the numerical study .... 323
List of Figures
Figure 1.1 Categorization of hazard potential associated with a technical system; adapted from [3] ... 2 Figure 1.2 Partial collapse of Ronan Point building (London), in 1968 (left) [26] and total building collapse in Palencia (Spain) in 2009 (right) [29]. ... 5 Figure 1.3 Typical building structure with reinforced concrete members ... 7 Figure 2.1 Generic representation of a risk-based decision making procedure, adapted from [40]. ... 14 Figure 2.2 Schematical illustration of individual (IR) and societal (SR) risk; adapted from [48] ... 18 Figure 2.3 Approximate individual risks for selected hazardous activities deduced from accident statistics and schematical representation of voluntariness and benefit on risk acceptance; adapted from [49] ... 19
Figure 2.4 Examples for F-N criteria from [52] (left) and [49] (right). ... 20 Figure 2.5 Schematical representation of F-N criteria illustrating the ALARP principle [50]. ... 21 Figure 2.6 Schematical illustration of estimation of model uncertainty statistics from a number of tests [62]. ... 23
Figure 2.7 Probability density function fX(x) (left) and cumulative distribution function FX(x)
(right) ... 24 Figure 2.8 Joint probability density function fX,Y(x,y) and marginal density functions fX(x) and
fY(y). ... 25
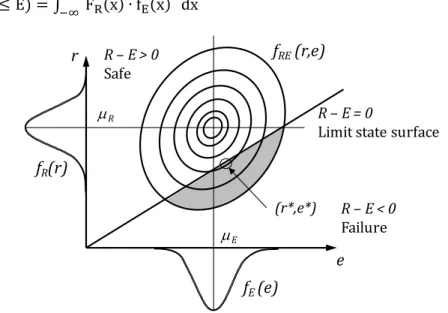
Figure 2.9 Illustration of limit state concept for the case of two basic variables [53]. . 26 Figure 2.10 Joint probability density function fRS(r,s) and limit state surface for basic reliability
problem ... 27
Figure 2.11 Probability density function fM(x) and reliability index ... 28
Figure 2.12 Contrours of probability density function (fZ(z)) contours and original (non-linear) and linearized limit state surfaces in the standardized normal space. ... 29 Figure 2.13 Series system (adapted from [3]) . ... 37 Figure 2.14 Failure domains (shaded) for series systems (left) and parallel systems (right) [53] ... 38
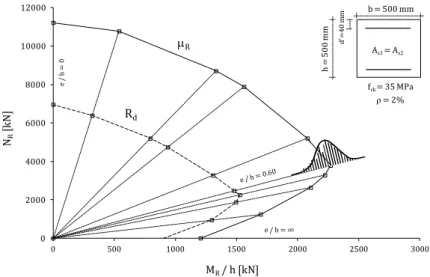
Figure 2.15 Parallel system (adapted from [3]). ... 38 Figure 2.16 Schematical representation of principal failure mechanisms of span A-B-C of a two-span girder [85]. ... 39 Figure 2.17 Bending moment (M) – axial force (N) interaction diagram ... 42
Figure 2.18 Different load paths in M-N interaction problems ... 43 Figure 2.19 Interaction diagram for a RC cross-section based on design values (Rd) and mean
values (R) ... 45
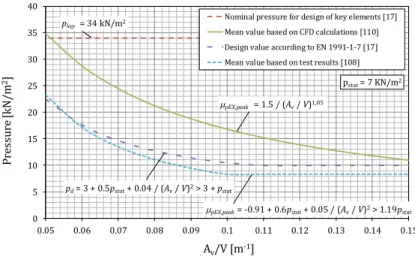
Figure 3.2 Explosion pressure generation recorded in full-scale test [116]. ... 53 Figure 3.3 Gas explosion pressure versus venting coefficient Av/V: Design value pd, nominal
value pkey = 34 kN/m2 for design of key elements against unidentified accidental actions [17]
and peak pressure mean value μpEX,peak according to [108] and [110]. ... 55
Figure 3.4 Typical idealized pressure-time relationships for deflagrations (left) and detonations (right) ... 56
Figure 3.5 Typical strain rates for different dynamic loads [125] ... 58 Figure 3.6 DIF for the concrete compressive strength as a function of strain rate: Test results compiled from different studies (Figure adapted from [126]) and models according to [129, 130]. ... 59
Figure 3.7 DIF for the upper yield stress as a function of time: Test results compiled from different studies and model according to Malvar and Crawford [143] (Figure adapted from [143]) ... 61 Figure 3.8 Left: Schematic representation of diagonal (upper) and direct (lower) shear failure modes [148]; Middle: RC columns failed in diagonal shear after exposition to blast load [151]. Right: Failure curve of a RC element with fixed support conditions [148, 152]. ... 62 Figure 3.9 Representation of a beam by an equivalent SDOF system. ... 68
Figure 3.10 Deformed shapes (x) of simply supported members under uniformly distributed loads in the elastic (left) and plastic (right) response stage [164]. ... 68 Figure 3.11 Ratio between resistance Ry and force Fpeak for simply supported beam under
uniformly distributed load with triangular forcing function (tr=0.5tp), as a function of and
tp/T (left: linear scale; right: log-scale). ... 71
Figure 3.12 Idealization of resistance (left) and action (right) according to approach suggested in [30]. ... 72 Figure 3.13 Simply supported member under combined influence of blast load p(t) and eccentric axial force N(t). ... 73 Figure 3.14 Dynamic equilibrium in a simply supported beam [124, 164]. ... 74 Figure 3.15 Comparison between test [167] and modeling results for a RC beam under impact force (see small figure on the left): Left: Mid-span deflection; Right: Support reactions; adopted from [124]. ... 75 Figure 3.16 Ratio of maximum deflection according to SDOF analysis and tests (adapted from [144]). ... 76 Figure 3.17 Flexural shear failure after air blast-test of one of the RC beams studied in [144]. ... 77 Figure 3.18 Comparison of registered and calculated support reactions for RC beam studied in [144]. ... 77 Figure 3.19 Displacement index (3.47) and ductility index (3.48) for 500 simply supported RC members as a function of reinforcement ratio [171, 172]... 79
Figure 4.1 Event tree identifying design situations, load scenarios and corresponding reliability level associated with the hazard potential stemming from gas explosions in building structures. ... 84 Figure 4.2 Schematic representation of a probability-consequence diagram (risk profile) 90 Figure 4.3 Procedural flow-chart ... 93 Figure 4.4 Designation of geometrical building parameters (Left: Elevation; Right: Plan view) ... 94 Figure 4.5 Explosion-induced damage to a residential, RC building with masonry facade panels [176] ... 97 Figure 4.6 Loading scenario in building structures; Stage 1: Normal use conditions; Stage 2: Explosion ... 100 Figure 4.7 Explosion pressure - time relationship assumed in the study ... 100 Figure 4.8 Load arrangements pEX(+) (upper) and pEX(-) (lower) for beams; Stage 1: Normal use
conditions, stage 2: Explosion ... 101
Figure 4.9 Load arrangements NEX(+) (left) and NEX(-) (right) on columns; Stage 1: Normal use
conditions; Stage 2: Explosion ... 102
Figure 4.10 Rectangular RC cross-section, strain () and stress () distribution and internal forces ... 106 Figure 4.11 Sequential exposure of column mid-span cross-section to M-N interaction (left) and corresponding deformed member shape (right); Path 1 (blue): Static loading stage; Path 2 (red): Dynamic loading stage ... 108 Figure 4.12 Differentiation of buckling limit state (BLS) and ultimate moment limit state (UMLS) in M-N (left) and M- (right) representation ... 112
Figure 4.13 Eccentricity (e) – curvature () relationship (without creep-induced term) assumed in member design for accidental design situation (left); Strain limits for ultimate limit state design according to [83] (right) ... 116 Figure 4.14 Percentages (corresponding to the most influent design variables) out of 213 RC beams strictly designed according to the accidental design situation. ... 119 Figure 4.15 Percentages (corresponding to most influent design variables) out of 4755 RC columns strictly designed according to accidental situation for M-N interaction. ... 120 Figure 4.16 Conceptual representation of the influence of distance l on column layout according to the accidental design situation (load arrangement NEX(-)) (left); Definiton of angle
e (right). ... 121
Figure 4.17 Ratio between design axial force NEd, acc and maximum design resistance NRd,acc as
a function of normalized design eccentricity ... 122 Figure 4.18 Ratio between second order- and total design bending moment as a function of normalized design eccentricity; Members strictly designed according to accidental design situation (load arrangement NEX(-))... 123
Figure 4.19 Comparison of coefficient K for modification of shear resistance VR,c according to
EHE-98 [83] and EHE-08/EN1992-1-1 [72, 84]. ... 125 Figure 4.20 Schematic illustration of dynamic load factor DLFE for computation of dynamic,
explosion induced action effect EEX from corresponding value EEX,peak due to statically applied
Figure 4.21 Derivation of mean value (lines) for explosion peak pressure from test results (dots) [109]; upper: first peak pressure pulse (p1); lower: second pressure pulse (p2)128
Figure 4.22 Gas explosion peak pressure pEX,peak versus venting coefficient Av/V (pstat = 7
kN/m2): Mean value obtained in the present study versus mean values according to [108] and
[110]. ... 129 Figure 4.23 Lognormal density function for combined basic variable E,dyn ∙ DLFE ... 131
Figure 4.24 Static (black) and dynamic (red) stress-strain diagrams for concrete under compression (left) and reinforcing steel (right) ... 133 Figure 4.25 Log-normal density function for dynamic strength variable fm,dyn ... 134
Figure 5.1 Procedural flow-chart ... 137
Figure 5.2 Schematic representation of displacement-time (left) and bending moment-time (right) curves for positive bending failure of beams under load-arrangement pEX(+) . 138
Figure 5.3 Schematic representation of displacement-time (left) and bending moment-time (right) curves for negative bending failure of beams under load-arrangement pEX(-). 139
Figure 5.4 Schematic representation of shear force-time curve for beams under load-arrangement pEX(+) ... 139
Figure 5.5 Schematic representation of bending moment-time curves corresponding to buckling limit state (left) and ultimate-moment limit state (right) for columns under load-arrangement NEX(-) ... 140
Figure 5.6 Dynamic analysis procedure ... 143 Figure 5.7 Idealised moment-curvature (left) and resistance-displacement (right) functions assumed for the mid-span cross-section of the beams subjected to load arrangement pEX(+).
... 144
Figure 5.8 Strain distribution in the mid-span cross-section due to initially acting static loads at t = t0 (stage 1), and total strain distribution at t = ty ... 147
Figure 5.9 Idealised moment-curvature (left) and resistance-displacement (right) functions assumed for the mid-span cross-section of the beams subjected to load arrangement pEX(-)
... 149
Figure 5.10 Idealised multilinear (left) and equivalent, bilinear (right) resistance-displacement functions assumed for the mid-span cross-section of the beams subjected to load arrangement pEX(-) ... 150
Figure 5.11 Stress-strain relation for concrete in tension under static (black) and dynamic (red) conditions ... 150 Figure 5.12 Strain distribution in the mid-span cross-section due to initially acting static loads at t = t0 (stage 1), and total strain distribution at t = ty ... 151
Figure 5.13 Idealised moment-curvature function for the intermediate cross-section of the columns and corresponding action effects (blue line) – step s =1 (gravitational loads)152
Figure 5.16 Multilinear moment-curvature (left) and resistance-displacement (right) function for the intermediate cross-section of the columns (UMLS members) ... 155
Figure 5.17 Displacement ductility ratio versus tensile reinforcement index (left); Ratio
between and ,dyn versus explosion-load ratio acc (4.62) (right); 486 beams subjected to
load-arrangement pEX(+) ... 156
Figure 5.18 Dynamic load factor DLFM for flexural (red) and tension tie shear failure mode
(green) versus effective displacement ductility dyn (left); Dissipated strain energy Ws:
Tension tie shear failure mode, Ws,Vs vs. flexural failure mode, Ws,M (right); 486 beams strictly
designed for acc. load arrangement pEX(+) ... 157
Figure 5.19 Dynamic load factor DLFM for flexural (red) and tension tie shear failure mode
(green) versus non-dimensional time-ratio tp/T (left); Dynamic load factor DLFV for tension-
(green) and compression- (blue) shear failure mode versus tp/T (right); 486 beams strictly
designed for acc. load arrangement pEX(+) ... 158
Figure 5.20 Displacement ductility ratio (multilinear resistance function) versus tensile
reinforcement index (left); Inverse of ratio between displacement ductility and effective
displacement ductility ,dyn versus inverse of explosion-load parameter acc; 136 beams
strictly designed for acc. load arrangement pEX(-) ... 161
Figure 5.21 Effective displacement ductility ratios corresponding to the multilinear (,dyn,
x-axis) and the equivalent bilinear resistance function (dyn,eq, y-axis) (left); Dynamic load
factor DLFM for flexural failure mode versus ,dyn,eq (right); 136 beams strictly designed for
acc. load arrangement pEX(-) ... 162
Figure 5.22 Possible failure domains BC (compression) and BT (tension) corresponding to
buckling-limit state (BLS) members (left) and U1 to U5 of Ultimate Moment Limit state (UMLS)
members (right). ... 163 Figure 5.23 Ratio between axial force NE at failure and maximum resisting axial force NR,max
versus normalized eccentricity e/h; 28512 columns strictly designed for accidental load arrangement NEX(-). ... 164
Figure 5.24 Example E1: M-N interaction diagrams (red) and sequential action effects (black). Mean value analysis (left) versus design situation (right). ... 165 Figure 5.25 Example E2: M-N interaction diagrams (red) and sequential action effects (black). Mean value analysis (left) versus design situation (right). ... 166 Figure 5.26 Example E3: M-N interaction diagrams (red) and sequential action effects (black). Mean value analysis (left) versus design situation (right). ... 166 Figure 5.27 Example E4: M-N interaction diagrams (red) and sequential action effects (black). Mean value analysis (left) versus design situation (right). ... 167 Figure 5.28 Example E5: M-N interaction diagrams (red) and sequential action effects (black). Mean value analysis (left) versus design situation (right). ... 168
Figure 5.29 Effective displacement ductility ratio ,dyn versus normalized eccentricity e/h
(left); Stiffness kdyn versus compression axial force due to gravitational loads NE,stat (right);
28512 columns strictly designed for acc. load arrangement NEX(-). ... 169
Figure 5.30 Ratio between load-pulse duration tp and natural period T versus stiffness kdyn
(left); Dynamic load factor DLF for flexural (red) and shear failure mode (blue) versus ratio tp
/ T; 28512 columns strictly designed for accidental load arrangement NEX(-) ... 169
Figure 5.32 Stress-strain relationships for concrete: Linear tension softening law (left) and parabolic law for compression [196] (right). ... 174
Figure 5.33 Numerical model of beam WE-5 ... 174 Figure 5.34 Multi-lineal (green) and bi-lineal (red) approximation to the time-dependant evolution of blast loading (black) to beam WE-5. ... 175 Figure 5.35 Comparison of numerical and experimental results of beam WE-5, tested by Seabold [146]: Deflection at mid-span (left); Support reaction (right). ... 176 Figure 5.36 Beam WE5 after blast test [146] ... 176 Figure 5.37 Numerically deduced crack patterns (a = failure load, b = collapse) of statically loaded beam OE3 without shear reinforcement and comparison to test result... 177
Figure 5.38 Moment-mid-span deflection (left) and mid-span deflection-time (right) curves for a sample beam found with simplified (red) and numerical (green) analysis ... 178
Figure 5.39 NA versus SA stiffness kM,II (left) and yield initial deflection y (right) for 18 beams
... 178
Figure 5.40 NA versus SA maximum deflection max for 18 beams (left); Percentage deviation
,dyn between ,dyn according to SA and NA versus longitudinal reinforcement ratio l for 18
beams (right) ... 179 Figure 5.41 Reaction force-time curve for a sample beam found with simplified (red) and numerical (green) analysis (left); Ratio (VEX,NA - VEX,SA)/ VEX,SA versus ratio tp/T for 18 beams
(right). ... 180
Figure 5.42 Breakdown of dynamic equilibrium (3.43) applied to sample beam (left): F (applied force), VEX (support reaction) and I (inertia force); Inertia force-time curve for sample
beam found with simplified (red) and numerical (green) analysis (right) ... 181 Figure 5.43 Acceleration plots 𝛿(𝑥, 𝑡) along longitudinal x-axis of the sample beam (x=0: support; x = 2.5 m: ,midspan) at different instants t during the dynamic response; a: t = 0.012 s (early elastic response); b: t = 0.048 s (developed elastic response); c: t = 0.096 (≈ limit of elastic response); d: t = 0.11 s (plastic response; Vmax). ... 182
Figure 5.44 Reaction force-time curve for the sample beam found with simplified (red) and numerical (green) analysis (applied peak-load level complies with tension-controlled shear failure). ... 183 Figure 6.1 Procedural flow-chart ... 187 Figure 6.2 Iterative reliability analysis procedure applied to columns under M-N interaction ... 188
Figure 6.3 Action effect (E*)j - and resistance (R*)j vectors corresponding to design point
vector (xi*)j; left: Same length but different direction; right: Same length and same direction
Figure 6.6 Evolution of failure probability pf|EX during iteration with initial strain distribution
according to mean value analysis (continuous line) and code-based member design (dashed line). ... 193
Figure 6.7 Reliability index req,EX (left) and corresponding sensitivity coefficients i (right) for
failure mode M(+) under load-arrangement pEX(+) of beams designed according to accidental
design situation (Figure 4.1, path a1), as a function of accidental load ratio, acc ... 195
Figure 6.8 Ratios between FORM design point bending moment MR* and, respectively,
code-based design value MRd (left) or mean value MRm (right), for failure mode M(+) under
load-arrangement pEX(+) of beams designed according to accidental design situation (Figure 4.1, path
a1);, as a function of accidental load ratio, acc ... 195
Figure 6.9 Reliability index req,EX for failure mode M(+) under load-arrangement pEX(+) of beams,
as a function of accidental load ratio, acc; Left: Comparison between accidental and persistent
design (Figure 4.1, paths a1 and b1); Right: Distinction for mandatory design situation (Figure
4.1, paths a1 or b1) ... 196
Figure 6.10 Reliability index req,EX (Tref = 50 years) for failure mode Vs (left) and Vc (right)
under load-arrangement pEX(+) of beams designed according to accidental design situation
(Figure 4.1, path a1), as a function of accidental load ratio acc ... 197
Figure 6.11 Sensitivity coefficients i for failure mode Vs (left) and Vc (right) under
load-arrangement pEX(+) of beams designed according to accidental design situation (Figure 4.1, path
a1), as a function of load ratio acc ... 197
Figure 6.12 Ratios between FORM design point shear force VR* and code-based design value
VRd for failure mode Vs (left) and Vc (right) under load-arrangement pEX(+) of beams designed
according to accidental design situation (Figure 4.1, path a1), as a function of ratio between
explosion- and total loads, acc ... 198
Figure 6.13 Ratios between FORM design point shear force VR* and mean value VRm for failure
mode Vs (left) and Vc (right) under load-arrangement pEX(+) of beams designed according to
accidental design situation (Figure 4.1, path a1), as a function of ratio between explosion- and
total loads, acc ... 198
Figure 6.14 Reliability index req,EX (Tref = 50 years) for failure mode Vs (left) and Vc (right)
under load-arrangement pEX(+) of beams designed according to mandatory design situation
(Figure 4.1, paths a1 or b1), as a function of accidental load ratio acc ... 199
Figure 6.15 Reliability index req,EX (left) and corresponding sensitivity coefficients i (right)
for failure mode M(-) under load-arrangement pEX(-) of beams designed according to accidental
design situation (Figure 4.1, path a1), as a function of inverse accidental load ratio, acc-1199
Figure 6.16 Ratios between FORM design point bending moment MR* and, respectively,
code-based design value MRd (left) or mean value MRm (right), for failure mode M(-) under
load-arrangement pEX(-) of beams designed according to accidental design situation (Figure 4.1, path
a1), as a function of inverse accidental load ratio, acc-1 ... 200
Figure 6.17 Reliability index req,EX (Tref = 50 years) (left) and corresponding sensitivity
coefficients i (right) for failure due to M-N interaction, under load-arrangement NEX(-),of
columns designed according to accidental design situation (Figure 4.1, path a1), as a function
of normalized design eccentricity (e/h)d,acc ... 201
Figure 6.18 Reliability index req,EX (left) for example columns E1 to E5 as a function of ratio
assumed in FORM analysis (left); Result of reliability analysis for example column E5 (right) ... 202
Figure 6.19 Normalized eccentricity corresponding to FORM design point (e/h)* versus normalized eccentricity corresponding to code-based design (e/h)d,acc (left) and mean-value
analysis (e/h)m (right) ... 203
Figure 6.20 Reliability index req,EX (Tref = 50 years) for failure due to M-N interaction, under
load-arrangement NEX(-),of columns designed according to mandatory design situation (Figure
4.1, paths a1 or b1), as a function of normalized design eccentricity (e/h)d,acc ... 204
Figure 6.21 Reliability index req,EX (Tref = 50 years) for failure mode Vs-N (left) and Vc-N (right)
of columns under accidental load-arrangement NEX(-) (Figure 4.1, path a1), as a function of
respectively, ratio between design shear force Vsu,d and total design shear resistance VRd,s , and
shear resistance reduction factor K ... 205
Figure 6.22 Sensitivity coefficients for selected variables corresponding to failure mode Vs
-N (left) and Vc-N (right) of columns under load-arrangement NEX(-) as a function of respectively,
ratio Vsu,d/VRd,s and factor K ... 205
Figure 6.23 Ratio of failure probability pf,adm,acc due to accidental load scenarios and
accumulated failure probability Pf,adm (left) and accumulated failure probability Pf,adm (right);
Positive bending failure of beams ... 209 Figure 6.24 Ratio of failure probability pf,adm,acc due to accidental load scenarios and
accumulated failure probability Pf,adm (left) and accumulated failure probability Pf,adm (right);
Failure due to M-N interaction of columns (only members characterized by pstat = 5 kN/m2).
... 210 Figure 7.1 Procedural flow-chart ... 213 Figure 7.2 Examples for incidents involving light (left), medium (middle) and severe (right) damage ... 216 Figure 7.3 Detailed description of damage extensions after collapse of a residential building in Palencia [203] ... 217 Figure 7.4 Distribution of compiled incidents per country (left) and per building use category (right) ... 219
Figure 7.5 Distribution of compiled incidents per time-period (left) and per gas-type involved (right) ... 220 Figure 7.6 Distribution of compiled incidents per incident cause category (left) and per damage category (right) ... 220
Figure 7.7 Distribution of compiled incidents per number of fatalities (left) and injuries (right) ... 221 Figure 7.8 Distribution of 107 potentially relevant incidents per construction material (left); Collapsed building in Tenerife [205] (right)... 222
Figure 7.9 Ncol-Acol (left) and Ncol-Ocucol plots (right) including tendency lines for 91 relevant
incidents ... 227 Figure 7.10 Externally studentized residuals ti versus predicted values Yi for
Ln(Ncol/(Ocucol/Acol)) ... 230
Figure 7.12 Q-Q plot (left) and studentized residuals versus predicted value (right) of model 2 ... 233
Figure 7.13 Observed versus predicted number of fatalities: Model 1 (left) and model 2 (right) ... 235 Figure 7.14 Graphical representations of model 1 (left) and 2 (right) ... 235 Figure 7.15 Comparison of model 1 (7.28) to previous models [9, 10, 13] derived for collapse incidents in buildings associated with consequence class CC2 (7.33) and CC3 (7.34)238 Figure 8.1 Procedural flow-chart ... 241 Figure 8.2 Lower (left) and upper (right) envelopes of 48 risk profiles corresponding to a specific geometrical building configuration ... 244
Figure 8.3 Risks Radm vs. building area A and explosion venting coefficient Av/V; Tref = 50 years
... 245 Figure 8.4 Risks Radm vs. building net room area A [m2] (left) and vs. nº of members nm (right);
Tref = 50 years ... 245
Figure 8.5 Risks Radm vs. nº of failure mechanisms nk (left) and vs. nº of hazard scenarios nj
(right); Tref = 50 years ... 246
Figure 8.6 Risks Radm normalized for building net room area A vs. A [m2] (left) and R
normalized for nº of structural members nm vs. nm (right); Tref = 50 years ... 246
Figure 8.7 Risks Radm normalized for nº of failure mechanisms nk vs. nk (left) and R normalized
for nº of hazard scenarios nj vs. nj; Tref = 50 years ... 247
Figure 8.8 Risks Radm normalized for building net room area A vs. A [m2] (blue dots);
Comparison to results from prior studies (red dots) [9, 10, 13]; Tref = 50 years ... 248
Figure 8.9 Risks Radm normalized for nº of failure mechanisms nk vs. nk (left) and Radm
normalized for nº of hazard scenarios nj vs. nj (right); Comparison to results from prior studies
(red dots) [9, 10, 13]; Tref = 50 years ... 249
Figure 8.10 F-n acceptance criteria for building structures with a range of net room areas A, based on the mean value of expected number of fatalities Radm,m; Comparison to resultsfrom
prior studies (red lines) [10, 13]; Tref = 50 years. ... 252
Figure 8.11 F-n acceptance criteria for building structures with a range of net room areas A, based on the 5%- (left) and 95% (right) fractile value of expected number of fatalities, Radm,5%
and Radm,95%; Comparison to resultsfrom prior studies (red lines) [10, 13]; Tref = 50 years.
... 253
Figure 8.12 Normalized F-n acceptance criteria F(n)t,TOT for structural members based on the
mean value (left) and the 5% or 95% fractile values (right) of the expected number of fatalities
Radm,TOT normalized for the number of failure modes nk; Comparison to resultsfrom prior
studies (red lines) [10, 13]; Tref = 50 years... 253
Figure 8.13 Target failure probabilities pft,TOT for structural members based on the mean value
(left) and the 5% or 95% fractile values (right) of the expected number of fatalities Radm,TOT
normalized for the number of failure modes nk; Comparison to resultsfrom prior studies (red
lines) [10, 13]; Tref = 50 years. ... 254
Figure 8.14 Minimum (left) and maximum (right) target value for conditional failure probabilities pft|EX for structural members; Tref for concomitant gravitational loads: 50 years.
List of Tables
Table 2.1 Standardized i values according to [11, 53]. ... 32
Table 2.2 Reliability differentiation according to [11]. ... 34
Table 2.3 Target annual reliability index t for ultimate limit states according to [80] and [36].
... 34
Table 2.4 1 and 2 values for imposed and snow loads in buildings according to [11], [71].
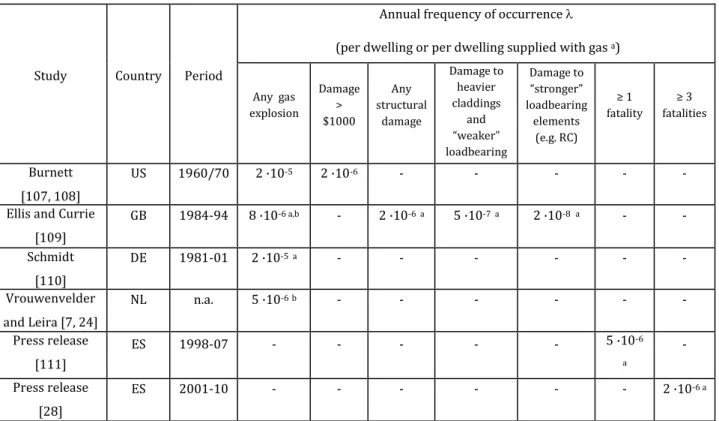
... 36 Table 3.1 Annual frequencies of occurrence of gas explosions reported in different studies. ... 50 Table 3.2 Typical failure pressures of different building elements [113]. ... 51
Table 3.3 Dynamic increase factors for design of RC structures [124, 130, 161]. ... 65 Table 3.4 Mass (KM), load (KL) and load-mass (KLM) - factors for simply supported members
under uniformly distributed load [164]. ... 70
Table 3.5 Mean value () and coefficient of variation (CoV) of ratio m,SDOF / m,Test for RC walls
in 76 tests [173]. ... 79 Table 4.1: Variation of geometrical parameters for definition of a representative set of RC buildings structures ... 95 Table 4.2: Definiton of member parameters and corresponding nominal values ... 98
Table 4.3: Identification of mandatory design situation ... 118
Table 4.4: Explosion load parameter acc for beams (load arrangement pEX(+))... 119
Table 4.5: Geometrical characteristics of mid-span and support cross-section of RC beams strictly designed according to mandatory design situation ... 123 Table 4.6: Geometrical characteristics of intermediate and support cross-section of RC columns strictly designed according to mandatory design situation ... 124 Table 4.7 Probabilistic models for static actions, action effects and resistance of RC members [78] ... 126 Table 4.8 Test results [116] considered for quantification of scatter associated with peak pressure pEX,peak ... 129
Table 4.9 Determination of coefficient of variation CoVpEX, peakfor pulse p1, taking account of
sample size sn = 8 ... 130
Table 4.10 Determination of coefficient of variation CoVpEX, peakfor pulse p2, taking account
of sample size sn = 7 ... 131
Table 5.1: Load-pulse durations tp assumed for dynamic analysis of beams and columns
... 145 Table 5.2: Statistical evaluation of dynamic load factors (minimum, mean, maximum value and coefficient of variation CoV) for 486 beams designed strictly according to accidental and mandatory situation. ... 159
Table 5.3: Dynamic increase factors (DIF) for 486 beams submitted to load arrangement pEX(+)
Table 5.4: Minimum, mean and maximum values of ratios between mean (including strain rate effects) and design resistance of 486 RC beams designed for load arrangement pEX(+)160
Table 5.5: Dynamic increase factors (DIF) for 136 beams submitted to load arrangement pEX(-)
... 162 Table 5.6: Percentages corresponding to failure domains of the 28512 analysed columns ... 164
Table 5.7: Dynamic increase factors (DIF) for 28152 columns submitted to load arrangement NEX(-) ... 170
Table 5.8: Some characteristics of the 18 beams selected for the comparative study 173 Table 5.9: Material property values used in the numerical analysis of beam WE-5 .... 175
Table 6.1 Summary of results obtained in reliability analysis procedure applied to column E2 (Positive N = compression axial forces) ... 191 Table 7.1: Statistical evaluation of different parameters corresponding to 107 potentially relevant incidents ... 223
Table 7.2: Average net-room area per housing unit (Ahu,av), per building storey (As,av) and per
building (Aav) as a function of the number of building storeys ns ... 224
Table 7.3: Average occupancy Ocuhu,av per housing unit as a function of the housing unit net
room area Ahu ... 225
Table 7.4: Statistical evaluation of complemented data corresponding to 107 potentially relevant incidents ... 226 Table 7.5: Estimation of regression coefficients of model 1 ... 230 Table 7.6: ANOVA (analysis of variance) of model 1 ... 231 Table 7.7: Goodness of fit indicators for model 1 ... 231
Table 7.8: Estimation of regression coefficients of model 1 ... 232 Table 7.9: ANOVA (analysis of variance) of model 2 ... 233 Table 7.10: Goodness of fit indicators for model 2 ... 233
Table 7.11: Statistical evaluation of M ratio (mean M, standard deviation sM and coefficient of
variation CoVM), predictive residual mean (PRM) and cut-off point corresponding to models 1
and 2 ... 234
Table 7.12: Statistical evaluation of M ratio (mean M, standard deviation sM and coefficient of
variation CoVM), predictive residual mean (PRM) and cut-off point corresponding to models
derived in [9, 13] ... 237
Table 8.1 Member exposure probability pe as a function of beam span l ... 242
Table 8.2 Mean, 5 and 95 % fractile values for individual risk target values rit and associated
target failure probabilities pft; Comparison to resultsfrom prior studies [9, 10, 13]; Tref = 50
Symbols
Latin upper case letters
A : Area; Building net room area
Aav : Average building net room area
Abw : Building area affected by the blast wave
Acol : Building area affected by the collapse
Acol,j : Building area affected by the collapse associated with hazard scenario j
Acol,min : Building area affected by the collapse below which a specific design solution would be
acceptable without need for any intervention regarding explosion-related structural safety
Ad : Design value of an accidental action
AEX : Tributary area for a member under explosion load exposure
AG+Q : Tributary area for a member under gravitational load exposure
Ahu : Net room area of a housing-unit
Ahu,av : Average net-room area of a housing-unit
Ai : Average net room area A per person i
Al : Loaded area
As : Cross-sectional area of reinforcement; Total cross-sectional area of reinforcement in
col-umns (As = As1 + As2)
As,av : Average net-room area of a building storey
As,req,acc : Cross-sectional area of reinforcement layer demanded by accidental design situation As,req,per : Cross-sectional area of reinforcement layer demanded by persistent design situation
Asw : Cross-sectional area of shear reinforcement
Asw/s : Cross-sectional area of shear reinforcement per unit length
(Asw/s)req,acc : Cross-sectional area of shear reinforcement per unit length demanded by accidental
de-sign situation
(Asw/s)req,per : Cross-sectional area of shear reinforcement per unit length demanded by persistent
de-sign situation
(Asw/s)min : Minimum cross-sectional area of shear reinforcement per unit length
As1 : Cross-sectional area of tensile reinforcement layer
As2 : Cross-sectional area of compression reinforcement layer
Av : Area of venting panels
Av/V : Venting coefficient
A0 : Reference area
B : Building width B
BLS : Buckling limit state
BC : Failure domain associated with exceedance of BLS due to M-N interaction, characterized
by yielding of compression reinforcement
BT : Failure domain associated with exceedance of BLS due to M-N interaction, characterized
by yielding of tensile reinforcement
C : Consequence; Constant
CoV : Coefficient of variation
CoVpEX,peak,s : Coefficient of variation for explosion peak pressure (sample)
Cb : Constant accounting for location of collapse-triggering beam
Cc : Constant accounting for location of collapse-triggering column
Ci : System component
Cij,k : Consequence of type k associated with event j due to hazard i
D : Damage (local), Distribution type; Number of disappeared persons
DIF : Dynamic Increase Factor taking account of strain rate effects DIFEc : Dynamic Increase Factor for concrete modulus
DIFfc : Dynamic Increase Factor for concrete compressive strength
DIFft : Dynamic Increase Factor for reinforcing steel tensile strength
DIFfy : Dynamic Increase Factor for reinforcing steel yield strength
DIFfyws : Dynamic Increase Factor for transverse reinforcing steel yield strength
DIFm : Dynamic Increase Factor for material property m
DIFc1 : Dynamic Increase Factor for concrete compressive strain at maximum stress
DLF : Dynamic Load Factor taking account of inertia forces and energy dissipation DLFE : Dynamic Load Factor associated with action effect E
DLFM : Dynamic Load Factor associated with bending moments M
DLFN : Dynamic Load Factor associated with axial forces N
DLFV : Dynamic Load Factor associated with shear forces V
E : Action effect; Modulus of elasticity; Energy
E : Action effect vector (in the bending moment - axial force space)
E* : Action effect vector (in the bending moment - axial force space) corresponding to most likely failure point on the limit state surface
EI : Cross-sectional stiffness
EII : Cross-sectional stiffness in the uncracked state
EIII : Cross-sectional stiffness in the cracked state
ESS : Explained sum of squares
EX : Explosion
E(N) : Expected number of fatalities associated with an undesired event
Ec : Concrete modulus of elasticity
Ec,stat : Concrete modulus of elasticity under static loading conditions
Ec,dyn : Concrete modulus of elasticity under dynamic loading conditions
Ed : Design value of action effect E
Edyn : Dynamic action effect due to explosion loading (including model uncertainty)
EEX : Dynamic action effect due to explosion loading (excluding model uncertainty)
EEX,peak : Action effect due to static application of explosion peak pressure pEX,peak
Eij : Event j caused by hazard i
Ek : Kinetic energy
Es : Reinforcing steel modulus of elasticity (under static and dynamic loading conditions)
F : Frequency; Force; F distribution by Fisher; Cut-off value corresponding to F distribution by Fisher
F* : F-statistic corresponding to F distribution by Fisher FORM : First Order Reliability Method
F(n)adm : Admissible frequency of occurrence of an event with N ≥ n fatalities
F(n)EX : Frequency of a collapse scenario with n≥N fatalities associated with explosion load
ar-rangements
F(n)PER : Frequency of a collapse scenario with n≥N fatalities associated with persistent load
ar-rangements
F(n)t : Target value for frequency F(n)
F(n)TOT : Total frequency of a collapse scenario with n≥N fatalities associated with all kind of load
arrangements potentially affecting the structure in question F(n)t,PER : Target value for frequency F(n)PER
F(n)t,TOT : Target value for total frequency F(n)TOT
FX(x) : Cumulative distribution function
F(1) : Frequency of occurrence of an event with N ≥ 1 fatalities F(1)t : Target value for frequency F(1)
Fc : Force resisted by concrete in compression
Feq : Equivalent force (SDOF system)
Feq,peak : Equivalent peak force (SDOF system)
Fk : Characteristic value of an action
Fpeak : Peak force
Fy : Yield force of reinforcing steel
Fs : Force resisted by the reinforcement layer
G : Gumbel distribution; Permanent action
Gf : Fracture energy of concrete in tension under static loading conditions
Gk : Characteristic value of a permanent action
H : Hazard; Building height
H : Hat matrix (relates the vector of observations Yi to the vector of model predictions Ŷi)
Hi : Hazard i related to a specific system
H0 : Hypothesis for testing significance of a regression model and its parameters
I : Resulting inertia force; Second moment of area; Impulse; Non-cracked state; Number of
injuries
II : Cracked state prior to yielding
III : Post-yield state
Icol : Number of injuries due to structural collapse
Isev : Number of severe injuries
Isev,col : Number of severe injuries due to structural collapse
Isli : Number of slight injuries
Isli,col : Number of slight injuries due to structural collapse
K : Reduction coefficient for the resistance of the compression strut taking account of the stress state in the compression chord
Ki : Transformation factor
KIL : Inertia-load factor
KL : Load factor
KLM : Load-mass factor
KM : Mass factor
L : Building length L
Ln : Natural logarithm
LQI : Life Quality Index
LSF : Limit State Function
M : Bending moment; Safety margin; Ratio between observed and predicted value
M(+) : Positive bending failure scenario of beams
M(-) : Negative bending failure scenario of beams
MDOF : Multi degree of freedom
MLSC : Marginal Life Saving Cost
MSE : Mean square error
MSR : Regression mean square
ME : Applied bending moment (action effect)
ME* : Applied bending moment (action effect) corresponding to FORM design point
MEd : Design bending moment (action effect)
MEd,I : First order contribution to design bending moment (action effect)
MEd,II : Second order contribution to design bending moment (action effect)
MEd,acc : Design bending moment (action effect) for accidental situation
MEd,per : Design bending moment (action effect) for persistent situation
ME,dyn : Applied bending moment due to dynamic actions
ME,dyn,I : Applied first order bending moment due to dynamic actions
ME,dyn,II : Applied second order bending moment due to dynamic actions
ME,stat : Applied bending moment due to static actions
ME,stat,I : Applied first order bending moment due to static actions
ME,stat,II : Applied second order bending moment due to static actions
ME,stat,d : Contribution of static actions to design bending moment MEd
MEX : Bending moment at the mid-span cross-section of the beams due to the vertical explosion
load 𝑝̃EX; First order bending moment at the intermediate cross-section of the columns
due to the horizontal explosion load 𝑝̃EX,h
MEX,d : Design value for first order bending moment at the intermediate cross-section of the
col-umns due to the horizontal explosion load 𝑝̃EX,h MFc : Moment resisted by concrete in compression MFs : Moment resisted by the reinforcement layer
MG : Bending moment due to permanent actions
MNEX : First order bending moment at the intermediate cross-section of the columns due to the
eccentrically applied axial force NEX
MQ : Bending moment due to variable actions
MR : Resistingbending moment
MR* : Resisting bending moment corresponding to FORM design point
MR,b : Resistingbending moment corresponding to the balance point
MR,cr : Cracking moment
MRd : Design value for resistingbending moment
MRd,u : Design value for ultimate moment
MRd,y : Design value for yield moment
MR,dyn : Resisting bending moment available to sustain dynamic actions
MR,y : Yield moment
N : Number of fatalities; Axial force; Normal distribution
NA : Numerical analysis
Ncol : Number of fatalities due to structural collapse
NE : Applied axial force (action effect)
NE* : Applied axial force (action effect) corresponding to FORM design point
NEd : Design axial force (action effect)
NEd,acc : Design axial force (action effect) for accidental situation
NEd,per : Design axial force (action effect) for persistent situation
NE,dyn : Applied axial force due to dynamic actions
NE,stat : Applied axial force due to static actions
NE,stat,d : Contribution of static actions to design axial force NEd
NEX : Axial force due to explosion load
NEX(-),(+) : Accidental load arrangements for columns
NG : Axial force due to permanent actions
NGf : Axial force due to permanent loads of the building floor systems
NG+Q : Axial force due to gravitational loads
Nj : Number of fatalities associated with hazard scenario j
Nmax : Maximum number of fatalities associated with an undesired event (e.g. a structural
col-lapse scenario) in a system (e.g. a building structure) NQ1 : Axial force due to leading variable action
NQ2 : Axial force due to accompanying variable action
NR : Resistingaxial force
NR* : Resisting axial force corresponding to FORM design point
NR,b : Resistingaxial force corresponding to the balance point
NRd : Design value for resistingaxial force
NRd,max,acc : Design value for maximum resistingaxial force in the accidental situation
NR,dyn : Resisting axial force available to sustain dynamic actions
NR,max : Maximum resistingaxial force (corresponding to e/h = 0)
NR,u : Resisting axial force corresponding to the ultimate moment MRu
NR,y : Resisting axial force corresponding to the yield moment MRy
Ocu : Total building occupancy
Ocucol : Occupancy of the area affected by the collapse Acol
Ocuhu,av : Average occupancy per housing unit
P : Probability, Representative value of a prestressing action
PER : Persistent
PRM : Predictive residual mean
P(D|H) : Conditional probability of (local) damage in case the hazard occurs
P(Eij) : Occurrence probability of event j due to a set of hazards i
P(Eij|Hi) : Conditional probability of event j due to hazard i given occurrence of hazard
P(H) : Occurrence probability of a hazard
P(Hi) : Occurrence probability of hazard i
P(S|D) : Conditional probability of a partial or total system failure in case of (local) damage
Pf,adm : Implicitly admissible, accumulated failure probability
Q : Variable action
Qk : Characteristic value of a variable action
R : Risk; Societal risk associated with a technical system (e.g. a structure); Resistance
R : Resistance vector (in the bending moment - axial force space)
R* : Resistance corresponding to most likely failure point on the limit state surface (FORM
design point)
R* : Resistance vector (in the bending moment - axial force space) corresponding to most
likely failure point on the limit state surface
R2 : Coefficient of determination
R
̅2 : Adjusted coefficient of determination
RC : Reinforced concrete
RF : Response function
RSS : Residual sum of squares
R() : Resistance function
Radm : Implicitly acceptable risks to persons (in terms of the expected number of fatalities)
as-sociated with a particular structure
Radm,m : Mean value of implicitly acceptable risks to persons associated with a particular
struc-ture
Radm,5% : 5%- fractile value of implicitly acceptable risks to persons associated with a particular
structure
Radm,95% : 95% - fractile value of implicitly acceptable risks to persons associated with a particular
structure
Rd : Design value of resistance R
Rd,req : Required design resistance
Rd,req,acc : Required design resistance for accidental situations
Rd,req,per : Required design resistance for persistent situations
Rdyn : Effective resistance to sustain dynamic actions
Rdyn,eq : Equivalent effective resistance to sustain dynamic actions
Rdyn() : Effective resistance function to the applied dynamic loading
Req : Equivalent resistance (SDOF system)
Req,y : Equivalent yield resistance (SDOF system)
Rj : Societal risk to persons associated with hazard scenario j
Rk : Risk associated with consequence component k
Rk,adm : Admissible risk associated with consequence component k
Rm : Mean resistance
Rprov : Provided resistance
Rreq : Required resistance
Rstat : Resistance corresponding to static loads
Ru : Ultimate resistance
Ru,dyn : Effective ultimate resistance to sustain dynamic actions
Ry : Yield resistance
Ry,dyn : Effective yield resistance to sustain dynamic actions
![Figure 1.1 Categorization of hazard potential associated with a technical system; adapted from [3]](https://thumb-us.123doks.com/thumbv2/123dok_es/6721412.826226/52.892.255.634.121.445/figure-categorization-hazard-potential-associated-technical-adapted.webp)
![Figure 2.1 Generic representation of a risk-based decision making procedure, adapted from [40]](https://thumb-us.123doks.com/thumbv2/123dok_es/6721412.826226/64.892.231.656.111.463/figure-generic-representation-based-decision-making-procedure-adapted.webp)
![Figure 2.9 Illustration of limit state concept for the case of two basic variables [53]](https://thumb-us.123doks.com/thumbv2/123dok_es/6721412.826226/76.892.128.659.591.848/figure-illustration-limit-state-concept-case-basic-variables.webp)
![Figure 2.16 Schematical representation of principal failure mechanisms of span A-B-C of a two-span girder [85]](https://thumb-us.123doks.com/thumbv2/123dok_es/6721412.826226/89.892.173.717.224.490/figure-schematical-representation-principal-failure-mechanisms-span-girder.webp)
![Figure 3.6 DIF for the concrete compressive strength as a function of strain rate: Test results compiled from dif- dif-ferent studies (Figure adapted from [126]) and models according to [129, 130]](https://thumb-us.123doks.com/thumbv2/123dok_es/6721412.826226/109.892.239.646.120.378/concrete-compressive-strength-function-compiled-studies-adapted-according.webp)
![Figure 3.8 Left: Schematic representation of diagonal (upper) and direct (lower) shear failure modes [148]; Mid- Mid-dle: RC columns failed in diagonal shear after exposition to blast load [151]](https://thumb-us.123doks.com/thumbv2/123dok_es/6721412.826226/112.892.108.811.402.638/figure-schematic-representation-diagonal-failure-columns-diagonal-exposition.webp)