Control of Phase in Radial Line Slot Antenna for 5G
Communications at 60GHz
M.J. López Morales , Jiro Hirokawa , M. Sierra-Castañer
Abstract—This paper shows the design of a radial line slot antenna for being used in indoor environments in the 60 GHz band of the future 5G communication systems. The antenna is designed to work in near field situation, creating a uniform field in a certain volume, improving the size of this volume with respect the use of uniform phase. The paper analyzes different configurations of phase on the slots and performs the design of the slot position and length on the upper plate of the radial line slot antenna.
Index Terms—radial line slot antenna, 5G communication, antenna synthesis, radar, array antenna.
I. INTRODUCTION & OBJECTIVES
In the near future the need for higher speeds in wireless connections is a priority. There are many techniques to increase the speed in the physical layer such as increasing the spectral efficiency, increasing the bandwidth and reducing the cells coverage area.
One solution is to create a uniform wireless access system, equivalent to the quiet zone in compact antenna test systems, a new kind of cell with coverage up to few meters. As long as these cells are very small, they can use higher frequency bands, which have less propagation strength but higher bandwidths. With this solution there is an increment in the available bandwidth and smaller area coverage.
In this new wireless access solution, it is necessary to design all the system, including the antenna and, therefore, its radiant element. One family of antennas that is suitable for being applied in this issue is the radial line slot antenna (RLSA). These antennas have been widely studied since 1980 for satellite applications, plasma or RADAR systems [1-3]. There are also applications in this frequency band (60GHz) that allows a cheap fabrication cost [4]. This antenna consists of two metal parallel plates with a dielectric between them, fed in the lower one by a coaxial and with slots in the upper one. As long as these antennas can be seen as continuous apertures that have been sampled, a first study using continuous sources will be done. M. Ettorre et al. presented in [5] a method for designing RLSA antennas for near field focusing.
The objective of this paper is to study how the equivalent currents distribution in the aperture of the RLSA will change the Near Field radiation pattern. In other works, it has been
stated that a change in the amplitude distribution does not affect the NF pattern as much as expected. Therefore, in this paper we will show how the NF pattern changes when the phase distribution in the aperture is changed. Different phase patterns have been tested: linear, circular, and second-degree polynomial tapering, with both positive and negative value of the phases in the edge of the aperture.
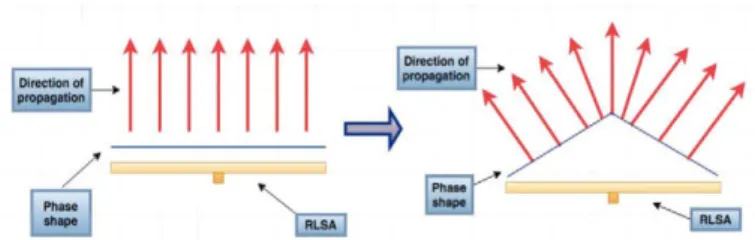
The idea in which this approach relays is shown in the following image. As long as the power is mainly propagated in a direction that is perpendicular to the phase distribution, if a certain tapering in the phase distribution is generated, the field will propagate in a wider volume.
i \
Direction oí >
propagation
Direction of propagation
^
7\\\
\\\V
fc V \ V
if*
/ / 4w//
^< // 1 > \
/
Phase
X K
•shape R L S A ^ RLSA
Fig. 1: Field propagation concept according to phase distribution of aperture currents.
II. A N A L Y S I S MODELS
For the first study of the proper currents distribution in the aperture, two different methods have been applied. The first is based on the Plane Wave Spectrum propagation, while the second is based on the field radiated by a circular continuous source.
A. Plane Wave Spectrum
This approach aims to use the Plane Wave Spectrum decomposition to find a solution to the proposed problem. The PWS decomposition consists of a transformation from the field domain to the spectral domain through the use of a 2-dimensional FFT operation. Once the PWS is calculated, a phase change is applied and then a transformation back to the field domain through a 2-dimensional IFFT is applied. With these consecutive operations, the propagation of the field can be simulated.
B. Field radiated by a circular continuous source
This method is based on using the equation of the pattern created by a continuous circular aperture in all directions of space.
As long as we will be interested in certain values of certain dimensions, it is necessary to particularize the previous equation for the desired dimensions. These dimensions are z-axis (x=y=0) and zx (y=0) (or zy (x=0)) plane.
III. RESULTS FOR THE DIFFERENT ANALYSIS MODELS
In this section there are some representations of the results obtained with both analysis models. It is important to state that a correct amplitude distribution is needed to reduce the ripple created in the NF range of the pattern.
Amplitude normalized t o 10 mW
LinearPhase -250° Edge Linear Phase -800°
-0.05 0 0.05 Radius [m]
0.1
Fig. 2: Normalized amplitude distributions tested for the currents.
E field along z-axis for uniform phase
20
-10u
- Uniform -Circular - Lintap (50%, -Inf) -Cosine (-10 dB) - Cosine (-Inf dB) - Gaussian -30
10"2 10"1
Distance [m]
Fig. 3: E-field Intensity along z-axis for previous amplitudes
Amplitude of cosine type is the one chosen for all the results shown.
A. Plane Wave Spectrum
The main advantage of the method is that it can be very easily implemented just by using a 2-dimensional FFT.
In this section, the field intensity created by different phase distributions in the zx plane (y=0) is shown, having the cosine as a reference. From left to right and top to bottom the phase distributions are: linear 300°, linear 500°, circular
-1000° and circular -1500°. One curious effect is that if a high edge phase for linear taper of the phase is set, two main lobes propagate in different directions, letting the z-axis without any coverage.
Horizontal Position [m] Circuí ar Phase -1000°
Horizontal Position [m] Circular Phase -1500°
-1 -0.5 0 0.5 1 -1 -0.5 0 0.5 1
Horizontal Position [m] Horizontal Position [m]
Fig. 4: E-field intensity in zx-plane for various phase distributions (PWS).
With the previous figures, it is observed that this method has a drawback: due to the periodicity of the FFT, a certain aliasing of the field (which can be seen as if there are infinite apertures in the aperture plane, squarely distributed with a constant separation between them) is generated. Therefore, for a certain distance, the results will not be accurate enough because of the destructive contributions.
B. Field radiated by a circular continuous source
Using this technique, the problem of the aliasing is solved. The field intensity created by different phase distributions in the zx plane (y=0) is shown.
Linear Phase -300° Linear Phase 300° Edge Linear Phase 500°
-05 0 0 5 1 15
Horizontal Position [m]
Circular Phase -1000° Edge
-05 0 0 5 1
Horizontal Position [m]
Circular Phase 1000s Edge
1 5 -1 - 0 5 0 0 5 1 1 5
Horizontal Position [m]
Pol2deg Phase -1000°
15 -15 -1 -05 0 0 5 1 15
Horizontal Position [m]
Pol2deg Phase -2000°
Horizontal Position [m]
10
18
! ;
_
-15 -1 -05 0 05 1 15
Horizontal Position [m]
-15 -1 -05 0 05
Horizontal Position [n
Fig. 5: E-field intensity in zx-plane for different phase tapers (circular continuous sources).
Radius [m]
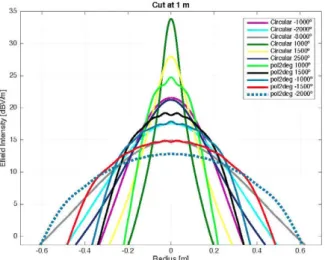
Fig. 6: E-field intensity cuts at lm with various phase distributions.
..-•
Cut at 3 m
Circular-1000° — Circular -2000° Circular -3000° Circular 1000° — Circular 1500° ^ ^ — Circular 2500° pol2deg 1000° pol2deg 1500° ^ - ^ pol2deg -1000° ^ - ^ pol2deg -1500°
• - - - • i pol2deg-2000°
Mj
im.
Mil
\
v
///I II
1 \\
-[ \\$t*'
X
Radius [m]
Fig. 7: E-field intensity cuts at 3m with various phase distributions.
•
• C i C l C i C l C i C l p o p i PC p t p o
cular cular cular 2deg 2deg 2deg 2deg 2deg
1000° 2000° 3000° 000° 500° 2500° 1000° 1500° 1000° 1500° 2000°
Radius [m]
Fig. 8: E-field intensity cuts at 5m with various phase distributions.
With all the previous representations, it is concluded that the best phase distribution has to be a second-degree polynomial with the proper phase limit to obtain the desired volume coverage for certain distances.
IV. RLSA DESIGN APPROACH AND EXAMPLES
In this section, a new design approach for RLSAs is presented. The purpose of this approach is to design the length and position of the slots in the upper plate of the RLSA to get the desired currents distribution in the aperture. Therefore, it is necessary to create a method for getting the desired amplitude distribution and another method for getting the desired phase distribution.
A. Amplitude distribution design method
For the amplitude design we are going to base it on the theorem of energy conservation in a pair of slots, where a physical approximation is carried out.
Dielectric spacer
Coax, feed
Fig. 9: RLSA structure and radial slot pairs.
Slot pairs
If the theorem of energy conservation in a pair of slots is used, in the cavity of a pair of slots the energy that enters is equal to the sum of the energy radiated by the pair of slots, the energy dissipated in the dielectric material and the energy transmitted to the next pair of slots. This concept is shown in Fig. 8.
Wrad(Ar)
W i n ( r ) ^ ^ _ Wout(r+Ar)
' loss (Ar)
Fig. 10: Energy conservation in a pair of slots scheme.
If Ar -> 0 (an acceptable approximation for relatively large aperture radius), the differential equation that depends on the amplitude distribution of the currents in the aperture can be solved [6]. The solution of this differential equation and the correct calculations will give the neccesary coupling depending on the radial position in the upper plate of the RLSA.
<0
_ , „ ( ,
pinput \ spillover([)J2-R (2)
Once, this coupling is calculated, the length of the slots can be obtained for a certain amplitude distribution.
B. Phase distribution design method
If a uniform phase distribution is desired, the separation between laps must be equal to Xg ejj (including different
effects of phase variation in the RLSA). To get a phase taper, the following equation is applied:
Ageff
-K = - • Ageff
{Xgeff + Ad) (3)
If a linear phase taper is designed, Ad must be the same for every lap (it can be either positive or negative). Therefore, there will be a constant separation between rings in the RLSA. On the contrary, if a circular or a second-degree polynomial taper is designed, the separation between laps must increase for each lap. In this case, the phase at the edge of the aperture is calculated:
Ageff
-AdT = phlim -> AdT = — ^geff phlim (4)
And, consequently, the position of each ring or lap of slots can be calculated.
C. Design examples with the proposed method
In this section, the results obtained after analyzing different designs performed with the technique previously explained are shown. The method presented in [7] is used for analyzing the different designs. All the following figures are in the FF range because for this RLSA the FF is closer than lm away from the aperture. Therefore, as long as we will not use this application in distances shorter than lm from the antenna, representing the FF pattern gives enough information
1) Uniform amplitude and phase distribution
Copolarand crosspolar. 60 GHz. Phi=-9QS
-5
-10
-15
-20
-25
-30
-35
-40
Copolar (-)
Crosspolar (:)
-80 -60 -40 -20 0 20 4 0 60 80
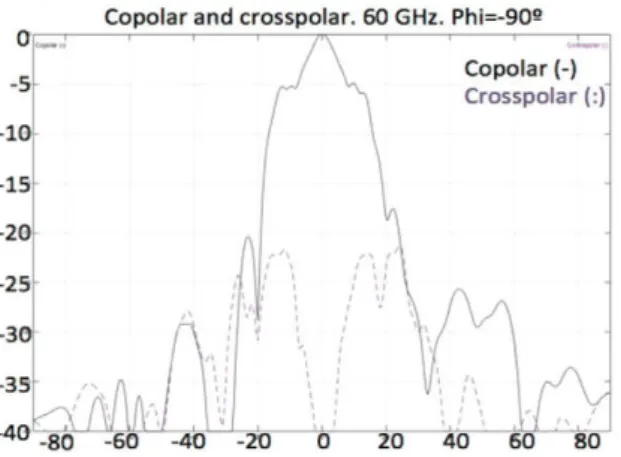
Fig. 11: Copolar and crosspolar diagrams for uniform amplitude and phase
distributions for the aperture currents. X-axis degrees.
We can see that we get a very directive diagram, as expected for uniform amplitude and phase distribution.
2) Cosine Amplitude and uniform phase
Copolar and crosspolar. 60 GHz. Phi=-9QS
-20 0 20 4 0 60 80
Fig. 12: Copolar and crosspolar diagrams for cosine amplitude and uniform
phase distributions for the aperture currents. X-axis degrees.
The diagram for this currents distribution has a wider main lobe, as expected.
3) Cosine Amplitude and linear -720°phase edge
Copolar and crosspolar. 60 GHz. Phi=-908
-80 -60 -40 -2*0 0 20 40 6b 80
Fig. 13: Copolar and crosspolar diagrams for cosine amplitude and linear phase
distributions with edge phase of-720° for the aperture currents. X-axis degrees.
The diagram for this currents distribution has a wider main lobe compared to the previous case. Therefore, it is seen that linear phase taper in the aperture will increase the main lobe coverage.
4) Cosine Amplitude and linear -2160°phase edge
Copolar and crosspolar. 60 GHz. Phi=-90g Of
-80 - 6 0 - 4 0 - 2 0 0 2 0 4 0 6 0 8 0
Fig. 14: CP and XP diagrams for cosine amplitude and linear phase with edge
The diagram for this currents distribution creates two propagating plane waves and grating lobes. We can see that linear tapering will have a limitation as we saw with the continuous sources calculation.
second-degree polynomial phase distribution can achieve wider main lobe coverage with higher negative phase edge values. Higher values, on the contrary, will give worse results.
5) Cosine amplitude and second degree polynomy -2160° phase edge
Copolar and crosspolar. 60 GHz. Phi=-90s
-80 -60 - 4 0 - 2 0 0 20 40 60 80
Fig. 15: CP and XP diagrams for cosine amplitude and second-degree polynomial phase distributions with edge phase of-2160°. X-axis degrees.
The diagram for this currents distribution has a wider main lobe compared to the previous case. Therefore, it is seen that second-degree polynomial phase distribution can achieve wider main lobe coverage than the linear case, avoiding the creation of two propagating plane waves and the creation of grating lobes.
6) Cosine amplitude and second degree polynomy -3600° phase edge
Copolar and crosspolar. 60 GHz. Phi=-90e
"4 0- 8 0 -60 -40 -20 0 20 40 60 80
Fig. 16: CP and XP diagrams for cosine amplitude and second-degree polynomial phase distributions with edge phase of-2160°. X-axis degrees.
The diagram for this currents distribution has a wider main lobe compared to the previous case. Therefore, it is seen that
V. CONCLUSIONS AND FUTURE LINES
A study of the effect created in the NF pattern by the currents phase distribution on a circular aperture has been carried out. This paper has shown two analysis techniques for near field calculation of the field created by the RLSA, and a design technique of RLSA for near field communications. Also the paper has compared different phase distributions in the aperture, showing the effect of the phase distribution in the volume covered by a slot antenna in a near field volume. Finally, a second degree polynomial function for the phase distribution with a cosine amplitude distribution has been chosen as the best option for the maximization of the coverage volume for a determined size of antenna.
Some future lines of work are here stated. Working with other amplitude and phase distributions, analyzing smaller apertures with less strict amplitude and phase patterns, analyze square apertures and improving the proposed design technique for RLSA, so as to have a better and more reliable phase distributions.
REFERENCES
[1] M. Ando, K. Sakurai, N. Goto, K. Arimura, and Y. Ito, "A radial line slot antenna for 12 GHz satellite TV reception," IEEE Trans. Antennas Propag., vol. AP-33, no. 12, pp. 1347-1353, Dec. 1985.
[2] T. Yamamoto, T. C. Nguyen, M. Ando, N. Goto, M. Hirayama, T. Ohmi, "Design of Radial Line slot Antenna at 8.3 GHz for Large Area Uniform Plasma Generation," Jpn.J.Appl.Phys., Vol.38, Part 1, No.4A, pp.2082-2088, April 1999.
[3] M. Sierra-Castafler, M. Sierra-Pérez, M. Vera-Isasa and J. L. Fernández-Jambrina, "Low cost monopulse Radial Line Slot Antenna", IEEE Trans. Antennas Propaga!, vol. 51, pp. 256-263, 2003.
[4] A. Akiyama, J. Hirokawa, M. Ando, E. Takada, and Y. Arai, "60GHz band small aperture conical beam radial line slot antennas", IEICE Trans. Electron., vol. E82-C, no. 7, pp. 1229- 1235, Jul. 1999.
[5] Mauro Ettorre, Massimiliano Casaletti, Guido Valerio, Roñan Sauleau, Laurent Le Coq, Santi Concetto Pavone, Matteo Albani. "On the Near-Field Shaping and Focusing Capability of a Radial Line Slot Array", IEEE Trans, on Antennas and Propagation, vol. 62, no. 4, April 2014, pp. 1991-1999.
[6] T. Nguyen, J. Hirokawa, Makoto Ando, M. Sierra Castañer, "Design of mm-Wave RLSAs with Lossy Waveguides by Slot Coupling Control Techniques. IEICE Trans. Commu., Vol.E98-B, No.09,Sep. 2015. [7] M. Sierra-Castañer, M. Sierra-Pérez, M. Vera-Isasa, J.L: Fernández
Jambrina. "Fast analysis model for Radial Line Slot Antennas". Microwave and Optical Technology Letters (John Wiley & Sons). DOI