BARCELONA
DATA SHEET
2 0 1 7
MAIN ECONOMIC
INDICATORS FOR THE
Design: Doctor Magenta
Illustrations: Romualdo Faura
3
Table of
Contents
TABLE OF CONTENTS
4
Privileged location
5 Population and surface area
5 Foreign population
6
Easy to get to and well connected
7 Airport
7 Port of Barcelona
8
The engine of a large diversified
economic area
10 Economic activity10 Production specialisation
12 Foreign investment
13 Exports
14 Diversified economic activity
16 Manufacturing and 4.0 industry17 ICT Sector / Information and Communication
18 Retail and commerce
19 Tourism
20 Digital city, creativity, research and
innovation
21 Business innovation and research
23 Creative industries
24 Generating and attracting talent
25 Jobs in Barcelona25 Labour market participation
25 Salaries
26 Universities and business schools
27 Entrepreneurial city with competitive
costs
28 Companies
28 Business creation
29 Property market
29 Prices and costs
30 A compact city with social cohesion
31 Compact city with social cohesion32 Social and solidarity economy
33 Quality of life and sustainability
34 Energy and the environment35 Sustainable mobility
35 Culture and education
4
Catalonia
Barcelona province
Barcelona Metropolitan Region
GDP per capita
Barcelona Metropolitan Area
15,000 15,001 - 20,000 20,001 - 25,000
Barcelona
10.2%
of Spain’s population in theMetropolitan Region
25,001 - 30,000 30,001
European
megaregions
Barcelona-Lyon megaregion
Barcelona lies at the heart of a
mega-region with 27 million inhabitants
7VgXZadcV!l^i]bdgZi]Vc&#+b^aa^dc^c]VW^iVcih!^h i]ZXVe^iVad[8ViVadc^VVcYhiVcYhVii]ZXZcigZd[
V'!*%%`b2bZigdeda^iVcVgZVl^i]VgdjcY*b^aa^dc
eZdeaZ#I]ZjgWVcVgZVVXXdjcih[dg+(#,VcY&%#' d[i]ZedejaVi^dcd[8ViVadc^VVcYHeV^c!gZheZXi^kZan#
>cgZaVi^dciddi]ZgXdchda^YViZYbZigdeda^iVc V\\adbZgVi^dch!i]ZedejaVi^dcd[i]ZbZigdeda^iVc VgZVd[7VgXZadcV^hVWdjidcZ"fjVgiZgd[CZlNdg`Çh! Vai]dj\]^i^h]^\]Zgi]Vci]dhZd[7dhidc!7Zga^cdg BdcigZVa#
I]ZXdhbdeda^iVc!Y^kZghZVcY^ciZgXjaijgVacVijgZd[ 7VgXZadcV^hh]dlcWni]Z[VXii]Vi&+#+d[i]ZX^inÇh gZh^YZcihVgZ[dgZ^\cZgh#
BZigdeda^iVcgZ\^dch\gdlWZndcYi]Z^g\Zd\gVe]^XVa VgZVh!XgZVi^c\bZ\V"gZ\^dchdgedanXZcig^X
bZigdeda^iVcX^i^Zhi]ViWZXdbZi]ZcVijgVaZXdcdb^X jc^id[^cÑjZcXZ^cVeVgi^XjaVg\Zd\gVe]^XVgZV# >cHdji]Zgc:jgdeZ!dcZi]VihiVcYhdji^hi]Z Xdgg^Ydg[dgbZYWZilZZc7VgXZadcV"Andc!l^i]',#( b^aa^dc^c]VW^iVcihVcYegdYjXi^dcldgi]bdgZi]Vc Í,%%!%%%b!eaVX^c\^i^cVh^\c^ÐXVciedh^i^dcVbdc\ i]ZilZakZbZ\V"gZ\^dch^c:jgdeZ#
7VgXZadcVZc_dnhZVhnVXXZhhidaVg\Z!YncVb^X bVg`Zih/cVbZan!i]Z:jgdeZVcJc^dcÇh8dbbdc BVg`Zi!l]^X]\^kZh^iVXXZhhid*&%b^aa^dceZdeaZ# >iVahd[dgbheVgid[i]Zhd"XVaaZYBZY^iZggVcZVc 8dgg^YdgVm^h!VigVch":jgdeZVcigVchedgicZildg` [dg\ddYhl^i]VY^gZXi^beVXidcVcVgZVWdVhi^c\ '*%b^aa^dc^c]VW^iVcih*%d[i]ZedejaVi^dcd[ i]Z:jgdeZVcJc^dc!bZVc^c\Vcn^begdkZbZcihid i]^hXdccZXi^dcl^aaegdk^YZhigViZ\^Xdeedgijc^i^Zh id^cXgZVhZ7VgXZadcVÇhbVg`Zih]VgZ^c\ddYh igVchedgiZY[gdb6h^Vk^Vi]ZX^inÇhedgi#BdgZdkZg! 7VgXZadcVVahdd[[ZghediZci^Vaan^bedgiVcihigViZ\^X gZaVi^dch]^ehl^i])(Xdjcig^Zhi]VibV`Zjei]Z BZY^iZggVcZVcJc^dc!Vbdc\l]^X]lZÐcYgZ\^dchd[ :VhiZgc:jgdeZ!6[g^XVVcYi]ZB^YYaZ:Vhi#
Privileged
location
*
Barcelona’s demographic indicators, 2016
Age structure
12.6%
0-14
65.8%
15-6421.6%
65 and overLife expectancy (2014)
80.5
Men
86.7
Women83.8
TotalBirth rate (2014) Mortality rate (2014)
8.4‰
9.3‰
Fertility rate* (2014)
36.6
‰
* Births per 1,000 women between 15 and 49 years old
Source: Statistics Department of Barcelona City Council, Barcelona’s Public Health Agency Consortium
FOREIGN POPULATION
Percentage of foreigners over the total population
2000 1.9% 2005 14.2% 2007 15.6% 2009 18.1% 2011 17.3% 2013 17.4% 2014 16.7% 2015 16.3% 2016 16.6%
Note: data from January 1st of each year
Source: Barcelona City Council’s Department of Statistics
Foreign residents in Barcelona by country of origin,
2016 (%)
Source: Barcelona City Council’s Department of Statistics
POPULATION AND SURFACE AREA
Population and surface area, January 2016
POPULATION (INHABITANTS)
POPULATION AS % OF SPAIN
SURFACE AREA (KM2)
DENSITY (INHAB/KM2) Metropolitan
region* 4,793,592 10.2% 2,464.4 1,945.1 Catalonia 7,522,596 16.1% 32,108.0 234.3 Spain 46,771,341 100.0% 505,968.4 92.4
* Barcelonès, Baix Llobregat, Maresme, Vallès Oriental and Vallès Occidental Source: Barcelona City Council’s Department of Statistics, Idescat, INE
Population in 20 of the world’s metropolitan agglomerations, 2016
Tokyo 37,750,000 Shanghai 22,685,000 New York 20,685,000 Mexico City 20,230,000 Los Angeles 15,135,000 Buenos Aires 14,280,000 Paris 10,870,000 London 10,350,000 Hong Kong 7,280,000 Toronto 6,550,000 Madrid 6,529,700 San Francisco 5,955,000 Milan 5,270,000 Barcelona 4,891,249 Boston 4,490,000 Berlin 4,085,000 Sydney 4,070,000 Montreal 3,570,000 Seattle 3,475,000 Stockholm 1,510,000
* Estimation in April 2016. For Barcelona, the official population data was taken on January 1st, 2016
Source: Demography World Urban Areas: 12th Annual Edition April 2016
PRIVILEGED LOCATION
Barcelona
1,610,427
inhabitants as % of Spain
3.4%
102.2
km2surface area
15,763.8
inhab/km2+
Malaga
Algeciras Motril Almeria Murcia
Alicante Cartagena Madrid
Irun
Valencia Castellón
Perpignan Marseille Geneva
Bern
Barcelona
Tarragona
Montepellier Avignon
Lyon
Rabat
Freiburg Clobenza Duisburg
Hamburg Copenhagen
Stockholm
Hällsberg Saint Petersburg
Helsinki
Metz Dijon
London
Milan
Genova Brussels
Mediterranean Corridor
FERRMED network
Ports
Transport by Ferry
44.1M
passengers at its airport
in 2016
7
thEuropean Airport
Mediterranean
Corridor
Easy to get to and
well connected
>ciZgbhd[ZXdcdb^XVcYigVchedgi^c[gVhigjXijgZ!i]Z X^inWdVhihVc^ciZgcVi^dcVaV^gedgi!i]Zedgi!igVYZ[V^g [VX^a^i^Zh!i]ZOdcV;gVcXV[gZZigVYZodcZ!VcYVbV_dg ad\^hi^XheaVi[dgbVaal^i]^cVcVgZVd[ÐkZ`^adbZigZh# I]ZhZ[VX^a^i^Zhd[[Zgi]ZediZci^Vad[bV`^c\i]ZX^inV `Znad\^hi^XhXZcigZ^ci]ZBZY^iZggVcZVc#
7VgXZadcVgZ\^hiZgZYVgZXdgY))#&b^aa^dceVhhZc\Zgh Vi^ihV^gedgi^c'%&+!Vg^hZd[&&#'dci]ZegZk^djh nZVg#I]Vc`hidi]^hgZhjai!i]ZX^in_jbeZYi]gZZ edh^i^dchidhiVcYVihZkZci]Vbdc\i]Zide:jgdeZVc V^gedgih^ci]Z6^gedgih8djcX^a>ciZgcVi^dcVagVc`^c\# I]ZYncVb^XcVijgZd[i]ZV^gedgiÇh^ciZgcVi^dcVa eVhhZc\ZgigV[ÐXbZVchi]Vii]^hhZ\bZciVXXdjcih [dgbdgZi]Vcildi]^gYhd[i]ZidiVaeVhhZc\ZgXdjci ,(#'[dgi]ZÐ[i]XdchZXji^kZnZVg#
EdgiVXi^k^ingZ\^hiZgZY'#'b^aa^dcI:JhVcY),#* b^aa^dcidccZhd[[gZ^\]iigVchedgiZY^c'%&+! gZegZhZci^c\VcVccjVa^cXgZVhZd[&)#*VcY(#*! gZheZXi^kZan#
,
EASY TO GET TO AND WELL CONNECTED
AIRPORT
Barcelona Airport
Source: Spanish Airports and Air Navigation (AENA)
Busiest European airports in terms of passenger traffic,
2016
VARIATION (%) 2016/15 London Heathrow (LHR)
75,703,298 +1.0
Paris Roissy (CDG)
65,933,145 +0.3
Amsterdam (AMS)
63,625,664 +9.2
Frankfurt (FRA)
60,786,937 -0.4
Istanbul (IST)
60,119,215 -2.0
Madrid (MAD)
50,420,583 +7.7
Barcelona (BCN)
44,154,693 +11.2
London Gatwick (LGW)
43,109,143 +7.0
Munich (MUC)
42,277,692 +3.2
Rome-Fiumicino (FCO)
41,738,662 +3.3
Source: Airports Council International. Airport Traffic Report, 2016 and the Air Route Development Committee of Barcelona (CDRA)
Barcelona Airport intercontinental flights, 2015
GEOGRAPHIC AREA INCREASE 2014/2015 NUMBER OF PASSENGERS
North America 10.0% 952,580
Africa 4.0% 297,139
Middle East 19.5% 961,211
Latin America 21.7% 1,172,477
Asia 0.3% 155,140
Source: Aena
Barcelona - Madrid high-speed rail
Source: Barcelona City Council Statistics Department
PORT OF BARCELONA
Traffic (millions)
2015 2016
Freight (tonnes) 45.9 47.5
Containers (TEUs *) 2.0 2.2
Passengers 3.7 4.0
* TEU: Measurement of shipping capacity equivalent to one 20-foot container Source: Port Authority
Infrastructure
Surface area Docks and berths
1,081 ha
22 km
Source: Port Authority
Cruise indicators
2015 2016
Cruise passengers 2,541,373 2,683,594
Boarding 684,907 773,623
Disembarking 680,966 782,196
Traffic 1,175,500 1,127,775
Cruise ships 750 758
Source: Port Authority
3,440,000
Intercontinental passengers
39,711,276
2015
3,527.7
2014
118,202
2015
44,154,693
2016
3,717.9
2015
2 h 30 m
132,755
2016
Passengers
Passengers (thousands) Time Freight (tonnes)
+12%
Intercontinentalpassengers
32
Intercontinental8
The engine of a
bWh][Z_l[hi_Ñ[Z
economic area
Barcelona is a dynamic economic
[d]_d[m_j^WZ_l[hi_Ñ[ZijhkYjkh[WdZ
international recognition
7VgXZadcVXdci^cjZhidYZkZade^ihVW^a^inidViigVXi Wjh^cZhhZh!ZbeadnbZci![dgZ^\c^ckZhibZciVcY iVaZciWVX`ZYjeWni]ZX^inÇhhigdc\^ciZgcVi^dcVa edh^i^dc^c\#
I]ZX^ind[7VgXZadcVÇh<gdhh9dbZhi^XEgdYjXi <9ElVhÍ)'!'%%eZgXVe^iV^c'%&*#6XXdgY^c\id Zhi^bViZh[dg'%&*!i]ZY^hig^Wji^dcd[<gdhhKVajZ 6YYZYeZghZXidgh]dlhi]Z^bedgiVcXZd[XdbbZgXZ VcYgZeV^gh&)#+d[i]ZidiVa!Wjh^cZhhhZgk^XZh &'#,!ZYjXVi^dchZgk^XZh!]ZVai]XVgZVcYhdX^Va hZgk^XZh&'#&!]diZahVcYXViZg^c\VcY^c[dgbVi^dc VcYXdbbjc^XVi^dch,#)^cWdi]XVhZh#
>c'%&*!8ViVadc^V\ZcZgViZYV<9Ed[Í'&)!.',b! gZegZhZci^c\&.#.d[HeV^cÇhidiVa#I]ZhVbZnZVg! <9EeZgXVe^iV^c8ViVadc^VlVh&)VWdkZi]Vid[i]Z :jgdeZVcJc^dc#
I]Z<9Ed[7VgXZadcVVcY8ViVadc^V\gZl (#'
(rdfjVgiZgVcY (#*^cgZVaiZgbhgZheZXi^kZan^c'%&+!
l]^X]lZgZi]ZWZhigZhjaihgZXdgYZY^cgZXZcinZVgh#
€42,200
.
Barcelona has an open economy that is
connected to the world
;dgZ^\c^ckZhibZci^cegdYjXi^kZXVeVX^in& in
8ViVadc^VlVhÍ)!.%*b^c'%&*!VcVccjVa^cXgZVhZd[ +&#)VcYi]ZhZXdcY]^\]ZhiÐ\jgZ^ci]Z]^hidg^XVa YViVhZg^Zh#;9>\gdli]^c8ViVadc^V^hXaZVganhjeZg^dg idi]VihZZc^cHeV^c!l]ZgZi]^h^cY^XVidgh]dlZYVc ^cXgZVhZd[&-#*XdbeVgZYid'%&)#
;jgi]ZgbdgZ!VXXdgY^c\idVgZXZci;9>BVg`ZihgZedgi ejWa^h]ZYWni]Z;^cVcX^VaI^bZh!WZilZZc'%&& VcYi]ZÐghi]Va[d['%&+!8ViVadc^VlVhi]ZgZ\^dc i]Vi]VYi]ZaVg\ZhicjbWZgd[[dgZ^\c^ckZhibZci egd_ZXih^cHeV^c!l^i]+%&egd_ZXih(,d[HeV^cÇh idiVal]^X]^ckdakZYVidiVa^ckZhibZcid[Í&)!*('b! XgZVi^c\(-!(-*Y^gZXi_dWhVXXdjci^c\[dg(&VcY ()d[HeV^cÇhgZhjaihVhVl]daZ!gZheZXi^kZan#
7VgXZadcVÇhViigVXi^kZcZhh[dg[dgZ^\c^ckZhibZci ]VhWZZcXdcÐgbZYWnhZkZgVaegZhi^\^djhgVc`^c\h/ i]Z<adWVa8^i^Zh>ckZhibZciBdc^idg'%&+Wn @EB<eaVXZh7VgXZadcV^cZ^\]i]edh^i^dcVbdc\ i]ZbV^cjgWVcVgZVh^ci]ZldgaY^ciZgbhd[ ViigVXi^c\[dgZ^\c^ckZhibZciegd_ZXih^ci]ZeZg^dY '%&'"'%&+!gZXdgY^c\bdgZi]Vc*%%\gZZcÐZaY egd_ZXih0Vahd!VXXdgY^c\idi]Z6iigVXi^kZcZhh HjgkZn:jgdeZ'%&+!Wn:gchiVcYNdjc\!7VgXZadcV ^hi]ZÐ[i]bdhiViigVXi^kZX^indci]ZXdci^cZci[dg ^ciZgcVi^dcVa^ckZhibZcihV[iZgAdcYdc!EVg^h!7Zga^c VcY6bhiZgYVb!WjiV]ZVYd[Bjc^X]!;gVc`[jgiVcY BVYg^Y#
>c'%&+7VgXZadcVlVhX]dhZcVhi]ZX^inl^i]i]Z WZhi^ciZgcVi^dcVaWjh^cZhhegdbdi^dc^ci]ZldgaYÇh ide&')gZ\^dchWn[9^BV\Vo^cZ!l]^X]^hejWa^h]ZYWn i]Z;^cVcX^VaI^bZh\gdje#>ci]ZÐghiZY^i^dcd[i]Z[9^ HigViZ\n6lVgYh!i]ZbV\Vo^cZVlVgYZYi]Z]^\]Zhi gVi^c\id7VgXZadcV8^in8djcX^aÇh9ZeVgibZcid[8^in Egdbdi^dc!bV`^c\^ii]ZWZhi^ckZhibZciegdbdi^dc V\ZcXnd[i]ZnZVg#
1 Investments in productive capacity do not take into account investments in holding companies, which are companies set up in Spain, and whose objective is to hold shares in foreign companies. The operations of these types of companies involve transfers within the same corporate group. The existence of the holding company is due to tax optimization strategies within the same group.
8ViVadc^V^h]dbZidbdgZi]Vc+!)*%[dgZ^\c
XdbeVc^Zh#I]ZbV^cXdjcig^Zhd[dg^\^cd[i]ZhZÐgbh VgZ<ZgbVcn&'#+!;gVcXZ&'#'VcYi]ZJH6 &&#&#
>c'%&+!Zmedgih[gdbi]Zegdk^cXZd[7VgXZadcV gZVX]ZYVkdajbZd[Í*&!'+(#.b!gZegZhZci^c\ "[dgi]Zh^mi]XdchZXji^kZnZVg"VcZlgZXdgY^ci]Z ]^hidg^XVaYViVhZg^Zh#8dbeVgZYidi]ZegZk^djh nZVg!7VgXZadcVÇhZmedgihVaZh\gZlWn'#'!Vh^b^aVg Ð\jgZidi]dhZd[8ViVadc^VVcYHeV^c 'VcY&#. gZheZXi^kZan\^kZci]ZWVX`Ygded[:jgdeZVc8ZcigVa 7Vc`ZmeVch^dcVgnbZVhjgZh!i]ZYZegZX^Vi^dcd[i]Z ZjgdVcYdkZgVaa^begdkZbZcih^cXdbeZi^i^kZcZhh#
&%
ECONOMIC ACTIVITY
Gross domestic product at market prices (GDP), 2015 (current prices in million €)
GDP GDP PER INHABITANT
MILLIONS OF EUROS THOUSANDS OF EUROS INDEX CATALONIA-100
Barcelona 66,952.2 42.2 146.0
Barcelona Metropolitan
Region* 142,433.1 30.2 108.4
* GDP 2014. Base 2010. Value at market prices Source: Statistics Institute of Catalonia
Gross domestic product at market prices, 2015 (current prices in million €)
CATALONIA SPAIN (%) CAT/SP
2011 209,716 1,070,413 19.6
2012 204,727 1,042,872 19.6
2013 203,241 1,031,272 19.7
2014 206,776 1,041,160 19.9
2015 214,927 1,081,190 19.9
Source: Statistics Institute of Catalonia
GDP per capita in purchasing power parity, 2015
125 100 75 50 25 0
Catalonia Spain Eurozone
Index EU 28 = 100
Source: Statistics Institute of Catalonia
GDP growth at constant prices in Barcelona,
2010-2015 (rate of change in volume %)
4 3 2 1 0 -1 -2 -3
2011 2012 2013 2014 2015
Barcelona Catalonia
Source: Technical Programming Office at Barcelona City Council and Idescat
PRODUCTION SPECIALISATION
Production structure. Employees by economic sector,
2016 (%)
BARCELONA BMR CATALONIA SPAIN
Agriculture 0.0 0.1 0.3 0.4
Industry 7.5 14.2 16.4 14.2
Construction 2.6 3.9 4.5 5.1
Services 89.9 81.8 78.7 80.3
TOTAL 100.0 100.0 100.0 100.0
Source: Statistics Department at Barcelona City Council, INSS and the Ministry of Employment and Social Security
Structure of GVA in terms of branches of the economy of Barcelona, 2015 (% on total)
Retail and commerce
14.6 Business Services 12.7 Information and communication 7.4
Hotels and catering
7.4
Transportation and storage
6.4
Health and social services 6.1 Education 6.0 Public administration 5.5 Real estate activities (without rentals) 4.8 Financial and insurance 4.7 Manufacturing 4.4 Other services 3.1 Construction 3.0
Energy, water and waste
2.4
Artistic and recreational activities
2.4
&&
Companies classified by economic sectors in Barcelona,
2016 (% on total)
Business services 27.1
Retail and commerce and repairs 18.4
Education, health and social services 10.1
Real estate activities 8.2
Construction 8.2
Hospitality 6.4
Other services 4.8
Transport and storage 4.7
Information and communication 3.7
Arts, culture and entertainment 2.9
Manufacturing 2.9
Financial and insurance 2.2
Energy and water 0.4
* Business services include professional, scientific and technical, administrative and auxiliary services
Source: DIRCE, INE
&'
Number of foreign companies set up in Catalonia
HOME COUNTRY 2015 % S/ TOTAL
Germany 811 12.6
France 785 12.2
United States of America 715 11.1
Netherlands 671 10.4
Italy 564 8.7
United Kingdom 447 6.9
Luxembourg 387 6.0
Switzerland 334 5.2
Denmark 261 4.0
Belgium 145 2.2
Japan 140 2.2
portugal 137 2.1
Sweden 95 1.5
Austria 64 1.0
Ireland 63 1.0
Other 835 12.9
TOTAL 6.454 100
Source: Invest in Catalonia. Acció 10
Investment abroad (million €)
2014 2015* % CAT/SPAIN
Catalonia
4,390.8
4,578.2
Spain
30,405.8
30,360.1
* Provisional data
Note: Total gross investment not including holding companies Source: Datainvex. Ministry of Economy and Competitiveness
FDI in the main urban areas of the world, 2016
URBAN AREA 2012 - 2016 FDI PROJECTS
London 1 1,663
Shanghai 2 1,209
Hong Kong 3 943
São Paulo 4 819
New York 5 750
Paris 6 699
Sydney 7 647
Barcelona 8 501
Beijing 9 490
Dublin 10 489
Source: Global Cities Investment Monitor 2016, KPMG
FOREIGN INVESTMENT
Foreign investment (million €)
2014 2015 % CAT/SPAIN
Catalonia
3,038.2
4,905.0
Spain
20,106.6
23,823.8
Note: Total gross investment not including holding companies Source: Datainvex. Ministry of Economy and Competitiveness
Foreign investment in Catalonia by country of origin,
2015 (percent of total)
Netherlands
20.6%
France
15.5%
Luxembourg
15.0%
Germany
10.5%
United Kingdom
5.6%
Mexico
4.8%
Switzerland
3.8%
Ireland
3.8%
United States
3.0%
China
2.6%
United Arab Emirates
2.3%
Peru
1.7%
Note: Total gross investment not including holding companies Source: Datainvex. Ministry of Economy and Competitiveness
&(
EXPORTS
Exports (million €)
2015 2016* PERCENT / SPAIN 2016
Barcelona
50,166.5
51,263.9
Catalonia
63,885.2
65,141.9
Spain
249,794.4
254,530.2
* Provisional data for Barcelona province Source: Ministry of Economy and Competitiveness
Export trends from the province of Barcelona,
1996 - 2016 (million €)
1996 1998 2000 2002 2004 2006 2008 2010 2012 2014 2016*
* Provisional data
Source: Ministry of Economy and Competitiveness
Main destination countries of Barcelona exports, 2016 (percent of total)*
France
14.8%
Germany
12.3%
Italy
8.9%
Portugal
6.7%
United Kingdom
5.8%
Switzerland
4.0%
United States
3.4%
Netherlands
2.8%
China**
2.5%
Mexico
2.2%
Turkey
2.1%
* Provisional data for Barcelona province ** Includes China, Hong Kong and Macao Source: Ministry of Economy and Competitiveness
Distribution of exports from the province of Barcelona, according to technology level, 2016*
* Provisional data.
Source: Ministry of Economy and Competitiveness
THE ENGINE OF A LARGE DIVERSIFIED ECONOMIC AREA
High-technology
12.0%
Medium-high technological level
49.5%
Medium-low technological level
14.8%
Low technological level
22.9%
Not rated
0.7%
20.1%
25.6%
&) Industry
accounts for
of total GVA in Catalonia
19.6%
7dWh[Wm_j^Wijhed]_dZkijh_WbXWi[
>c'%&*i]Z^cYjhig^VahZXidg\ZcZgViZY&.#+d[ 8ViVadc^VÇhidiVa<gdhhKVajZ6YYZY!VeZgXZciV\Zi]Vi ^hVWdkZi]Z:jgdeZVcJc^dcVkZgV\Z&.#'VcY XaZVgan]^\]Zgi]Vci]ZgViZ[dgHeV^c&,#8ViVadc^V ^hi]ZidegZ\^dc^cHeV^c^ciZgbhd[^cYjhig^Va YZkZadebZci#
8ViVadc^V^hi]ZÐ[i]idegZ\^dc^c:jgdeZ^ciZgbhd[ ZbeadnbZci^c]^\]"iZX]^cYjhig^Zh!l^i]'%*!%%% ZbeadnZZhldg`^c\^ci]ZhZVXi^k^i^Zh^c'%&*!VWdkZ di]ZggZ\^dcha^`ZE^ZYbdciIjg^c!G]cZ"6aeZh Andcdg9VgbhiVYi;gVc`[jgi#
7VgXZadcV]VhVh^\c^ÐXVci^cYjhig^VahZXidg
VXXdjci^c\[dg&)#'d[Vaa_dWh^c8ViVadc^V!^cXajY^c\ XdbeZi^i^kZXajhiZgh#DjihiVcY^c\ZmVbeaZhVgZi]Z X]Zb^XVaVcYe]VgbVXZji^XVahZXidgh!XVgegdYjXi^dc "l^i]i]^hWZ^c\dcZd[i]ZaZVY^c\bVcj[VXijg^c\ VgZVh^c:jgdeZ"![ddY!eVeZgVcY\gVe]^XVgihVcY lVhiZigZVibZci#
7VgXZadcVVcY^ih]^ciZgaVcY^hYZkZade^c\V)#% ^cYjhig^VahZXidgWVhZYdc7^\9ViV!VcYV\gdl^c\ cjbWZgd[XdbeVc^ZhVcYdg\Vc^hVi^dchVgZ YZkZade^c\^c^i^Vi^kZhgZaViZYid(9eg^ci^c\VcY bVcj[VXijg^c\VhhdX^Vi^dchVgZegdbdi^c\Y^\^iVa bVcj[VXijg^c\Vbdc\hihX]ddah!XdbeVc^Zh! ZcigZegZcZjghVcYXdbbjc^inegd_ZXih#I]ZX^inÇh EdWaZcdjcZ^\]Wdjg]ddY]VhWZXdbZi]ZXZcigZ[dgV BV`Zg9^hig^Xie^adiegd_ZXi!i]ZegdidineZd[VcdeZc! XdaaVWdgVi^kZ!YZbdXgVi^X!egdYjXi^kZ!^ccdkVi^kZX^in i]VijhZhX^gXjaVgYZkZadebZciWn^beaZbZci^c\V cZlineZd[^cYjhig^Vaeda^Xn#
:_l[hi_Ñ[Z
&*
Barcelona is committed to local and
gkWb_joYecc[hY[
L^i]&+!(+,XdbeVc^ZhVcY&).!)+-ZbeadnZZh!i]Z gZiV^aigVYZ^hdcZd[i]Zbdhi^bedgiVcihZXidgh^c 7VgXZadcVÇhZXdcdbn#>cYZZY!i]^hhZXidgVXXdjciZY [dg'&#.d[VaaXdbeVc^ZhVcY&)#*d[_dWh^ci]Z X^inVii]ZZcYd['%&+#
I]ZcjbWZgd[gZiV^aegZb^hZhVcYZViZg^ZhlVh (*!-()^c'%&+!l]^X]VXXdjcih[dg&,#(d[i]ZX^inÇh idiVaXdjci#
I]ZX^inÇhbjc^X^eVabVg`Zih!l^i]VidiVahjg[VXZ
VgZVd[bdgZi]Vc'+%!.)&b2VcY'!))'hiVaah!VgZ
[jcYVbZciVa[dgi]ZX^inÇhgZiV^abdYZaWZXVjhZ d[i]Z^gZXdcdb^XVcYhdX^Va^bedgiVcXZVii]Z cZ^\]Wdjg]ddYaZkZa07VgXZadcV]Vhi]ZaVg\Zhi cZildg`d[[ddYbVg`Zih^cXdci^cZciVa:jgdeZ#
6XXdgY^c\idi]ZX^inÇh9ZXZbWZg'%&*Bjc^X^eVa Dbc^WjhhjgkZn!+'#+d[eZdeaZ^c7VgXZadcV ejgX]VhZYegdYjXihdkZgi]Z>ciZgcZiVihdbZed^ci! l]^X]gZegZhZcihVXdch^YZgVWaZ^cXgZVhZ^ci]ZjhZ d[i]^hX]VccZaXdbeVgZYidi]ZegZk^djhnZVg ,#-eZgXZciV\Zed^cihVcYi]Z]^\]ZhiaZkZah^cXZi]Z YViVhZg^ZhWZ\Vc#
?dj[hdWj_edWbX[dY^cWha_dkhXWdjekh_ic
and the organisation of conferences
I]ZcjbWZgd[idjg^hihhiVn^c\Vi7VgXZadcVÇh]diZah hiddYVi,#*b^aa^dck^h^idghVcYdkZgc^\]ihiVnh idiVaaZY&.#*b^aa^dc^c'%&+!Vg^hZd[*#+VcY*#* gZheZXi^kZanXdbeVgZYid'%&*#
KVg^djhgVc`^c\h]^\]a^\]ii]ZViigVXi^kZcZhhd[ 7VgXZadcV[dg[dgZ^\ck^h^idgh#I]Z:jgdeZVc8^i^Zh BVg`Zi^c\7ZcX]bVg`^c\GZedgi'%&*$'%&+gVc`h 7VgXZadcV[djgi]^c:jgdeZ^ciZgbhd[^ciZgcVi^dcVa dkZgc^\]ihiVnh!l]^aZ[dgIg^e6Yk^hdg^ilVhi]Z ldgaYÇhZaZkZci]bdhiViigVXi^kZYZhi^cVi^dc[dg idjg^hih^c'%&+#;^cVaan!Ide9Zhi^cVi^dc8^i^ZhgZedgi Wn:jgdbdc^idg>ciZgcVi^dcVagVc`ZY7VgXZadcVi]Z
'*i]bdhik^h^iZYX^inWn^ciZgcVi^dcVaidjg^hih[gdbV
idiVad[&%%X^i^Zh^ci]ZldgaYVcY:jgdeZÇh-i] most
k^h^iZYX^in^c'%&*#
GZ\VgY^c\Wjh^cZhhidjg^hb!VXXdgY^c\idi]Z >ciZgcVi^dcVa8dc\gZhhVcY8dckZci^dc6hhdX^Vi^dc >886!^c'%&*7VgXZadcVlVhi]Zi]^gYideX^in^ci]Z ldgaY^ciZgbhd[cjbWZgd[^ciZgcVi^dcVaXdc[ZgZcXZh dg\Vc^oZY"WZ]^cY7Zga^cVcYEVg^h"VcYVahdl^i] gZheZXiidi]ZcjbWZgd[YZaZ\ViZh]dhiZYdcan WZViZcWnK^ZccVVcYAdcYdc#
>c'%&+!7VgXZadcVgZXZ^kZY'#,b^aa^dcXgj^hZ eVhhZc\Zgh!bZVc^c\^i`Zei^ihedh^i^dcVhi]Zide ijgcVgdjcYedgi^c:jgdeZVcYi]ZBZY^iZggVcZVc[dg Xgj^hZh0^i^hi]Z[djgi]ideWVhZedgi^ci]ZldgaY!idd#
Commitment to digital technology and ICTs
I]ZX^in]VhbdgZi]Vc*&!%%%_dWhVcYVWdji'!*%% XdbeVc^Zhl^i]ZbeadnZZh^ci]Z>8IhZXidg!bV`^c\ ^ii]Z]ZVgid[8ViVadc^VÇh>IhZXidgl^i]*,VcY )-"gZheZXi^kZan"d[i]ZgZ\^dcÇhZbeadnbZciVcY XdbeVc^Zh^ci]ZhZVXi^k^i^Zh#>c'%&*!Zhi^bViZhh]dl i]Vii]Z^c[dgbVi^dcVcYXdbbjc^XVi^dchhZXidg! l]^X]^cXajYZh>8Ih!\ZcZgViZY,#)d[7VgXZadcVÇh <gdhhKVajZ6YYZY#
DkZg.%d[eZdeaZ^c7VgXZadcV]VkZ>ciZgcZi ^ci]Z^g]dbZh!VcYcZVgan.djid[&%[gZfjZcian XdccZXi#>c[VXi!VXXdgY^c\idVhijYndci]ZY^\^iVa Y^k^YZ^c7VgXZadcVWni]ZBdW^aZLdgaY8Ve^iVa!i]Z X^inÇhgZh^YZcihVgZVWdkZVkZgV\Z[dgi]Z:jgdeZVc Jc^dc!HeV^cVcY8ViVadc^V^ciZgbhd[XdccZXi^k^in VcY[gZfjZcXnd[>ciZgcZijhZ!Vai]dj\]i]ZgZVgZ h^\c^ÐXVciY^[[ZgZcXZhWZilZZccZ^\]Wdjg]ddYh!a^`Z i]ZY^[[ZgZcXZWZilZZcAZh8dgih.+d[]djhZ]daYh XdccZXiZYidi]ZcZiVcYIdggZ7Vg+'#
DIVERSIFIED ECONOMIC ACTIVITY
top city in the world in terms of number
of international conferences
organised
&+
MANUFACTURING AND 4.0 INDUSTRY
Weight of industry in terms of GVA, 2015 (%)
19.6 17.0 19.0
20
15
10
5
Catalonia Spain EU
Source: Idescat
People employed in high-tech industries in European regions, 2015
REGION (CITY) HIGH-TECH INDUSTRIES EMPLOYMENT AS % OF TOTAL
EMPLOYMENT
HIGH-TECH INDUSTRIES EMPLOYMENT
(THOUSANDS)
Stuttgart (Stuttgart) 19.5 412
Lombardy (Milan) 9.4 399
Upper Bavaria (Munich) 12.6 305
Istanbul (Istanbul) 4.2 221
Catalonia (Barcelona) 6.7 205
Karlsruhe (Karlsruhe) 14.4 200
Piedmont (Turin) 11.2 200
Emilia-Romagna (Bologna) 9.9 188
Düsseldorf (Düsseldorf) 7.7 184
Rhône-Alpes (Lyon) 5.9 161
Cologne (Cologne) 7.4 154
Ile De France (Paris) 2.9 153
Darmstadt (Frankfurt) 7.9 153
Source: Eurostat
Main sectors of industry in terms of jobs* in Catalonia and the Metropolitan Area, 4th quarter 2016
Metallurgy and manu-facture of machinery and electrical and electronic equipment
124,367 78,427
Chemical and
pharmaceutical industry 90,47862,975
Transport equipment
and metal products 43,136 32,948
Food 81,107
26,861
Paper and printing 39,987
23,673
Textile, clothing, leather
and footwear 34,25622,568
Catalonia Metropolitan area
* Affiliates of the General and Self-Employed Social Security Schemes
Source: Economic Policy and Local Development Research Department of the Barcelona City Council based on data from the Statistics Department of Barcelona City Council
3D printing Ecosystem: entities in Catalonia
DEFINITION NUMBER
Companies that use 3D printing for product development +100
Entities that provide engineering and design for 3D printing
and other technologies +100
Facilitators: organisations that transfer technology, training
and consultancy 40
Service providers of 3D printing (Service Bureaux) 15
RTD centres working on 3D printing 14
Intermediaries (distributors and shops) and certification and
technical services 12
Organisations that adopt 3D printing to some extent for making
final pieces 11
Companies that design and / or manufacture 3D printers 9
FabLabs 8
Related companies in this business model (above), whose
manufacturing is based on 3D printing 6
Manufacturers of materials and supplies 5
Software providers (design, control, ...) and systems integration 4
Associations, clusters and technological platforms 3
Creators of digital platforms for meeting demand and supply
(marketplaces) 0
Source: Impact and potential of 3D printing in employment, October 2015, by Barcelona City Council
Industrial and economic development zones
Source: Metropolitan Area of Barcelona (AMB)
Llobregat axis
B-30 Corridor
Besòs Llobregat
&, ICT SECTOR / INFORMATION AND COMMUNICATION
Household ICT penetration
(% on population 16 to 74 years)
2014 2015 VARIATION 2015-2014
They have a computer at home
86.3
88.3
Internet connection at home
85.3
90.6
Frequent use of Internet
80.1
87.0
Source: Survey on equipment and use of information and communication technologies in homes
Employees* in ICT activities in Barcelona
39,767 38,388 39,122 44,215 48,479 51,510
2011 2012 2013 2014 2015 2016
* Affiliates in the General and Self-Employed Social Security Schemes
Source: Economic Policy and Local Development Research Department based on data from the Department of Statistics, Barcelona City Council
Internet use according to the level of disposable household income (DHI) at the neighbourhood level
LOW
MEDIUM-LOW MEDIUM MEDIUM-HIGH HIGH Reading the news on the
Internet 79% 86% 86% 84% 92% Carrying out banking
transactions 49% 63% 63% 70% 74% Purchasing online 45% 51% 56% 56% 63%
Source: MWCapital
Digital divide
0-10% 10-20% 20-30% 30-40% +40%
Source: Mobile World Capital Barcelona (2016), The digital divide in the city of Barcelona
DIVERSIFIED ECONOMIC ACTIVITY
Distribution of advanced digital profile according to the income level of neighbourhoods
+6.9% +5.3% +2.0%
in the ICT
sector
50,000 jobs
&-Trends in internet purchases in Barcelona, 2000-2015 (consumers in %)
2000 2003 2006 2009 2012 2015
Source: Barcelona City Council, Municipal Omnibus Survey, Department of Commerce and Consumer Affairs. December 2015
RETAIL AND COMMERCE
Retail and commerce in Barcelona Trade 2016
16,367
Number of firms
149,468
Jobs35,834
Number of retail premises and eateries (2016)
Local markets 2015
39
Food markets
4
Special markets2,442
Number stalls
260,941 m
2
Total
* Data from the 4th quarter
** Average sales per month and property
Source: INSS, Department of Statistics and the Municipal Markets Institute of the City of Barcelona
62.6
&.
TOURISM
Tourists and overnights in Barcelona
2015 2016 VARIATION 2015/16
Tourists*
7,090,246
7,490,635
Overnights
18,537,358 19,547,870
* Tourists staying in hotels
Source: Department of Statistics, Barcelona City Council
Hotel indicators
2015 2016 VARIATION 2015/16
Number of hotels
634
641
Places (beds)
75,032
75,647
Source: Department of Statistics, Barcelona City Council
Origin of tourists, 2016
Source: Department of Statistics, Barcelona City Council
Congress indicators, 2015
2,268
Total meetings
311
Congresses121
Conferences and courses
1,836
Conventions and Incentives
589,818
Total delegates
Source: Turisme de Barcelona and the Department of Statistics, Barcelona City Council
Number of delegates and international meetings in world cities, 2015
CITY DELEGATES 2015 CONGRESSES 2015 CITY
Vienna 124,899 195 Berlin
London 117,397 186 Paris
Barcelona 108,961 180 Barcelona
Berlin 104,299 178 Vienna
Singapore 77,105 171 London
Paris 75,470 171 Madrid
Copenhagen 75,269 156 Singapore
Prague 73,896 148 Istanbul
Vancouver 72,935 145 Lisbon
Amsterdam 72,529 138 Copenhagen
Source: International Congress and Convention Association Statistics Report, 2015
Main trade fairs at Fira de Barcelona that are benchmarks in Europe, 2015
Saló Internacional de l’Automòbil
Mobile World Congress
Saló de l’Ensenyament
Expo Sports
Piscina Bcn. Saló Internacional de la piscina
Beyond Building Barcelona Construmat
Saló Nautic Internacional de Barcelona
Expo Ecosalud
Barcelona Meeting Point
Smart-City Expo World Congress
4Yfn - Four Years From Now,
Mobile entrepreneurship event to develop mobile ideas and startups
Biz Barcelona
Iot. Solutions World Congress
Saló Internacional de la Logistica
Source: Fira de Barcelona. Business-related trade fairs with the largest number of visitors
DIVERSIFIED ECONOMIC ACTIVITY
Spain
21.0%
United Kingdom
9.0%
United States
8.4%
France
8.4%
Italy
6.4%
Germany
6.0%
+5.6%
+5.5%
+1.1%
'%
Digital city,
creativity,
research and
innovation
8WhY[bedW"^kX\ehZ_]_jWb[djh[fh[d[khi^_f
7VgXZadcVlVcihidWZVaZVYZg^ci]ZÐZaYd[
iZX]cdad\nid^begdkZeZdeaZÇhfjVa^ind[a^[Z!ZheZX^Vaan \^kZcV\adWVaXdciZmi^cl]^X]bdW^aZiZX]cdad\n ^hZbZg\^c\VhV`Zn[VXidg[dgZXdcdb^X\gdli]# 7VgXZadcVÇhgdaZVhi]ZBdW^aZLdgaY8Ve^iVa!]dhi^c\ i]ZBdW^aZLdgaY8dc\gZhhVcY^ihegd_ZXiidXgZViZVc ^cYjhig^VaaZ\VXn^ci]^hhZXidg!d[[ZghVigZbZcYdjh higViZ\^Xdeedgijc^in[dgi]ZX^in#
7VgXZadcV^hi]Zc^ci]bdhiViigVXi^kZ:jgdeZVc X^in[dgY^\^iVaZcigZegZcZjgh!]Vk^c\Xa^bWZYÐkZ edh^i^dch^ci]ZgVc`^c\^cdcZnZVg#I]ZgVc`^c\ add`hVii]ZXdcY^i^dchVcYhjeedgid[[ZgZYWni]Z X^inidcZliZX]cdad\negd_ZXih^ci]ZY^\^iVahZXidg :jgdeZVc9^\^iVa8^in>cYZm'%&+#6ahd!i]ZX^in^hÐ[i] ^cVgVc`^c\d[:jgdeZVcX^i^Zh^ciZgbhd[hiVgi"je cjbWZgh!VXXdgY^c\idI]Z:jgdeZVcIVaZciAVcYhXVeZ! ejWa^h]ZYWn7VaYZgidc8Ve^iVa#
I]ZX^inVXXdjcih[dg'-#)d[VaaHeV^cÇhY^\^iVahiVgi" jeh!l^i]Z"XdbbZgXZVXXdjci^c\[dgVh^\c^ÐXVci Vbdjcid[Ðgbh'&![daadlZYWnbdW^aZVcY Wjh^cZhhhZgk^XZh"ZVX]VXXdjci^c\[dg&%"l]^aZ Y^\^iVahdX^VaZcigZegZcZjgh]^eVcYidjg^hbXdbeVc^Zh gZegZhZci.#
>c'%&+!i]Z7VgXZadcVVgZV\ZcZgViZY&)#'d[Vaa ji^a^inbdYZaVeea^XVi^dchVcY&(#)d[VaaeViZcih^c HeV^c#8ViVadc^V]Vhi]Z]^\]ZhicjbWZgd[^ccdkVi^kZ XdbeVc^Zh^cHeV^c')!&VcYVXXdjcih[dg')#(d[ VaaHeV^cÇhZmeZcY^ijgZdc^ccdkVi^dcVXi^k^i^Zh#
7VgXZadcVlVhÐ[i]VcYhZkZciZZci]^c:jgdeZVcYi]Z ldgaYgZheZXi^kZan^ciZgbhd[^ihhX^Zci^ÐXdjieji^c '%&*!VXXdgY^c\idVhijYnWni]ZEdaniZX]c^XJc^kZgh^in d[8ViVadc^VJE8WVhZYdci]ZHX^ZcXZ8^iVi^dc>cYZm#
HeZcY^c\dcG9^c8ViVadc^VhiddYVi&#*'d[<9E^c '%&*!l]^X]^hadlZgi]Vci]ZVkZgV\Zd[i]Z:jgdeZVc Jc^dcWji]^\]Zgi]Vci]Vid[HeV^cVcYgZ\^dcha^`Z AdbWVgYnVcYAdcYdc#I]ZgZlZgZ))!-'+ZbeadnZZh ldg`^c\^cgZhZVgX]VcYYZkZadebZci^c8ViVadc^V#
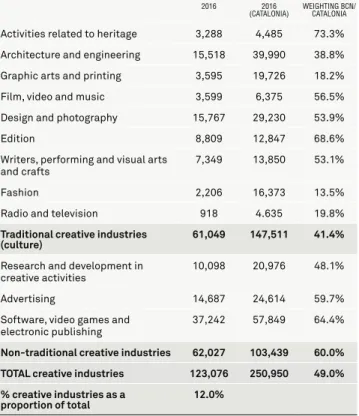
I]ZXgZVi^kZ^cYjhig^ZhVXXdjciZY[dgbdgZi]Vc &'(!%%%_dWh^c7VgXZadcV^c'%&+!gZegZhZci^c\&' d[Vaai]dhZZbeadnZY^ci]ZX^inVcY]Va[).d[Vaa XgZVi^kZhZXidg_dWh^c8ViVadc^V#Hj[ÐXZidhVni]Vi! VXXdgY^c\idi]ZbdhigZXZcigZhZVgX]dcX^i^Zh!]^\]Zg eZgXZciV\Zhd[eZdeaZZbeadnZY^cXgZVi^kZ^cYjhig^Zh XdggZaViZl^i]]^\]ZgdjiejieZgXVe^iV#
Barcelona in the
cities for digital entrepreneurship according to European Digital City Index 2016
'&
BUSINESS INNOVATION AND RESEARCH
Business and innovation
NUMBER OF INNOVATIVE
COMPANIES TOTAL EXPENDITURE ON INNOVATION ACTIVITIES 2015 % O/SPA 2015 (1,000s €) % O/SPA
Catalonia 3,798 24.1 3,324,467 24.3
Spain 15,736 100.0 13,674,177 100.0
Source: INE
Innovation indicators
PATENT APPLICATIONS UTILITY MODELS APPLICATIONS
2016 % O/SPA 2016 % O/SPA
Barcelona* 380 13.4 345 14.2
Catalonia 453 16.0 439 18.1
Spain 2,837 100.0 2.422 100.0
* Provincial data
Source: Spanish Office of Patents and Trademarks
European Digital Cities, 2016
CITY GLOBAL INDEX 2015 GLOBAL INDEX 2016
London 1 1
Stockholm 3 2
Amsterdam 2 3
Helsinki 4 4
Paris 6 5
Berlin 7 6
Copenhagen 5 7
Dublin 8 8
Barcelona 14 9
Vienna 15 10
Munich 10 11
Cambridge 11 12
Bristol — 13
Madrid 12 14
Oxford 13 15
Manchester — 16
Brussels 9 17
Tallinn 20 18
Edinburgh — 19
Hamburg — 20
Lyon — 21
Aarhus — 22
Birmingham — 23
Lisbon 17 24
Frankfurt — 25
Eindhoven — 26
Utrecht — 27
Cologne 23 28
Malmo — 29
Uppsala — 30
Source: European Digital City Index (Nesta and the European Digital Forum think tank)
European Digital City Index, 2016
(positioning of the city per variable)
Barcelona London
Source: European Digital City Index (Nesta and the European Digital Forum think tank)
DIGITAL CITY, CREATIVITY, RESEARCH AND INNOVATION
Competencies and
qualifications Access to capital
Mentoring and managerial assistance
Entrepreneurial culture
Digital infrastructure
Knowledge promotion Style
of life
Index
Technology market
Business environment Non-digital
infrastructure
47
9 7 12
30 36 39 39 41
22
Top 10 European cities according to the number of start-ups
RANKING 2016 CITY
1 London 2 Berlin 3 Paris 4 Amsterdam 5 Barcelona 6 Madrid 7 Stockholm 8 Dublin 9 Copenhagen 10 Milan
Source: Balderton. The European Talent Landscape, 2016
Digital start-up ecosystem in Barcelona (%)
Source: StartUp Explore/European StartUp Monitor, Mobile World Capital
Expenditure on R&D (% on GDP)
Berlin* 3.55% Rhône-Alpes* 2.76% USA* 2.73% China** 2.05% European Union 2.03% Catalonia 1.52% Lombardy** 1.33% Spain 1.22% London** 1.06%
* 2013 data ** 2014 data Sources: INE and Eurostat
International benchmark science and technology facilities in Barcelona
Barcelona Supercomputing Center - National Supercomputing Center (BSC-CNS)
Maritime Research and Experimentation Channel (ICES)
Institute of Photonic Sciences (ICFO)
Nuclear Magnetic Resonance Laboratory of Barcelona (LRB)
White Room of the Institute of Microelectronics of Barcelona (IMB-CNM)
ALBA Synchrotron - Cells
National Center for Genome Analysis (CNAG)
Source: Ministry of Education and Science, Map of Unique Science and Technology Facilities
Top cities in the world for academic scientific output, 2015
WORLD RANKING EUROPEAN RANKING CITY PUBLICATIONS 2015*
1 Beijing 71,322
2 1 London 42,304
3 Shanghai 35,385
4 New York 32,793
5 Seoul 32,637
6 Boston 32,010
7 Tokyo 30,347
8 2 Paris 30,252
9 3 Madrid 18,678
10 Baltimore 17,771
11 4 Moscow 17,506
12 Chicago 17,446
13 Toronto 17,369
14 Houston 17,144
15 Cambridge (USA) 17,076
16 Philadelphia 17,034
17 5 Barcelona 17,024
18 Los Angeles 16,911
19 São Paulo 15,955
20 6 Rome 15,927
21 Melbourne 15,470
22 7 Milan 14,573
23 8 Berlin 14,564
24 Singapore 14,223
25 Hong Kong 13,239
* Data as of 26 May 2016
23 CREATIVE INDUSTRIES
Employment in creative activities* in Barcelona, 2016
2016 2016
(CATALONIA) WEIGHTING BCN/CATALONIA Activities related to heritage 3,288 4,485 73.3% Architecture and engineering 15,518 39,990 38.8% Graphic arts and printing 3,595 19,726 18.2% Film, video and music 3,599 6,375 56.5% Design and photography 15,767 29,230 53.9% Edition 8,809 12,847 68.6% Writers, performing and visual arts
and crafts
7,349 13,850 53.1%
Fashion 2,206 16,373 13.5% Radio and television 918 4.635 19.8% Traditional creative industries
(culture) 61,049 147,511 41.4% Research and development in
creative activities
10,098 20,976 48.1%
Advertising 14,687 24,614 59.7% Software, video games and
electronic publishing
37,242 57,849 64.4%
Non-traditional creative industries 62,027 103,439 60.0% TOTAL creative industries 123,076 250,950 49.0% % creative industries as a
proportion of total 12.0%
* Affiliates of the General and Self-Employed Social Security schemes
Source: Economic Policy and Local Development Research Department of the Barcelona City Council based on data from the Employment and Production Model Observatory of the Generalitat of Catalonia (Autonomous Regional Government)
DIGITAL CITY, CREATIVITY, RESEARCH AND INNOVATION
European city in terms of scientific
production
24
Generating
and attracting
talent
8WhY[bedWÈibWXekhcWha[je\\[hiWfeebe\
gkWb_Ñ[Z^kcWdYWf_jWb
I]ZX^in]Vh&#%+b^aa^dc_dWh!l]^aZ<gZViZg7VgXZadcV ]VhdkZg'#)b^aa^dc#I]ZVXi^k^ingViZ-%#-VcY ZbeadnbZcigViZ,&#)d[7VgXZadcVVgZ]^\]Zg i]Vci]ZVkZgV\ZhhZZc^c8ViVadc^V!HeV^cVcYi]Z :jgdeZVcJc^dc#
BdgZi]Vc]Va[i]Z_dWh^c7VgXZadcV*)#'VgZ^c `cdlaZY\Z"^ciZch^kZVXi^k^i^Zh!VcYi]ZX^in^hVii]Z XdgZd[i]^hhZ\bZcid[i]ZZXdcdbn^c8ViVadc^V! l^i]ZbeadnbZci^c7VgXZadcVgZegZhZci^c\)(#+ d[Vaa`cdlaZY\Z"^ciZch^kZZbeadnbZci!ZkZci]dj\] 7VgXZadcVdcangZegZhZcih(+#*d[Vaa8ViVaVc ZbeadnZZh#
7VgXZadcV]VhcdlgZVX]ZYVXg^i^XVabVhh^ciZgbh d[^ihaVWdjgbVg`Zi^c]^\]VYYZYkVajZhZXidgh/ 8ViVadc^V^hi]ZÐ[i]idegZ\^dc^c:jgdeZ^ciZgbhd[ _dWh^c]^\]"iZX]^cYjhig^ZhVcYhZkZci]gZ\VgY^c\ i]ZcjbWZgd[ldg`Zgh^chX^ZcXZVcYiZX]cdad\n! l^i]bdgZi]Vc,(%!%%%_dWh^ci]^hÐZaY!l]^aZ^ilVh gVc`ZYc^ci]^ciZgbhd[`cdlaZY\Z"^ciZch^kZ]^\]" iZX]cdad\nhZgk^XZh^c'%&*#
7VgXZadcVÇhhVaVgnaZkZa^h^ci]ZadlZg"id"b^YgVc\Z Vbdc\i]ZbdhiYZkZadeZYX^i^Zh!VcYVXXdgY^c\id i]ZJc^dcd[Hl^hh7Vc`h!i]ZVkZgV\ZcZihVaVgnlVh )+#-d[i]ViZVgcZY^cCZlNdg`^c'%&*#
8ViVadc^V]Vh&'jc^kZgh^i^Zh!l^i]bdgZi]Vc'*&!%%% hijYZcihVcYi]ZbZigdeda^iVcVgZVVXXdjcih[dg ,)#,d[VaahijYZcih^c^ihZ^\]ijc^kZgh^i^Zh^ci]Z ejWa^XVcYeg^kViZhZXidgh#8ViVaVcJc^kZgh^i^Zh]VkZ '(!%%%[dgZ^\chijYZcihVcYi]ZniZVX]),,d[ÐX^Va BVhiZghegd\gVbbZhl^i]('!&*'ZcgdabZcihYjg^c\ i]ZVXVYZb^XnZVg'%&)$'%&*#
>c'%&*bdgZi]Vc]Va[*&#&d[ldg`^c\ldbZc VcY))#+d[Vaaldg`Zgh^c8ViVadc^V]VYjc^kZgh^in YZ\gZZh!l^i]i]ZhZeZgXZciV\ZhlZaaVWdkZi]Z HeVc^h]VcY:jgdeZVcVkZgV\Zh#
>ciZgbhd[igV^c^c\!^i^hldgi]cdi^c\i]Vi7VgXZadcV ^hi]ZdcanX^inl^i]ild^chi^iji^dchVbdc\hii]Zide Z^\]iWjh^cZhhhX]ddah^c:jgdeZ!l^i]:H69:VcY
>:H:hiVcY^c\^c,i] and 8i]hedih^c:jgdeZ!VcY&+i]
and 23i]^ci]ZldgaYgZheZXi^kZan!VXXdgY^c\idi]Z
<adWVaB76'%&+gVc`^c\ejWa^h]ZYWni]Z;^cVcX^Va I^bZh#
'*
JOBS IN BARCELONA
Workers affiliated to the social security scheme, 2016*
TOTAL %/SPAIN
Barcelona 1,061,171 5.95
Barcelona province 2,434,337 13.64
Catalonia 3,189,437 17.87
Spain 17,849,055 100.00
* Data from the 4th quarter
Source: Observatory of Employment and Production Model of the Generalitat of Catalonia and INSS
% Employees with a university education, 2015*
WOMEN TOTAL
Catalonia 51.1% 44.6%
Spain 48.1% 42.6%
European union 38.7% 35.0%
* % of the population between 25 and 64 years old with a university degree Source: Eurostat
Employees by knowledge intensity, 2016* (% on total)
Barcelona
* Data from the 4th quarter
Source: Department of Enterprise and Employment of the Generalitat of Catalonia
LABOUR MARKET PARTICIPATION
Participation in the labour market,
4th quarter 2016 (% on population 16-64 years old)
80.8 78.5 75.1 73.2 71.4 66.8 61.1 67.1 11.6 15.0 18.7 8.2
Activity rate Employment rate Unemployment rate
Barcelona Catalonia Spain European Union*
* 3rd quarter 2016
Source: Eurostat and Labour Force Survey
SALARIES
Salary levels in cities across the world, 2015
GROSS SALARY (NEW YORK - 100) CITY NET SALARY (NEW YORK - 100)
131.3 Zurich 141.8
130.1 Geneva 135.2
85.2 Chicago 84.5
77.4 Montreal 78.2
75.5 London 72.3
68.5 Vienna 69.7
67.7 Munich 68.2
62.8 Paris 67.1
70.1 Tokyo 66.5
58.6 Lyon 62.8
92.2 Copenhagen 56.8
60.0 Rome 54.2
65.3 Amsterdam 53.3
49.4 Hong Kong 51.3
51.7 Barcelona 46.8
29.8 Athens 28.2
* 3rd quarter 2016
Source: UBS. Prices and Earnings 2015
GENERATING AND ATTRACTING TALENT
High-technology industries
1.0%
Knowledge-intensive services
50.0%
Medium-high technology industries
3.2%
Other employees
'+ UNIVERSITIES AND BUSINESS SCHOOLS
Training and universities, 2014-2015
Total number of students in Catalonia * 251,589 Total number of students in the Barcelona area* 188,018 Number of Masters offered by universities in the
Barcelona area 477
Number of students on Master's and PhD
programmes at universities in the Barcelona area 32,152 Foreign students at Catalan universities 22,448 Foreign students on Masters and Doctorate
programmes at Catalan universities 11,860
* Includes Masters students
Source: Support for Area Planning, Analysis and Evaluation in the Field of Universities and Research / Secretary for Universities and Research / Department Business and Knowledge Generalitat of Catalonia and the Department of Statistics, Barcelona City Council
Best European business schools, 2016
EUROPEAN RANKING
WORLD RANKING
BUSINESS SCHOOL CITY
1 1 Insead Fontainebleau
2 3 London Business School London 3 10 University of Cambridge: Judge Cambridge 4 12 IE Business School Madrid
5 13 IMD Lausanne
6 15 HEC Paris Paris
7 16 IESE Business School Barcelona 8 23 ESADE Business School Barcelona
9 25 SDA Bocconi Milan 10 28 University of Oxford: Saïd Oxford 11 35 Imperial College Business School London 12 36 Lancaster University Management
School Lancaster
13 37 City University: Cass London 14 38 Alliance Manchester Business
School Manchester
15 40 The Lisbon MBA Lisbon 16 42 Rotterdam School of Management,
Erasmus University Rotterdam 17 46 Warwick Business School Coventry 18 49 Mannheim Business School Mannheim 19 57 Cranfield School of Management Cranfield 20 60 Universität St Gallen St.Gallen
Source: Financial Times, Global MBA Ranking 2016
More than half of
',
;djh[fh[d[kh_Wb
city with
competitive
costs
8WhY[bedW^WiZodWc_YWdZÒ[n_Xb[
Xki_d[iii[Yjehi
I]Z7VgXZadcVVgZV^h]dbZid)*%!)*&XdbeVc^Zh! Veegdm^bViZan&)d[i]ZidiVa[djcY^cHeV^c# I]ZnVgZbV^canHB:h!X]VgVXiZg^hZYWni]Z^g \gZViZgÑZm^W^a^inVcYVW^a^inidVYVeiidXdbeaZm Zck^gdcbZcih#I]ZX^inVXXdjcih[dgcZVgan)%d[Vaa XdbeVcn]ZVYfjVgiZgh^ci]Zegdk^cXZ#
I]ZZcigZegZcZjg^VaVXi^k^ingViZI:6d[gZh^YZcih &-"+)^ci]Zegdk^cXZd[7VgXZadcVhiddYVi+#& ^c'%&*!l]^X]^hVWdkZXdjcig^Zha^`Z>iVan)#.! <ZgbVcn)#,VcYi]ZHeVc^h]VkZgV\Z*!,#
>c'%&+!7VgXZadcVhVl-!,**cZlÐgb^cXdgedgVi^dch! i]Z]^\]ZhicjbWZgh^cXZ'%%-VcYVc^cXgZVhZd[ &(#+XdbeVgZYid'%&*#
8WhY[bedW^WiWYecf[j_j_l[ikffboe\
e\ÑY[i\ehXki_d[ii[i
>c'%&*!7VgXZadcV[Zaa^ci]ZXdhid[a^k^c\^cYZm gVc`^c\^cgZaVi^dcidi]ZWZcX]bVg`X^inCZlNdg`! VXXdgY^c\idBZgXZg=jbVcGZhdjgXZ8dchjai^c\#I]Z bV^cXVjhZd[i]^hgZaVi^kZYgde^ci]ZXdhid[a^k^c\ lVhYjZidoZgd^cÑVi^dc!lV\ZbdYZgVi^dcVcYi]Z YZegZX^Vi^dcd[i]ZZjgd^c'%&*#
7VgXZadcV]VhVXdbeZi^i^kZedh^i^dcgZ\VgY^c\ i]ZgZciVaeg^XZhd[^cYjhig^VaaVcY!d[ÐXZhVcY gZiV^aegZb^hZh!l]^X]^hV[VXidgi]ViViigVXih Wjh^cZhhZhWdi]^ciZgbhd[ÐgbhhZii^c\je^ci]Z X^inVcY`ZZe^c\i]ZdcZhi]ViVagZVYn]VkZVWVhZ ]ZgZ#=dlZkZg!i]ZigZcY^cgZiV^agZciVah!d[ÐXZVcY ^cYjhig^VaWj^aY^c\gZciVahh]dlZYVc^cXgZVhZ^c'%&* ^c7VgXZadcV!V[iZgnZVghd[hiV\cVi^dcdg[Vaah!l]^X] gZÑZXihVc^begdkZbZci^ci]ZZXdcdb^Xh^ijVi^dc VcYi]Z\gdl^c\VeeZVad[i]ZX^in[dg\adWVabVg`Zih#
ENTREPRENEURIAL CITY WITH COMPETITIVE COSTS
450,000
More than
companies in the Barcelona area
14%
28 COMPANIES
Companies according to number of employees, 2016
Barcelona
58.4%
No employees36.3%
1 to 9 employees4.7%
10 to 199 employees0.3%
More than199employees
Source: Department of Statistics, Barcelona City Council
Barcelona province
58.3%
No employees36.9%
1 to 9 employees4.6%
10 to 199 employees0.2%
More than199employees
Source: INE Central Directory of Companies (DIRCE)
Company headquarters, January 2016
% O/SPAIN Barcelona
174,209
Barcelona province450,451
Catalonia596,196
Spain3,236,582
Source: INE Central Directory of Companies (DIRCE)
BUSINESS CREATION
Entrepreneurial activity in European countries,
2015 (% of population 18-64)
Latvia 14.1 Estonia 13.1 Romania 10.8 Luxembourg 10.2 Slovakia 9.6 Portugal 9.5 Ireland 9.3 Poland 9.2 Hungary 7.9 Croatia 7.7 EU average 7.6 Netherlands 7.2 Sweden 7.2 United Kingdom 6.9 Greece 6.8 Finland 6.6 Catalonia 6.4 Belgium 6.2 Barcelona* 6.1 Slovenia 5.9 Spain 5.7 Italy 4.9 Germany 4.7
* Data at the provincial level
Source: Global Entrepreneurship Monitor (GEM) 2015 Executive Report Catalonia
5.4%
13.9%
'.
PROPERTY MARKET
Market for offices, 4th quarter 2016
5,915,722 m
2Total stock of offices
533,598 m
2Available supply of offices
9.02%
Vacancy rate
Source: On point, Jones Lang Lasalle
Office rental prices,
4th quarter (€/m2/month)
Periphery (Sabadell, Sant Cugat, Esplugues, etc.)
9.75 New business areas 18.5 Business district (consolidated centre) 18.25 Prime (Pg. Gràcia-Diagonal) 21.5
Source: On point, Jones Lang Lasalle
Office rents in Europe, Middle East and Africa, 2015
RANKING CITY INTER-ANNUAL
VAR (%) OFFICE RENTALS (€/M2/YEAR)
1 London West End 9.3 1,784
2 London city 11.7 1,017
3 Geneva 0.0 825
4 Paris 0.0 800
5 Moscow -26.7 788
6 Zurich -3.0 767
7 Dubai 0.0 735
8 Dublin 16.7 565
9 Stockholm 13.3 552
10 Milan 2.1 490
40 Barcelona 9.9 234
42 Copenhagen 3.0 228
43 Rotterdam 0.0 225
44 Lisbon 0.0 222
44 Bucarest 2.8 222
Source: CB Richard Ellis, EMEA Rents and Yields Q3 2015 (Europe, Middle East & Africa)
Average housing prices in Barcelona,
4th quarter 2016
12.4
(€/m2/month)Rent*
3,879
(€/m2)
Purchase price of second-hand housing
3,981
(€/m2)Purchase price new home sales*
* Data 3rd quarter 2016
Source: Barcelona City Council from idealista.com
PRICES AND COSTS
Cost of living in cities around the world, 2015
CITY RANKING 2014 RANKING 2015
Luanda 1 1
Hong Kong 3 2
Zurich 5 3
Singapore 4 4
Geneva 6 5
Shanghai 10 6
Barcelona 71 124
Source: Mercer Human Resource Consulting, Worldwide Cost of Living Survey, City Rankings 2015
Rental prices of industrial land in cities in Europe, the Middle East and Africa, 2015
RANKING CITY INTER-ANNUAL
VAR (%)
RENTAL PRICE INDUSTRIAL LAND
(€ / M2 / YEAR)
1 Abu Dhabi 0.0 219.5
2 London 12.0 204.5
3 Geneva 0.0 183.4
4 Zurich 6.3 163.0
5 Helsinki 4.4 144.0
6 Oslo 0.0 136.9
7 Dubai 6.4 131.3
8 Glasgow 3.9 98.6
8 Stockholm 0.0 97.3
10 Edinburgh 8.3 95.0
14 Barcelona 4.2 75.0
14 Amsterdam 0.0 75.0
14 Rotterdam 0.0 75.0
17 Frankfurt 0.0 74.4
18 Gothenburg -10.0 73.0
19 Dublin 11.5 72.5
20 The Hague 0.0 70.0
Source: CBRE, EMEA Rents and Yields Q3 2015
(%
Barcelona stands in
in terms of health security
7
thposition
A compact city
with social
cohesion
7VgXZadcV]VY]djhZ]daYY^hedhVWaZ^cXdbZeZg XVe^iVZhi^bViZYViÍ&.!,,*^c'%&*#I]ZgZXZhh^dc eZg^dYhVlVl^YZc^c\d[heVi^Va^cZfjVa^i^Zh!VcY i]Z]djhZ]daYY^hedhVWaZeZgXVe^iV^cXdbZ^ci]Z X^inÇhY^hig^XihgVc\ZhWZilZZc&--^cYZmZYed^cih2 in
HVgg^|"HVci<ZgkVh^VcY*(#-^cCdj7Vgg^h#
I]Z^cZfjVa^ind[^cXdbZY^hig^Wji^dc]Vhl^YZcZY ^cgZXZcinZVghVcYi]Z<^c^XdZ[ÐX^Zci[dg8ViVadc^V %#('*^hcZVgi]ZD:89VkZgV\Z#
7VgXZadcV^hVbdc\i]ZhV[ZhiX^i^Zh^ci]ZldgaY! VXXdgY^c\idi]Z:Xdcdb^hi>ciZaa^\ZcXZJc^iÇhHV[Z 8^i^Zh>cYZm'%&*!l]^X]VhhZhhZhjgWVchZXjg^in^c i]ZY^\^iVaV\Z#HeZX^ÐXVaan!i]ZXVe^iVad[8ViVadc^V hiVcYh^c&*i]edh^i^dc^ci]Z\adWVagVc`^c\d[*%
X^i^Zh!l]^X]^haZYWnId`nd#>ilVhgVc`ZY)i]among
:jgdeZVcX^i^Zh!V]ZVYd[AdcYdc!BVYg^YVcYEVg^h# >bedgiVcian!7VgXZadcVlVh,i]^ciZgbhd[]ZVai]
hZXjg^in!l]^X]iV`Zh^cidVXXdjciVheZXihhjX]Vh ejWa^XVXXZhhidi]Z]ZVai]hnhiZb!i]ZgVi^dd[WZYh VcYbZY^XVahiV[[eZgi]djhVcY^c]VW^iVcih!V^gVcY lViZgfjVa^inVcYa^[ZZmeZXiVcXn#
7VgXZadcV]VhVhigdc\hdX^VaVcYhda^YVg^inZXdcdbn! l]^X]VgZXZcigZYdc^cY^k^YjVahVcY\gdje"WVhZY VXi^k^i^Zh!l^i]VcdiZldgi]nI]^gYHZXidg*%#.! ldg`Zg"dlcZYXdbeVc^Zh'*#)!XddeZgVi^kZh &-#'VcYXdbbjc^inZXdcdb^Zh*#*i]Vi]VkZ i]ZVW^a^inidYZa^kZgh^\c^ÐXVcihdX^Va^ccdkVi^dc#
(&
COMPACT CITY WITH SOCIAL COHESION
Disposable household income per capita in the districts of Barcelona, 2015 (Index. Barcelona Average = 100)
53.8 188
Source: Technical Programming Office of Barcelona City Council
Foreign population in the districts of Barcelona, 2016 (% on total population)
11.2% 43.2%
Source: Department of Studies, Economic Policy and Local Development, based on data provided by the Statistics Department of Barcelona City Council
Income distribution in the main OECD regions
POSITION OECD REGION CITY INCLUDING THE REGION GINI COEFFICIENT*
1 Southern Finland Helsinki 0.242
2 Bratislava Bratislava 0.275
3 Capital (Denmark) Copenhagen 0.283
4 Central Hungary Budapest 0.286
5 Berlin Berlin 0.288
5 Rhône-Alpes Lyon 0.288
6 Bavaria Munich 0.294
7 Oslo and Akershus Oslo 0.295
8 South Kanto Tokyo 0.300
9 Lombardy Milan 0.304
10 Stockholm Stockholm 0.314
OECD average 0.315
11 Central Region (Poland) Warsaw 0.321
12 Catalonia Barcelona 0.325
13 Ontario Toronto & Ottawa 0.331
14 Vienna Vienna 0.337
15 Madrid Madrid 0.339
16 Ile de France Paris 0.343
17 Tel Aviv District Tel Aviv 0.345
18 Lazio Rome 0.347
19 New South Wales Sydney 0.348
20 Athens Athens 0.355
21 Brussels Capital Region Brussels 0.358
22 Greater London London 0.386
23 Washington Washington 0.389
24 New York New York 0.415
25 Federal district Mexico City 0.482
26 Santiago Metropolitan Santiago de Chile 0.484 * Gini coefficient after taxes and transfers. Data accessed: June 2016
The Gini coefficient can have values between 0 and 1, where 1 represents the most unequal income distribution
Source: OECD Regional Income Distribution and Poverty Database
A COMPACT CITY WITH SOCIAL COHESION
Ciutat Vella
85.5
Horta-Guinardó
79.6
Les Corts
138.3
Sants-Montjuïc
78.1
Eixample
115.8
Sarrià-Sant Gervasi
188
Gràcia
105.8
Sant Martí
86.5
Sant Andreu
72.8
Nou Barris
53.8
Ciutat Vella
43.2%
Horta-Guinardó
11.7%
Les Corts
11.2%
Sants-Montjuïc
18.7%
Eixample
18.7%
Sarrià-Sant Gervasi
11.3%
Gràcia
15.4%
Sant Martí
15.4%
Sant Andreu
11.4%
Nou Barris
32
Security in cities around the world, 2015
POSITION CITY INDEX O/100
1 Tokyo 85.6
2 Singapore 84.6
3 Osaka 82.4
4 Stockholm 80.0
5 Amsterdam 79.2
6 Sydney 78.9
7 Zurich 78.8
8 Toronto 78.8
9 Melbourne 78.7
10 New York 78.1
11 Hong Kong 77.2
12 San Francisco 76.6
13 Taipei 76.5
14 Montreal 75.6
15 Barcelona 75.2
16 Chicago 74.9
17 Los Angeles 74.2
18 London 73.8
19 Washington DC 73.4
20 Frankfurt 73.1
21 Madrid 72.4
22 Brussels 71.7
23 Paris 71.2
24 Seoul 70.9
25 Abu Dhabi 69.8
Source: The Safe Cities Index 2015. The Economist Intelligence Unit
Categories of urban security. Positioning of Barcelona, 2015
5 10 15 20 25 30
Digital security
Health safety
Infrastructure security
Personal security
Source: The Safe Cities Index 2015. The Economist Intelligence Unit
SOCIAL AND SOLIDARITY ECONOMY
Companies, associations and initiatives in the social and solidarity economy in Barcelona, 2015
* Annual Statistics 2013
Source: Barcelona City Council (2015), The Social and Solidarity Economy in Barcelona
Companies, associations and initiatives in the social and solidarity economy in the districts of Barcelona, 2015
6% 19%
Source: Barcelona City Council (2015), The Social and Solidarity Economy in Barcelona
29
7
14
11
Third Sector*
50.9%
Cooperatives
18.20%
Worker-owned firms (SAL)
25.4%
Community economies
5.5%
Ciutat Vella
504 (11%)
Horta-Guinardó
393 (8%)
Les Corts
340 (7%)
Sants-Montjuïc
500 (11%)
Eixample
892 (19%)
Sarrià-Sant Gervasi
398 (8%)
Gràcia
538 (11%)
Sant Martí
574 (12%)
Sant Andreu
290 (6%)
Nou Barris
33
GkWb_joe\
life and
ikijW_dWX_b_jo
Barcelona, an international benchmark for
gkWb_joe\b_\[
7VgXZadcVÇhXdbeVXi!BZY^iZggVcZVcX^inbdYZa ]ZaehYZkZadehjhiV^cVWaZbdW^a^in!l]^X]gZegZhZcih -*#+d[^ccZg"X^in_djgcZnh^c7VgXZadcV"VcYi]Z X^in^hgVc`ZY]^\]^cegZhi^\^djhgVc`^c\hhjX]Vhi]Z HXdgZXVgYdcEgdheZg^in'%&*^cYZmWni]ZIdgdcid 7dVgYd[IgVYZWZXVjhZd[^ihbdYZgViZXdbbjiZ i^bZh#
>i^hldgi]cdi^c\i]Vi7VgXZadcV^hcdlVWZcX]bVg` ^c:jgdeZ^ciZgbhd[lViZghVk^c\#9dbZhi^XYV^an lViZgXdchjbei^dceZgXVe^iVlVh&%*#*a^igZh^c '%&*!l]^X]^hVgZYjXi^dcd[&%#,XdbeVgZYid'%%+#
7VgXZadcV^hdcZd[i]Zide'*\adWVaX^i^Zh^ciZgbh d[Zck^gdcbZciVahjhiV^cVW^a^in!VXXdgY^c\idi]Z HjhiV^cVWaZ8^i^Zh>cYZm'%&+#>i]VhVgZaVi^kZanadl kdajbZd[8D2Zfj^kVaZciZb^hh^dcheZg^c]VW^iVci
XdbeVgZYiddi]ZgX^i^Zh^ci]ZldgaY#I]ZX^in^h YZkZade^c\VcZXdcdb^XbdYZai]Vi^hZ[ÐX^Zci ^c^ihjhZd[gZhdjgXZhVcYegdbdiZhi]Z\gZZc ZXdcdbn!l]^X]^c'%&+gZegZhZciZYVgdjcY(d[Vaa ZbeadnbZciVcYd[[Zgh]j\ZediZci^VaVhVYg^kZgd[ ^ccdkVi^dc#
I]ZX^inÇhXjaijgVaVcYZYjXVi^dcVad[[Zg^c\ ^hZmiZch^kZVcYd[]^\]fjVa^in#I]ZgZVgZ)%
^ciZgcVi^dcVahX]ddah^ci]Z7VgXZadcVVgZV#BdgZdkZg! i]ZgZVgZ)%ejWa^Xa^WgVg^Zh^ci]ZX^in#7VgXZadcVVahd ]Vhc^cZJC:H8DLdgaY=Zg^iV\Zh^iZh/hZkZc<VjY Wj^aY^c\h!i]ZEVaVjYZaVBh^XVVcY=dhe^iVaYZHVci EVj#
6XXdgY^c\idi]Z:jgdWVgdbZiZgFjVa^ind[A^[Z^c :jgdeZVc8^i^Zh'%&*gZedgi!l]^X]lVhejWa^h]ZY Wni]Z:jgdeZVc8dbb^hh^dc^c'%&+!.'d[ 7VgXZadcVÇhgZh^YZcihVgZhVi^hÐZYl^i]i]ZX^inVcY i]ZcZ^\]Wdjg]ddYl]ZgZi]Zna^kZ!l]^X]^hdcZ d[i]Z]^\]ZhieZgXZciV\ZhgZXdgYZYVbdc\hii]Z ,.X^i^ZhVcVanoZY#6heZXihd[i]ZX^ina^`ZejWa^X heVXZ!hZXjg^in!ejWa^XigVchedgi!dgXdcÐYZcXZ^c di]ZggZh^YZcih\dikZgn\ddYgVi^c\h[gdbgZh^YZcih gZ\VgY^c\i]Z^gdlcX^in#
QUALITY OF LIFE AND SUSTAINABILITY
Sustainable mobility representes
of inner-city journeys in Barcelona
34
ENERGY AND THE ENVIRONMENT
Barcelona’s climate indicators, 2015
18.4 ºC
Average annual temperature
34.7 ºC
Highest temperature
2.1 ºC
Lowest temperature
2,867.5
Hours of sunshine per year
Source: Department of Statistics, Barcelona City Council, 2016 Annual Statistics
Green belt indicators in Barcelona, 2015
583.6 ha.
Urban parks
(green areas for public use)
Urban parks
(green areas for public use) 11,284,681 m
2
Green urban areas per capita 7.03 m2/habitant
Green urban forest areas 28,271,881 m2
Green urban forest area per capita 17.62 m2/habitant Source: Department of Statistics and the Department of Ecology, Urban Planning and Mobility of Barcelona City Council
Beaches, 2015
10
Beaches
4.7 km
LengthQUALITY INDICATORS, 2015
Concentration of Escherichia coli* 16-111 UFC/100 ml
Good visual inspections ** 94%
* Values above and below the 90 percentile level. Levels sufficient under current legislation (Royal Decree 1341/2007): 90th percentile = <500 CFU / 100 ml (RD 1341/2007)
** Percentage of visual inspections with no or insignificant presence of floating solids, oil / foam residues of bathers, sea residues (index evaluated during the bathing season) Source: Department of Statistics and Department of the Environment of Barcelona City Council
Water consumption (litres/inhabitant/day)
2006 2007 2008 2009 2010 2011 2012 2013 2014 2015
Global consumption Domestic consumption Industrial consumption and others
Source: Department of Statistics and Department of the Environment of Barcelona City Council
Selective waste collection in Barcelona (% on total)
2000 2005 2007 2009 2010 2011 2012 2013 2014 2015
Source: Barcelona City Council, Annual Statistics by Barcelona City Council 2016
Workers* and companies in the green economy** in Barcelona, 2nd quarter 2016
MINIMUM VALUE MINIMUM VALUE
Number of workers 26,638 37,988
Weighting / city total employment (%) 2.5% 3.6%
Number of companies 847 2,037
Weighting o / total companies city (%) 1.1% 2.8% * Affiliates of the General and Self-Employed Social Security schemes
** Includes activities in the traditional environmental sector -water, waste, green energy- and administrative activities, education, ICT and R&D related to them. The minimum and maximum value are estimated using international research criteria
Source: Department of Studies of the Economic and Local Development Policy Department, from data provided by the Employment and Production Model of the Generalitat de Catalunya 182.8
159.2
118.1
64.7
11.1%
35.7% 105.5
(*
SUSTAINABLE MOBILITY
Modes of transport for inner city journeys in Barcelona,
2015 (% on total)
56.00%
Walking and cycling Public transport
29.60%
Private transport14.40%
Source: Survey of mobility on a weekday 2015. Metropolitan Transportation Authority (ATM)Bicing
2014 2015
Bike lanes
116.0 km
120 km
Bicing users
96,250
95,168
Source: Directorate of Mobility Services, Barcelona City Council
CULTURE AND EDUCATION
Culture and education, 2015
Public libraries (number and users) 40 / 6,175,624
Museums, collections, exhibition centres and
sites of architectural interest (number and users) 56 / 29,073,193 Spectators at theatres, music and cinemas 9,684,653
Public sports facilities (number / members) 1,904 / 182,230
Schools, primary and secondary 885
Foreign schools in the Barcelona area 40
Source: Institute of Culture and the Department of Statistics of Barcelona City Council
Spectators: theatre, music and cinema
9,684,653
Spectators
6,254,724
Movie theatres Theatres and other
2,421,229
performing arts spaces1,008,700
Large auditoriums
Source: Institute of Culture and the Department of Statistics of Barcelona City Council
Unesco heritage sites in Barcelona
Palau de la Música Catalana
Hospital de Sant Pau
Park Güell
Palau Güell
Casa Milà
Casa Vicens
Nativity façade and crypt: Sagrada Família
Casa Batlló
Crypt at Colònia Güell
Source: UNESCO
(+
International
positioning that
WZZilWbk[
most competitive city in the world
20
th
city in the world in terms of reputation