By Enrique Montufar
Prof. Juan Carlos Díaz Vásquez, PhD., Advisor.
2014
MASTER IN INTERNATIONAL BUSINESS
SCHOOL OF BUSINESS ADMINISTRATION
SUSTAINABLE HOSPITALITY IN THE SIERRA NEVADA DE SANTA MARTA
ii SUSTAINABLE HOSPITALITY IN THE SIERRA NEVADA DE SANTA MARTA
How to develop a sustainable hospitality industry in the Sierra Nevada de Santa Marta,
Colombia, taking the case of Turtle Bay Resort in Hawai’i as a model.
Enrique Montufar
Advisor:
Prof. Juan Carlos Díaz Vásquez, PhD
EAFIT UNIVERSITY
SCHOOL OF BUSINESS ADMINISTRATION
DEPARTMENT OF INTERNATIONAL BUSINESS
MASTER IN INTERNATIONAL BUSINESS
MEDELLIN
iii Creative Commons (CC) 2014
By
iv Abstract
This research attempts to provide necessary context in order to present recommendations
and to evaluate the need for the development of the sustainable hospitality industry in the Sierra
Nevada de Santa Marta. This research presents sustainable hospitality as an alternative for
economic development, based on the analysis of data gathered at Turtle Bay Resort in Hawai’i
and validated by a literature review. This analysis focuses mainly on the management of
important resources: energy, water and waste, following sustainable principles like the ones
presented by systems theories, such as Cradle to Cradle (Braungart, McDonough & Bollinger,
2006) and Blue Economy (Dijk, Tenpierik & Dobbelsteen, 2013). Sustainable hospitality1
provides an eco-effective alternative, for the sustainable economic development of the Sierra
Nevada de Santa Marta Region.
The world has changed. Today, we live in a world with highly competitive markets and
volatile economic environments. No organization, especially those that rely on limited or
declining natural resources, can operate the way they did a decade ago (COSO, 2013). The 20th
century taught us that economic growth does not necessarily mean social development, and that
unbounded growth is unsustainable. Growing energy demand and damaging greenhouse gas
(GHG) emissions, such as CO2 (Carbon dioxide) and CH4 (Methane), reflect the cost and
unsustainable requirements of the system that arose from the industrial revolution, powered
initially by coal and later by oil (Peura, 2012). Economic development must be sustainable and
alternatives to an ever growing economy must be explored (Jackson, 2009). The time framework
presented in this research, from the industrial revolution to climate change (Jackson, 2009)
presents arguments for dealing with high energy demand and negative environmental impact. In
1
v particular considering the current context of growing inequality between (Müller-Steinhagen and
Nitsch. 2005) and within countries, mainly in those with relatively recent economic growth,
based in many cases on extractive industries and other unsustainable resource intensive activities
(Fung, 2009). As is the case for Colombia in which sustainable hospitality principles are yet to
be assimilated and implemented in its complex socio-economic context.
Sustainable hospitality focuses on reducing and when possible eliminating the negative
environmental, social and economic impact resulting from the normal operation of the traditional
hospitality sector (EPA, 2013). Society needs an economy that stimulates technologies that
improve the system. The hospitality industry can benefit from the rising demand around the
world for these technological and ecological solutions by providing clients a sustainable service,
for the good of the company’s bottom line, the guests, the employees, clients, suppliers and the
surrounding community.
Keywords:sustainability, sustainable development, sustainable hospitality, environmental
impact, energy efficiency, renewable energy sources, energy, water, waste, waste management,
vi TABLE OF CONTENTS
LIST OF ABREVIATIONS ... vii
LIST OF FIGURES ... viii
LIST OF TABLES ... xi
1 INTRODUCTION ... 1
1.1 RATIONALE FOR THIS RESEARCH ... 1
1.2 PROBLEM FORMULATION ... 3
1.3 RESEARCH QUESTION ... 4
1.4 OBJECTIVES ... 5
2 LITERATURE REVIEW ... 6
2.1 SUSTAINABLE DEVELOPMENT ... 6
2.1.1 RENEWABLE ENERGY SOURCES ... 14
2.1.2 GLOBAL ENERGY DEMAND ... 24
2.1.3 ENERGY SOURCES AND ENERGY DEMAND IN HAWAII ... 29
2.1.4 ENERGY SOURCES AND ENERGY DEMAND IN COLOMBIA ... 32
2.1.5 SUSTAINABLE HOSPITALITY ... 37
2.1.5.1 LIFE CYCLE ENERGY ANALYSIS (LCEA) ... 41
2.1.5.2 SYSTEMS THEORIES ... 43
2.1.5.3 TAKING SUSTAINABLE HOSPITALITY TO THE NEXT LEVEL ... 44
2.1.5.4 SUSTAINABLE HOSPITALTY CERTIFICATIONS ... 48
3 METHODOLOGY ... 50
3.1 TURTLE BAY RESORT CASE ... 53
3.2 TURTLE BAY RESORT-SUTAINABLE PRACTICES ... 54
3.2.1 ENERGY ... 55
3.2.2 WATER ... 56
3.2.3 WASTE ... 56
3.3 SIERRA NEVADA DE SANTA MARTA... 57
4 CONCLUSIONS ... 60
5 RECOMMENDATIONS ... 62
References……...……….………66
APPENDIX A: TURTLE BAY VALUES ... xii
vii LIST OF ABREVIATIONS
QSSE: Quasi-steady state economy.
CO2: Carbon dioxide
GHG: Greenhouse gas.
IPCC: Intergovernmental Panel on Climate Change.
GDP: Gross Domestic Product.
SDG: Sustainable De-growth.
SG: Sustainable Growth
WEF: World Economic Forum.
PV: Photovoltaics
a-Si: amorphous silicon.
CdTe: Cadmium telluride.
CuInSe2 (CIS): Copper indium selenite.
IEA: International Energy Agency.
WEO: World Energy Outlook.
HECO: Hawaiian Electric Company.
viii FAZNI: Fondo de Apoyo Financiero para la Energización de las Zonas No Interconectadas.
IPSE: Instituto para la Promoción de Soluciones Energéticas.
EUI: Energy use intensity.
EPA: Environmental Protection Agency
C2C: Cradle to Cradle
BE: Blue Economy
LIST OF FIGURES
Figure 1. Problem diagram-Sustainable hospitality, stake holders and environmental criteria
Figure 2. Schematic alternatives of population development (dotted line=carrying capacity, solid line=population and economy. Source: Peura, 2012)
Figure 3. Population Growth (The age of sustainable development, Coursera 2014)
Figure 4. Future development of costs (current cost levels = 100%) for technologies for the use of renewables, derived from learning curves (Müller-Steinhagen and Nitsch. 2005)
Figure 5. Participation of renewable energy within the framework of primary world energy (Hernandez, Velasco and Trujillo. 2011)
Figure 6. Growth of renewable technologies during the period: 2004–2009. Source: REN21. 2010 (as cited by Hernandez, Velasco and Trujillo. 2011)
ix Figure 8. Assorted types of solar energy based on global market availability (Akikur, Saidur, Ping, Ullah, (2013).
Figure 9. Cumulative installed solar PV power capacity as per the IEA-PVPS (Muneer, 2011)
Figure 10. Percentages of grid-connected and off-grid PV power capacity as per IEA PVPS (Muneer, 2011)
Figure 11. Contribution of several technologies of photovoltaic modules to the worldwide market (Hernandez, Velasco and Trujillo. 2011)
Figure 12. Primary energy demand and share of global growth, International Energy Agency (World Energy Outlook, 2013)
Figure 13. Development of energy-related CO2 emissions in different IPCC scenarios compared to the historical process and their impact on the atmospheric CO2 concentration and temperature
(A1FI = meeting growing energy demand mainly by fossil energies; ‘450’ and ‘550’ = average
values of scenarios which result in a stable concentration of CO2 (ppm) in the atmosphere).
Source: IPCC (2002)
Figure 14. CO2 Emissions (The age of sustainable development, Coursera 2014).
Figure 15. Comparison of the per-capita energy consumption (1999) by countries (including non-commercial energy) (Source: IEA (2001) system (as cited by Müller-Steinhagen and Nitsch.
2005).
x Figure 17. Energy load profile (HECO, 2014)
Figure 18. Final energy demand in Colombia (UPME, March report 2013)
Figure 19. Total energy demand residential y non-residential (UPME, 2010)
Figure 20. Percentage of electricity service coverage in Colombia. Period 2000-2008 (UPME, 2010)
Figure 21. Evolución precio promedio en bolsa de energía eléctrica 2002-2010 $/kWh (UPME, 2011)
Figure 22. Average price evolution in $Kwh at 2008 constant prices de 2008 (UPME, 2010)
Figure 23. Sustainability in Corporate strategy (Ernst & Young, 2013. p7)
Figure 24. Energy Use Intensity (Energy Star, 2012)
Figure 25. The material economy is bounded by the ecosystem; the intellectual economy is not (Hepburn and Bowen, 2012
Figure 26. Simplified lifecycle diagram of a building. Modified from Kellenberger and Althaus (2009); Scheuer et al. (2003). The white color represents the pre-operational phases of the
building lifecycle (so-called preparation and material placement). The light gray color
corresponds to the building’s operations. The dark gray color indicates the end-of-life stages of
the building life frame (Filimonau, Dickinson, Robbins and Huijbregts. 2011).
xi Figure 28. The upcycle chart (MBDC, 2014)
Figure 29. Principles of the seven systems theories discussed and related to Cradle to Cradle (Dijk, Tenpierik & Dobbelsteen, 2013)
Figure 30. The process of generalization (Mayring, 2007)
Figure 31. Step model of inductive category development (MAYRING 2000)
Figure 32. Benchmark property listing (http://www.benchmarkresortsandhotels.com/weddings/)
Figure 33. Santa Marta’s solar radiance (adapted from Atlas de Radiación del INEA-HIMAT/1993)
LIST OF TABLES
Table 1. Scale and intensity requirements to achieve Green House Gasses (GHG) reduction
targets (Victor, 2011)
Table 2. Global Risks (WEF Global Risks, 2014)
Table 3. Energy amortization time of different electricity generation systems (adapted from
1 SUSTAINABLE HOSPITALITY IN THE SIERRA NEVADA DE SANTA MARTA
How to develop a Sustainable Hospitality industry in the Sierra Nevada de Santa Marta, Colombia, taking the case of Turtle Bay resort in Hawai’i as a model.
1 INTRODUCTION
1.1 RATIONALE FOR THIS RESEARCH
This research presents recommendations and highlights current conditions for the
sustainable development of the hospitality industry in the Sierra Nevada de Santa Marta region;
in order to truly become sustainable hospitality, based on findings after analyzing the Turtle Bay
resort case and validated through the analysis of literature review. While sustainable
development and climate change mitigation strategies are at an early stage in Colombia (UPME,
2013), this research evaluates Sustainable Hospitality (EPA, 2013) as an alternative long term
oriented economic development of the hospitality industry in the Sierra Nevada de Santa Marta.
Before analyzing the local case for sustainable hospitality in SNSM, time framework and the global context must be considered in order for true sustainability to be achieved. Energy is perhaps, the main variable for human development and the main focus of this research, especially regarding demand and production. Record high energy consumption and high levels of CO2 and CH4 emissions reflect the high cost and unsustainable requirements, resulting from the economic and productive
systems that are our heritage from the industrial revolution and World War II era which were
powered initially by coal and later by oil. Long term sustainability calls for an integral approach
for the implementation of practices for sustainable management of resources, such as energy and
2 operations (Dijk et al., 2013). Sustainability is good for business (J.D. Power and Associates,
2009), the environment, and the community (Levy & Park, 2011).
This research also presents also sustainable hospitality as an alternative for long term
economic development with a reduced negative impact, efficient use of resources (energy, water
and waste), and a sustainable approach. Turtle Bay resort, located on the island of Oahu in
Hawai’i, has taken measures to reduce its negative environmental impact and this research seeks
to highlight key elements of the practices and improvements already implemented there. TBR’s
model can be taken into account for the sustainable development of the hospitality industry in the
Sierra Nevada de Santa Marta, especially when considering their similarities regarding
multicultural communities, a strong indigenous presence, prevalence of tourism and valuable
natural resources. However there are also key differences, like Hawaii’s advantage as part of the
United States, mainly due to regulation and market instruments such as tax cuts and rebates,
versus the limitations faced by sustainable initiatives in emerging economies like Colombia’s.
Colombia and the Sierra Nevada de Santa Marta in particular, face diverse challenges for
the sustainable development of local economies within a relatively uncertain global context. In
order to improve the quality of life of the different communities in the region, while competing
in a global economy, local communities need to develop their economy and social structures
following sustainable principles to guarantee long-term success.
Although society and its important dynamics, like education and labor, are important
variables for sustainable hospitality, the focus of this research will be mainly on the
environmental dimension of the concept, in particular energy efficiency and its effective use.
3 change, and the interdisciplinary scope of this research, detailed financial analysis is not
included.
1.2 PROBLEM FORMULATION
As this research shows, high levels of greenhouse gas (GHG) emissions, extreme weather
events, population growth and even greater levels of consumption and its resulting waste, present
serious challenges for the socio-economic development of communities around the world, but in
particular to those in emerging economies. People in rural areas struggle to make ends meet, as is
the case for many people in the Sierra Nevada the Santa Marta. Tourism is an alternative for
local communities, and presents a lesser impact than other industries, particularly extractive
ones. Yet, as this research shows, the hospitality industry can be resource intensive, jeopardizing
environmental resources and the sustainable livelihood of local communities including Tribes in
the Sierra Nevada de Santa Marta requiring the decoupling of the development of the industry
from the level of its material impact. The business cycle is not isolated and the nature of a
business that grows without negative impact is a necessity for the long term sustainability of the
system. The diagram below represents stakeholders’ interacting in a closed loop running in
parallel to the bidirectional interaction between sustainable hospitality and the surrounding
environment (Nature), considering the effects of addressing environmental criteria such as:
4
Figure 1.Problem diagram-Sustainable hospitality, stake holders and environmental criteria.
1.3 RESEARCH QUESTION
The underlying research question in this research is:
How to develop sustainable hospitality in the Sierra Nevada de Santa Marta?
Hence, several sub-questions have been defined:
What is sustainability?
What is sustainable development?
Is sustainable development viable under current conditions?
How to power sustainable development?
Is there a working case for sustainable hospitality?
Can sustainable hospitality in the Sierra Nevada de Santa Marta be
5 1.4 OBJECTIVES
To establish that the global situation requires a change to sustainable practices. This
research focuses on presenting and analyzing a time framework to complement, current,
global, technical and economic conditions for the development of a sustainable
hospitality industry in the Sierra Nevada de Santa Marta.
The Sierra Nevada the Santa Marta needs alternative, low impact development. This
research attempts to make the case that sustainable hospitality is a good low-impact
industry that addresses the needs established by the current context.
To present a case study of Turtle Bay Resort, in Hawai’i that has implemented some
sustainable practices addressing energy efficiency, water use optimization and waste
reduction. Reducing negative environmental impact from the Hospitality industry in areas
with significant environmental and cultural wealth such us Hawai’i and the Sierra Nevada
de Santa Marta.
To present systems theories as a more comprehensive approach than the practices
implemented at Turtle Bay Resort and to describe how these practices and theories, like
Cradle to Cradle can be applied in the Sierra Nevada de Santa Marta and to present
6 2 LITERATURE REVIEW
2.1 SUSTAINABLE DEVELOPMENT
Planet Earth is an interconnected and interdependent system and our economy is a
subsystem of the biosphere. Sustainable development models cannot ignore the environmental
reality of a limited biosphere. Since the beginning of industrialization, the concentration of
carbon dioxide (CO2), among other greenhouse gas (GHG) emissions, in the atmosphere has
increased 25%, causing the mean temperature near the ground to increase by 0.6+0.28C and an
even greater increment in the mean temperature is expected, around 1.48C to 5.88C by the year
2100, as calculated in the scenarios of the Intergovernmental Panel on Climate Change
(Müller-Steinhagen and Nitsch. 2005). Absolute decoupling of economic output and environmental
pressure is necessary to remain within environmental limits (Jackson, 2009). Rampant economic
growth increases environmental pressure on global systems. This section shows the one
dimensional-growth oriented rationale to be unsustainable and insufficient to address current
issues such as population growth, climate change, economic instability, and social unrest, among
others.
Competition among firms has been mistakenly suggested to reflect the seemingly ruthless
logic of Darwinian selection, the free market as a struggle for survival, in which the stronger
survives, supporting three pillars of neoclassical economics (Johnson, Price, and Van Vugt,
2012): (1) economic actors are self-interested; (2) self-interest leads to public goods (Adam
Smith’s “invisible hand”); and (3) together these lead to market optimization. Both Charles
Darwin and Alfred Russel Wallace arrived independently to similar theories of Natural Selection
after reading Malthus, extending his logic even further by framing it in purely natural terms, both
7 provides a competitive environment among siblings, and that the variation among siblings would
produce some individuals with a slightly greater chance of survival (Peura, 2012). But Malthus
proposed and believed in human beings’ capacity for reason and foresight to act as a preventive
check, resulting in a controlled future instead of an ungovernable and chaotic world with active
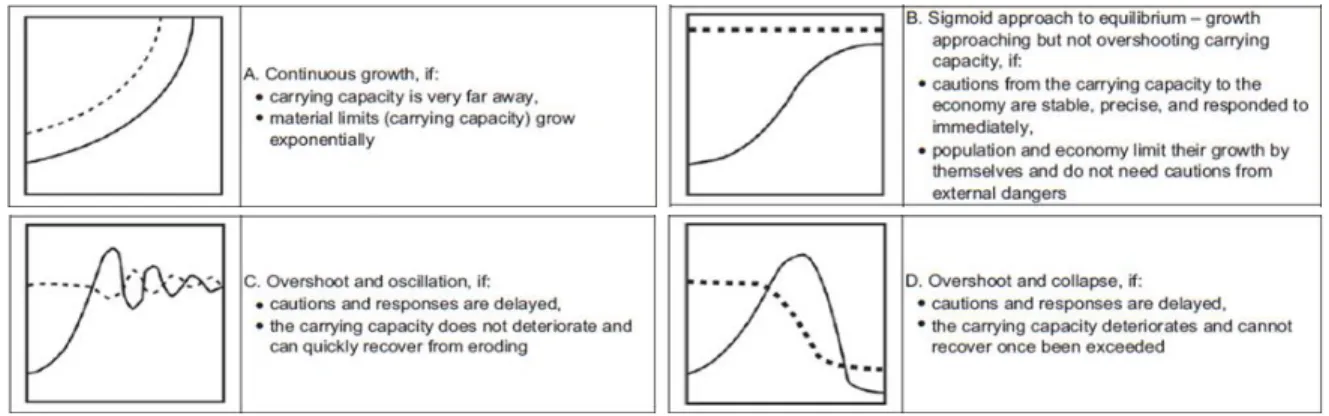
positive checks (Malthus, 1865). These four different carrying capacity vs growth scenarios
portrayed in the next set of graphs, display different theoretic scenarios for economic growth:
Figure2. Schematic alternatives of population development (dotted line=carrying capacity, solid
line=population and economy. Source: Peura, 2012).
Graph A represents a world in which carrying capacity grows as material limits grow
exponentially, making unbounded economic growth is possible. Graph B shows the effects of
human beings’ capacity for reason and foresight applied timely, before overshooting carrying
capacity. Graph C shows a scenario reflecting a common behavior among physical systems
(corrective response), where although measures to adjust to carrying capacity are taken after
overshooting carrying capacity, this timely reaction may avoid irreversible carrying capacity
deterioration, making recovery possible. Graph D is obviously the scenario to avoid. If cautions
are not attended and responses not applied in a timely manner, growth could overshoot the
8 Thomas Malthus (1798) couldn’t see past the age of fossil fuels, but he and other thinkers
like Jevons (1865) and later Hotelling (1931) observed since the beginning of the industrial
revolution, that limited resources were in conflict with the idea of a constantly growing resource
based economy (Hepburn & Bowen, 2012). However the discovery of large amounts of oil, at
the beginning of the 20th century, not only froze the discussion about bounded growth, but
repowered risky industrialization processes that allowed for unmatched population growth and
an even greater material demand, without knowing the real level of its negative environmental
impact and its effect on future generations (Peura, 2012). Until very recently it appeared as if
Malthus, Jevons and Hotelling had underestimated human inventiveness and adaptability to
overcome this obstacle, yet now (with our current state of environmental decline) it seems that
they understood the long-term effects of pushing the limits of production beyond the point of no
return: the real cost of reaching planetary limits.
Colombia has been depending on oil exports for economic growth, this presents a clear
challenge for new, sometimes disruptive technological solutions. This unsustainable path has
been followed because “Most neoclassical and new-growth theory does not explicitly model
environmental limitations, and hence never-ending growth is often possible” (Hepburn &
Bowen, 2012. p 7). At least it appears possible, but population growth, dwindling resources, war
and climate change, among other issues demand a new approach. The economic crisis of 2008
showed that the world has been following a short sighted set of goals: fast rewards in the short
term for faster economic growth, in many cases regardless of the negative consequences for
society and the environment. High levels of systemic inequality, as a result of this
one-dimensional approach, has caused a lot of instability all over the world, in a wide range of
9 many others, showing that development must be integral, inclusive, local, long-term oriented,
flexible, adaptable, distributed; in other words, sustainable. As social unrest in countries around
the world increases, it is clear that population growth is a critical variable for sustainable
development. “It was mainly the new oil reserves that created the illusion of limitlessness and
technology optimism. The expansion of the world economies has nearly always increased
parallel to an increase in the use of fossil energy, and when that energy has been withdrawn, the
economies have shrunk accordingly” (Peura, 2012. p. 8). The extension of the impact of the
perfect cocktail of industrial revolution with oil discoveries in the early 20th century has shaped
the world we live in today.
In reality there clearly are limitations and it is necessary to learn to deal with them in
order to achieve development while reducing impact. At least three main economic forces offset
the limits imposed by natural resources (Stiglitz, 1974): technological change, the substitution of
man-made factors of production (capital) for natural resources, and returns to scale (firm’s
production function, the rate of increase in the output/production to the subsequent increase in
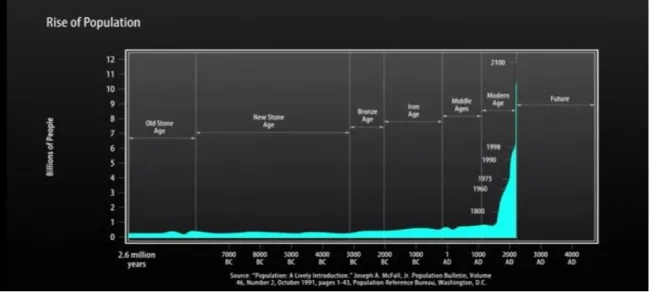
the inputs). These only go so far to mitigate the use of resources. As shown in the graph below,
in the 1960’s the world population was about 3 Billion people; 1B in the developed world and
2B in the developing. As shown by Hans Rosling (2010), today we are about 7.2 Billion people,
approximately 1B in the developed world, 1B in emerging economies, 3B in soon to be emerging
economies, and 2B still poor (low income segment of the population is where most of the
population growth normally occurs)2. It is expected that by 2050, the world will have 9 to 10
Billion people (Peura, 2012), a nightmare scenario without a sustainable development model to
shape human activities and to preserve and equitably develop our limited natural resources.
2
10
Figure 3. Population Growth (The age of sustainable development, Coursera 2014).
The planet’s capacity to absorb waste products of the human economy (CO2 in the
atmosphere, nitrates in the water, heavy metals in the soil) has become more limiting than the
available amount of potential natural resources itself (Kerschner, 2010). Impact can be estimated
using the IPAT equation, where I represents total ‘impact’, measured in tons of CO2, P is global
population, A denotes affluence, measured by GDP (Gross Domestic Product) per capita, and T
stands for ‘technology’ in the form of the CO2 emissions intensity of GDP (Kerschner, 2010).
For the analysis I=PAT, hence, lnI=lnP+lnA+lnT, differentiating all terms with respect to time
gives the relationship between the growth rate of the variables: Ỉ/I=Ṗ/P+Ả/A+Ṫ/T. As shown by
Hepburn & Bowen, in the past 20 years, annual population growth has been 1.3%, annual GDP
per capita growth has been 1.4%, and emissions per unit of GDP have been falling by 0.75%
p.a., and CO2 emissions have been growing at 2% per annum: Ỉ/I=1.3%+1.4%-0.7%=2% (2010).
In order for the emissions to fall, at the level required to achieve the 2°C change in global
temperature, Ỉ/I must be -4.9% (Hepburn & Bowen, 2010). This would require advances in
11 economic models that take carbon out of the system while at the same time slowing down the
increase of overall affluence. Another option would be reducing Ả/A for the rich and increasing it
for the poor, in a combination of de-growth (decroissance) for the rich with targeted-sustainable
growth for the poor (Kerschner, 2010). The term decroissance as it is called in French can be
used in order to show that it is necessary to take an integral approach, more than simply the
opposite to the traditional one dimensional-growth oriented one. If an economy is to de-grow
sustainably, it cannot reduce the quality of life of the people in developed nations, but rather their
unsustainable consumption levels and waste, this is to become efficient and effective following a
multidimensional approach.
The implementation of sustainable projects represent a significant short term investment
with long term return, for which it is important to consider that cost must always be judged in
relation to the environmental and social quality of the services provided, while also considering
the external costs and damages that would result from a possible adherence to unsustainable
energy systems (Müller-Steinhagen, Nitsch, 2005). The pursuit of fast economic growth,
disregarding environmental impact, believing that wealthy societies will be inherently less
damaging is reflected in the EKC (Environmental Kuznets Curve). The EKC attempts to show
whether economic growth will ultimately lead to specific environmental improvements.
However, even if environmental impact is reduced, it is important to understand how much drag
will environmental limitations exert on economic development, and if it can bring the global
economy to a halt (Hepburn & Bowen, 2012)3. A steady state economy in dynamic equilibrium
3
Empirical work done on the EKC shows that the hypothesis of less environmental impact as a result of income increase, is at best specific to
local pollutants; there is no clear evidence that the EKC holds at the global and general level. Evidence shows estimated turning points at per
capita incomes of between 1985 US$3,280 to $14,700 for a variety of local air and water pollutants, but for global pollutants such as CO2,
turning points are modeled to be well above incomes currently achieved by any nation, with an increasing pollution or with, at best, a small
12 is a necessity for a world with 9 billion people, dwindling resources and extreme weather due to
climate change, among other century challenges.
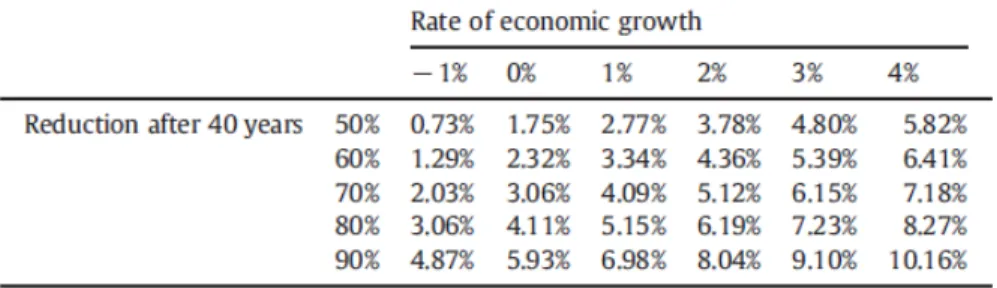
One of the major indicators of environmental damage that has been largely accepted and
documented is the levels of greenhouse gas emissions in the atmosphere. The table below shows
the scale and intensity requirements to achieve Greenhouse Gas (GHG) reduction targets, as
average annual GHG reduction rate in 40 years (Victor, 2011). For example an economy
growing at 2% for 30 years would require a 4.36% reduction of GHG emission per year in order
to cut 60% of GHG. Victor (2012) shows that at a basic level, any resource or environmental
flow can be understood as the combination of the scale of the economic activity and the flow
intensity (for example: GHG*GHG/GDP per year).
Table 1. Scale and intensity requirements to achieve Green House Gasses (GHG)
reduction targets (Victor, 2011).
Industrialized and emerging economies require specific development strategies,
according to their needs, responsibilities and challenges. The implementation of a Quasi Steady
State Economy (QSSE) in dynamic equilibrium, as presented by Kerschner (2010), would
require a global strategy beyond the reach of this research, yet necessary for the long term
13 as the combination of Sustainable De-growth (Decroissance4) for Industrialized Economies and
Sustainable Growth for Emerging Economies (QSSE=SDG+SG) in order to bring the global
economy to a state of dynamic equilibrium.
One can accept that, in some cases, economic growth improves environmental quality
while also holding that environmental limits will nevertheless prevent unbounded growth. While
total decoupling of economic growth from environmental impact is achieved, future growth must
damage the environment at a lesser rate, and eventually it should actually preserve some stock
level of natural capital altogether (Hepburn & Bowen, 2012). Given enough energy, a wasteful,
ineffective, inefficient and therefore unsustainable technology, would deplete and then dissipate
all concentrated deposits of minerals in the respective sinks of the lithosphere in a high entropy
state (Kerschner, 2010). To prevent this possibility we need a sustainable system, but how
should we define sustainability? The concept of ‘weak sustainability’ states that for economic
growth to be considered sustainable the total aggregate stock of capital, both physical and
natural, should not decline over time (Hepburn & Bowen, 2012). On the other hand, ‘strong
sustainability’ requires the preservation of natural capital (or at least some minimum quantity),
regardless of its substitutability. If long-term human welfare requires the preservation of stocks
of natural capital, then no manufactured capital can compensate for the loss of that natural capital
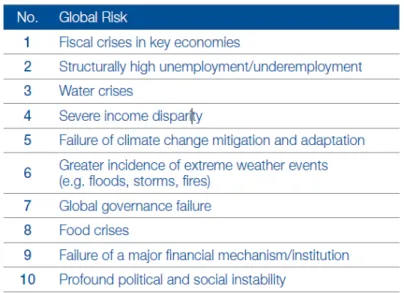
(Hepburn et al., 2012). The World Economic Forum (WEF) in its 2014 Global Risks report
presents challenges that seriously challenge the long-term sustainability of any corporation
invested in not harming others. Sustainable development is necessary to mitigate the effects of
most of the risks identified in the list below by the WEF.
4
14
Table 2.Global Risks (WEF Global Risks, 2014).
Sustainable development models provide an integral approach to long-term economic and
social development, integrating environmental considerations, according to specific local needs.
This research focuses primarily on energy as the main sustainability criteria, analyzing demand
and power generation from traditional and renewable energy sources and their relevance for the
sustainable development of the sustainable hospitality industry in the Sierra Nevada de Santa
Marta. The next section presents an overview of the energy landscape and the alternatives to
power sustainable development
2.1.1 RENEWABLE ENERGY SOURCES
Entropy production in energy conversion processes reduces exergy (energy consumption)
and changes the composition of and the energy flows through the biosphere and when these
15 environmental pollution5. According to the second law of thermodynamics the entropy of a
system approaches a constant value as the temperature approaches zero (Klimenko, 2012). The
planet’s temperature, as part of the solar system, will approach zero only when the energy from
the sun stops reaching it. The earth is a closed system but it is not isolated, as it receives a huge
amount of solar energy influx of which only about 3% or so is metabolized by plants, and
although energy cannot be recycled (depleted stocks of coal; oil and gas are lost forever) entropy
can increase in one system at the cost of another. The energy dissipated by the sun due to nuclear
combustion of its mass, could sustain the entropic arrow until the end of the Sun’s lifetime
(Kerschner, 2010). Therefore, planetary entropy can be sustained, making solar powered
economic and social development, and 100% recycling feasible since the law of conservation of
mass states that matter is neither produced nor destroyed, therefore, in a sustainable system,
energy from the sun can offset the ‘waste’ resulting from imperfect recycling. The key issue is
that waste should always tend toward zero accounting for the entropic resistance of materials.
Powering development with renewable energy technologies requires upgrade and
construction of infrastructure. The installations needed for the production of electricity from
renewable energy sources, must be constructed, operated, and finally dismantled at the end of
their useful life. Two parameters are used to quantify the effects from these processes on the
environment, in particular the ones related to raw materials and energy required for the
construction, and to compare it with the use of conventional energy sources (Müller-Steinhagen
and Nitsch. 2005): first the energetic amortization time, which is the time needed by an energy
system to provide the same amount of energy as required for its construction, operation, and
disposal, complemented by the cumulated greenhouse gas emissions, which relates to the CO2
5
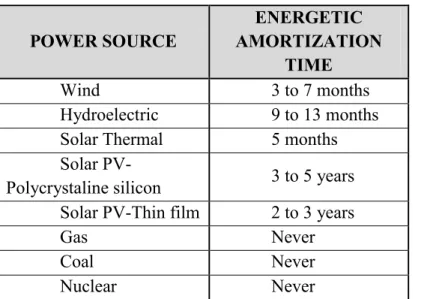
16 avoidance cost of renewable energy technologies. The table below presents amortization time for
different power sources.
POWER SOURCE AMORTIZATION ENERGETIC TIME
Wind 3 to 7 months
Hydroelectric 9 to 13 months
Solar Thermal 5 months
Solar PV-
Polycrystaline silicon 3 to 5 years
Solar PV-Thin film 2 to 3 years
Gas Never
Coal Never
Nuclear Never
Table 3. Energy amortization time of different electricity generation systems (adapted
from Müller-Steinhagen and Nitsch. 2005).
According to Müller-Steinhagen and Nitsch, while the energy required for the
construction of fossil fired or nuclear power plants is recovered within 2 to 3 months of
operation, these plants never amortize in terms of their overall operation, because they require
always more energy in the form of fuel than they produce in the form of electricity. Contrariwise,
a multiple of the energy required for setting-up and operating renewable energy systems is
produced within their operational lifetime, especially if the prices continue falling as is the
17
Figure 4. Future development of costs (current cost levels = 100%) for technologies for the use of renewables, derived from learning curves (Müller-Steinhagen and Nitsch. 2005).
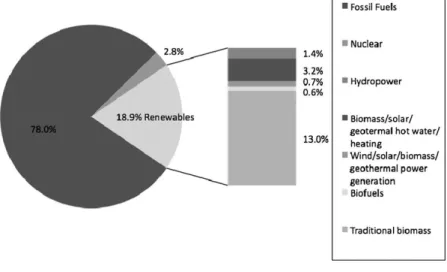
During 2008 (Figure 5, Below), renewable energies accounted for 19% of the global
primary energy; of which traditional biomass contributed with 13%, used for cooking and
heating, with a very slow growth in the world regions where it is being replaced by modern
energy technology. Large hydroelectric power represented about 3.2% with a growth reduction
in the last decade, mainly due to the increasing difficulty of finding floodplain areas and
environmental licensing. New renewables; represented by small hydroelectric power plants,
modern biomass, biofuels and energies like solar, eolic, and geothermal contributed 2.7%, used
mainly to generate electric power (0.7%), and produce sanitary hot water and heating (1.4%),
and the last 0.3% are used as transportation biofuels (Hernandez, Velasco, Trujillo, 2011).
Renewables are estimated to represent about half of the increase in global power generation
18 expansion in renewables (WEO, 2013). The energy forecast presents a positive trend for the
clean renewable component of the primary world energy, which could power economic
development without greenhouse gas emissions (GHG).
Figure 5. Participation of renewable energy within the framework of primary world energy (Hernandez, Velasco and Trujillo. 2011).
Growth of renewable energy sources from 2004 to 2009, for many renewable
technologies such as wind power, sped up in 2009 in comparison with the previous four years.
The graph below shows that grid-connected solar photovoltaic (PV) growth has been the fastest
of all renewable technologies, with a 60% annual average growth rate for the five-year period.
Biofuels also grew rapidly, at a 20% annual average rate for ethanol and a 5% annual average for
biodiesel (reflecting its lower production levels), although growth rates began to decline later in
the period (Hernandez, Velasco and Trujillo. 2011). These trends are important for emerging
economies in order to design energy strategies oriented towards energy source with reduced or
19
Figure 6. Growth of renewable technologies during the period: 2004–2009. Source: REN21. 2010 (as cited by Hernandez, Velasco and Trujillo. 2011).
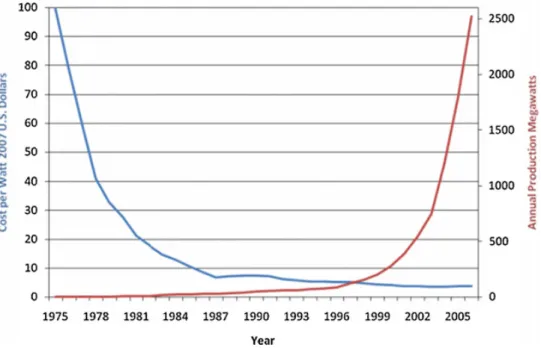
As shown in the next graph, the cost of PV modules in the last four decades has come
down significantly and in the last couple of years the market has also grown quite rapidly,
hinting a near term market growth of bulk silicon and thin film solar cells that is encouraging for
the industry (Hernandez, Velasco and Trujillo. 2011). These trends are very important when
considering energy sources to power the sustainable development of the hospitality industry.
Lower cost and higher efficiency will make investments in solar photovoltaic (PV) systems even
20
Figure 7, World PV production and cost per watt in the last about 30 years (Hernandez, Velasco and Trujillo. 2011).
Wadia (2009), Fthenakis, (2009) and Yoon, Song and Lee, (2009) all show an aggressive
development of non-silicon-based PV materials, driven by fluctuating silicon prices. For
example: iron sulphide (FeS2) would produce 10,000 times more electricity than silicon-based
PV (Hepburn & Bowen, 2012). To understand the future of renewables, photovoltaics in
particular, it is important to notice that market failures associated with environmental pollution,
interact with market failures associated with the innovation and diffusion of new technologies
with the following two approaches (Jaffe, Newell and Stavins, 2004): the first is to foster the
development and diffusion of new technology by designing environmental policies to increase
the perceived market payoff and maximize flexibility in compliance. The second approach is to
implement policies aimed directly at encouraging the development and diffusion of
environmentally friendly technologies. Innovation and technology diffusion respond to the
21 Therefore the right legal framework is paramount for the long term success of sustainable
hospitality projects.
Due to the change in the states’ and economies’ conception of photovoltaic systems and
economies of scale, the installation of smaller power plants has been made possible, highlighting
the importance of producing closely to the consumption centers. Hence, development and
implementation of distributed, more adaptable systems is emerging as a viable alternative in the
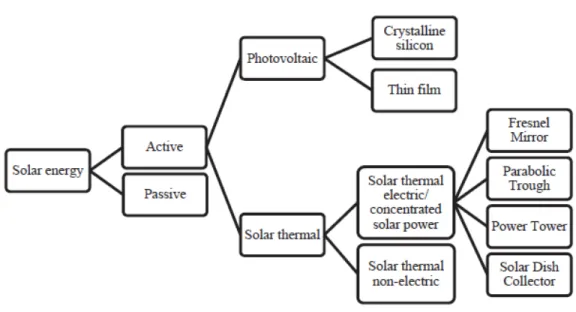
short and medium term (Hernandez, Velasco and Trujillo. 2011). Figure 8 shows the main
divisions of solar power technologies.
Figure 8. Assorted types of solar energy based on global market availability (Akikur, Saidur, Ping, Ullah, (2013).
The shift towards renewable solar energy is already happening globally. In 2009, about 7
GW of solar PV power capacity was installed world-wide (6.2 GW in the countries that report to
22 global shift toward grid-connected PV power world-wide is observed on the graphs below
(Muneer, 2011).
More than 80% of PV modules in current global production use mono and polycrystalline
silicon technology while thin film technology contributes to about 12%, with three photovoltaic
materials currently allowed to manufacture solar cells industrially: amorphous silicon (a-Si),
Cadmium telluride (CdTe) and Copper indium selenite (CuInSe2 (CIS)). Currently efficiencies
of 25% are achieved with the triple type junction panels (Hernandez, Velasco and Trujillo.
2011), which increases the financial viability of PV technologies. Yet, it is important to
remember that the extraction of such minerals6 must be done in a sustainable way, avoiding
unintended negative effects usually resulting from resource-intense extractive industries7.
6
www.mineralseducationcoalition.org/pdfs/Solar-Panel.pdf
7
www.bbc.com/news/magazine-16535620
Figure 9. Cumulative installed solar PV power capacity as per the IEA-PVPS (Muneer, 2011).
Figure 10. Percentages of grid-connected and off-grid PV power capacity as per IEA PVPS
23
Figure 11. Contribution of several technologies of photovoltaic modules to the worldwide market (Hernandez, Velasco and Trujillo. 2011).
New technological milestones continue to be achieved, showing a positive trend for solar
photovoltaics. On September 23th, 2013, The Fraunhofer Institute for Solar Energy Systems ISE,
Soitec, CEA-Leti and the Helmholtz Center Berlin announced a new world record for the
conversion of sunlight into electricity using a new solar cell structure with four solar sub-cells
with an efficiency of 44.7%8. These developments although encouraging still have to face
technical, financial, legal and cultural obstacles before reaching residential and commercial
projects. Yet, with an ever-growing global energy demand, PV prices going down and
considering the importance of the Energy criterion in human history; particularly since the
industrial revolution, it is necessary to analyze different scenarios and consequences of the
current levels of consumption. The following sections present a general overview required to
understand the levels of consumption and the potential for renewable energy sources in the
world, Hawai’i and the Sierra Nevada de Santa Marta.
8
24 2.1.2 GLOBAL ENERGY DEMAND
Since the beginning of the industrial revolution, energy consumption has increased far
more rapidly than the number of people on the planet. World-wide energy consumption, hence
the consumption of fossil resources in the form of coal, oil, and natural gas, has increased by a
factor of 60 to the present level of 425x1018 J/y, the average person today uses fifteen times more
energy than a person 130 years ago (Müller-Steinhagen and Nitsch, 2005). The current fast
growth is relatively recent; energy demand started to ramp up around 1950, while energy
consumption world-wide doubled between 1970 and 2000 and no fundamental change of this
growth trend is expected in the near future, since this incremental trend has only been altered by
temporary drops in the past, caused e.g., by the two world wars, the oil-price crises, or the
serious decline of industrial production in the states of the U.S.S.R (Müller-Steinhagen and
Nitsch. 2005).
According to the International Energy Agency (IEA), the energy sector is the source of
two-thirds of global greenhouse-gas emissions, and will be pivotal in determining whether or not
climate change goals are achieved. According to the World Energy Outlook (WEO) from 2013,
accounting for the impact of measures announced by governments to improve energy efficiency,
support renewables, and reduce fossil-fuel subsidies; and, in some cases, to put a price on
carbon, energy-related CO2 emissions will still rise by 20% to 2035. This leaves the world on a
path consistent with a long-term average temperature increase of 3.6°C, far above the
internationally agreed target of 2°C (WEO 2013, Executive summary, 2013). As presented in the
WEO-2013, the center of gravity of energy demand is switching decisively to the emerging
economies, particularly China, India and the Middle East (Figure 12), which drives global
25 Renewable energy sources will grow the most, fossil fuels will also increase, and
estimates show that both conventional and non-conventional oil reserves will meet the projected
world demand only for some 50 years and gas reserves correspondingly for 80 years (Peura,
2012). As seen before, renewables account for nearly half of the increase in global power
generation to 2035, with variable sources (wind and solar photovoltaics), making up 45% of the
expansion in renewables (WOE-Executive summary, 2013).
Figure 12. Primary energy demand and share of global growth, International Energy
Agency (World Energy Outlook, 2013)
It can be seen how unbounded growth in population (P) and its consumption (A),
powered by a dirty technology (T), would cause huge negative environmental impact (I). The
stress that our economies has been exerting on ecosystems since we have discovered and learned
to utilize fossil fuels, is good evidence, especially when we see the huge environmental and
social cost China is paying for its speedy growth. In order to reduce impact (I), T should be
26 of energy-related CO2 emissions in different IPCC scenarios compared to the historical process
and their impact on the atmospheric CO2 concentration and temperature can be seen on Figure
13. (A1FI = meeting growing energy demand mainly by fossil energies; ‘450’ and ‘550’ =
average values of scenarios which result in a stable concentration of CO2 (ppm) in the
atmosphere) (Müller-Steinhagen and Nitsch, 2005).
Figure 13. Development of energy-related CO2 emissions in different IPCC scenarios
compared to the historical process and their impact on the atmospheric CO2 concentration and
temperature (A1FI = meeting growing energy demand mainly by fossil energies; ‘450’ and ‘550’
= average values of scenarios which result in a stable concentration of CO2 (ppm) in the
atmosphere). Source: IPCC (2002)
The current increase of about 23.5 billion tons of CO2/y, resulting from the steadily
27 additional CO2 into the atmosphere since the beginning of industrialization, 80% of this amount
was emitted in the last 50 years. To keep the temperature rise within reasonable limits, the
current concentration of CO2 in the atmosphere of around 360 ppm must not be allowed to rise
above 500 ppm before the end of this century (Müller-Steinhagen and Nitsch. 2005). The figure
below shows how the level of CO2 in the atmosphere has spiked since the industrial revolution
up to a point today that is almost off the chart on the far right side. It is important to understand
the need for a dynamic and stable economy within environmental limits while addressing
challenges from our current stage of development.
Figure 14. CO2 concentrations (The age of sustainable development, Coursera 2014).
Another, perhaps greater sustainability problem is the huge disparity in energy
consumption between industrialized and developing countries; which has increased rather than
decreased in recent years, as shown in Figure 15. Today, 24% of the world’s population; in the
28 electricity, and as mentioned before, a person in North America consumes 15 times more energy
than one in Africa, and 30 times for commercial energy carriers, yet, the energy demand in
Europe and Japan is about 50% that of the U.S. (2.5 times the world average), indicating that
prosperity is not directly linked to high energy demand (Müller-Steinhagen and Nitsch. 2005). It
is possible to use less energy and still be an affluent economy, especially with the advent of
renewable energy sources with reasonable amortization rates.
Figure 15. Comparison of the per-capita energy consumption (1999) by countries (including non-commercial energy) (Source: IEA (2001) system (as cited by Müller-Steinhagen
and Nitsch. 2005).
The unequal per capita energy consumption shown in the previous graph is yet another
argument for sustainable development in an economy in dynamic equilibrium in which
29 state. The economic development of the so called poor-countries is limited by several factors,
including financial constraints that prevent them from fully taking advantage of technology
transfers and cause them to diverge from the growth rate of the rest world (Fung, 2009).
Financial and legal constrains created by under-developed financial markets, worsened by
outdated or inappropriate legal frameworks and weak rule of law in general make it more
difficult to motivate investment in R&D and baseline technologies, which are necessary inputs
for successful technology transfer. As the next section shows an appropriate set of policies can
make the difference, yet successful implementation of renewable energy systems will go just so
far, presenting new challenges and revealing old limitations. Integral multidimensional strategies
for sustainability reflected on long term sustainable policy can integrate and boost the massive
technology transfer required to bring down GHG emissions.
2.1.3 ENERGY SOURCES AND ENERGY DEMAND IN HAWAII
Hawaii is an island chain lacking fossil fuels and must import relatively expensive
petroleum for the generation of 70% of its electricity; therefore electricity generation cost in
Hawaii is pegged to oil prices, making the residential electricity rate 3 times that of the rest of
the United States. In addition each island must possess enough generating capacity to meet local
demand and provide emergency reserves, since they can’t be interconnected9. The electricity rate
in Hawaii went up 50% between 2009 and 2012 (Blue Planet Foundation, 2014).
9
30
Figure 16.Hawaiian retail electric prices (U.S. Energy Information Administration and
IntercontinentalExchange Inc, 2013).
As recently as 2008, oil and coal represented more than 90% of Hawaii's annual electric
generation. The petroleum share of electric generation has been reduced, from 81% in 2002 to
72% in 2013 (through November). Meanwhile, generation from renewable sources has climbed
from a 4% share in 2002 to more than 12% in 2013, in many regards as a result of the
implementation of programs such as feed in tariff10 and net metering11. Generation from coal
comes from a single 180-megawatt (MW) facility on Oahu and has been relatively steady at
13%-15% of total generation each year12. Recently HECO (Hawaiian Electric Company) has
enraged the solar industry after an unfavorable media release about Rooftop PV13. Grid tied PV
system represent a change in the way energy grids were designed. As shown in the graph below,
from a presentation made by Dora Nakafuji, director of renewable energy planning for Hawaii
10
www.heco.com/portal/site/heco/menuitem.508576f78baa14340b4c0610c510b1ca/?vgnextoid=0b0a8618ce4f721 0VgnVCM1000005c011bacRCRD&vgnextfmt=default&cpsextcurrchannel=1
11www.hawaiianelectric.com/heco/Clean-Energy/Clean-Energy-Generation/Net-Energy-Metering-in-Hawaii 12
www.eia.gov/todayinenergy/detail.cfm?id=15091
13
31 Electric Co. (HECO), at the DistribuTECH conference in San Antonio, Texas14. Oahu shows a
Loch Ness profile for energy demand during its daily cycle, causing unforeseen effects on the
energy grid. Energy demand drops when rooftop solar PV energy supply exceeds the energy
demand on those circuits around midday. Then when the sun fades away, in late afternoon, the
energy demand goes back up, only to diminish once again late at night, giving the name to the
profile. This presents a truly challenging situation in terms of turning down oil-fired generators
when solar is at its peak, then ramping them up much faster than it is used to when solar power
availability declines15. This is to show some of the challenges renewable energy must face to
power sustainable development. The need for a smart grid able to handle distributed generation
from diverse renewable energy sources in changing scenarios like the one shown on the graph
below.
Figure 17, Energy load profile (HECO, 2014).
14
www.theenergycollective.com/jeffstjohn/339451/hawaiis-solar-grid-landscape-and-nessie-curve
15
32 2.1.4 ENERGY SOURCES AND ENERGY DEMAND IN COLOMBIA
Negative environmental impact due to energy generation is a critical sustainability factor
in the US, since today everybody is looking at the CO2 emissions caused by oil and coal boilers.
In Colombia energy is generated through hydroelectric plants with much lower levels of CO2
emissions resulting from energy generation, but there are other impacts which are usually
ignored. The negative social and environmental impact from hydroelectric projects is usually out
of sight, making the transition to renewable energy sources, apparently less pressing for many
industries.
Between 2002 and 2012 the Colombian economy grew at an annual average rate of 4.6%,
population grew at about 1.2%. The country’s energy demand grew by 2.9%, slowed down by
the effects of the 2008 crisis felt throughout 2009, and it is projected to average 3.9% between
2012 and 2020 (UPME, 2013). According to the demand projections from the UPME (Unidad de
Planeacion Minero Energetica), unit from the Energy and Mines Ministry of Colombia, in 2012
Colombia’s energy demand was 1000PetaJoules16, 67% from fossil fuels, 13% from biomass and
20% from electricity (about 20% of electricity comes from fossil fuels, and 7% of the gasoline
and diesel is biofuel) (2013). As shown in the graph below solar and wind are not part of the
energy landscape of the country.
16
33
Figure 18.Final energy demand in Colombia (UPME, March report 2013).
The Colombian constitution in its article 80 establishes that the Colombian State will plan
the use and management of natural resources for their sustainable development. However,
Colombia’s strategy regarding renewable energy is still at a very basic stage. The trend of energy
policies in Colombia, regarding renewable energy sources, can be summarized in the Law 697 of
200117, also called Law URE (Rational Use of Energy), Decree 3683 of 200318. The law 697 of
October 3, 2001, declared URE (Rational Use of Energy) a matter of public and national interest.
Its main objective is to guarantee timely and sufficient energy supply, improve competition and
to protect the consumer. In this law sustainable development is defined as the development that
boosts economic growth, improves quality of life and social wellbeing, without depleting natural
resources and the environment in general, and respecting the right for future generation to use it
for their own needs.
17
www.alcaldiabogota.gov.co/sisjur/normas/Norma1.jsp?i=4449
18
34 As a result of its secondary role, the development of photovoltaic systems in Colombia
has been focused mainly on the rural sector in electrification programs (small systems of 50–
70Wh, US$1200-1500, for lighting, radio and TV, and other basic needs of the peasants), with
strong state funding, currently using resources like FAZNI (Fondo de Apoyo Financiero para la
Energización de las Zonas No Interconectadas) and the IPSE (Instituto para la Promoción de
Soluciones Energéticas); currently leading the State’s actions in the Colombian countryside
(Hernandez, Velasco and Trujillo. 2011). This is to show that Colombia’s energy strategy
regarding renewable energy sources, solar and wind in particular is insufficient to provide a
competent regulatory framework and market mechanisms for up-front cost financing of
residential and non-residential projects. As shown on Figure 19 and 20 Colombia’s coverage has
been matching increasing demand, providing coverage for 94.4% of the national territories.
Figure 19. Total energy demand residential and non-residential (UPME, 2010)19.
19
35
Figure 20. Percentage of electricity service coverage in Colombia. Period 2000-2008
(UPME, 2010).
The graph below (Figure 21) shows energy prices in Colombia decreasing between 2009
and 2010, yet the trend from the previous years could suggest a high probability for energy
prices to present an overall upward tendency.
Figure 21. Energy price trend 2002-2010 $/kWh (UPME, 2011) 20
Electricity prices in Colombia could increase especially as a result of extreme weather
events, such as the El Niño effect presented in the chart below (Figure 22). As shown previously
20
36 renewable energy sources do not represent extra cost in order to operate and produce electricity.
This stable, almost fixed kWh price, given by renewable energy sources is yet another reason to
increase the likelihood for renewable energy sources to become relevant in Colombia’s energy
policy and key for the implementation of sustainable strategies.
Figure22.Average price evolution in $Kwh at 2008 constant prices de 2008 (UPME,
2010)21.
The implementation of renewable energy technologies in Colombia besides requiring an
appropriate policy framework also needs greater environmental corporate awareness, beyond
whitewash, CSR and CER (Corporate Environmental Responsibility) imbedded in the corporate
DNA so industries can exert pressure for the development of comprehensive sustainable
strategies. Analyzing CSR activities in the Lodging Industry, Levy and Park present the results
of a survey of the US-based hotel executives showing that the most important and highest
performing initiatives had a tendency towards popular environmental practices focused on
energy, waste and water management (2011). The next section shows how the development of
21
37 industries with reduced or zero negative impact has become a priority for corporations in
developed economies, particularly in the US and the Eurozone. Due to the global nature of
critical issues previously discussed, global convergence towards sustainable practices can be
expected, especially in regions that have abundant natural resources where low impact industries
like sustainable hospitality can be developed instead of extractive resource intensive industries
presenting short term profit but long term environmental losses.
2.1.5 SUSTAINABLE HOSPITALITY
Negative environmental and social impacts reduce revenues and increase operating costs,
and employee costs. Adopting sustainable hospitality procedures and technologies can provide a
significant competitive advantage to businesses in the hospitality sector. According to the EPA
(Environmental Protection Agency), sustainable hospitality focuses on reducing the
environmental, social and economic impact of the hospitality sector, which covers: lodging,
restaurants, food and beverage operations, venues, events and meetings, and sporting events
(2013). According to Ernst & Young, the role and the need for sustainability have not been front
and center of the business strategy, yet it has been lingering in the background. Although
companies may not talk about climate change per se, many are being affected by indirectly due
to deforestation and shrinking biodiversity, that are affecting the availability of agricultural
products, resulting in the hospitality industry increasingly connecting the dots between risk
38
Figure 23. Sustainability in Corporate strategy (Ernst & Young, 2013. p7).
The graph above shows the result from a survey of 283 executives and leader in 17
industries from companies generating US$1billion in renews (Approximately 85% from the
U.S.). It shows how more and more companies are taking care to address the issue of
sustainability at the core of their business strategies. Sustainable hospitality development focuses
on how to manage the natural, man-made and socio cultural resources of host communities in
order to meet the following fundamental criteria: promoting the company’s economic well-being
and self-sufficiency, protecting natural and socio-cultural capital, achieving intra and
intergenerational equity in the distribution of costs and benefits, and satisfying the needs of
tourists (Briassoulis, 2002). The hospitality industry’s connection with almost all sectors of the
host economy has a multiplying effect for the promotion of sustainable practices, especially since
39 consumption, use of consumable products, and solid and hazardous waste generation (EPA,
2013).
Hospitality is an industry in need of a sustainable approach to mitigate intensive use of
resources in everyday operations. Energy use intensity (EUI) ranges from less than 100 to more
than 800 kBtu/ft2 across all hotel buildings in the US, with those at the 95th percentile using
about 4 times the energy of those at the 5th percentile. The distribution has a negative skew,
which means the most energy intensive buildings are much further away from the median than
the most efficient (Energy Star, 2012), as shown on the figure below.
Figure 24. Energy Use Intensity (Energy Star, 2012).
Energy production, as well as its efficient use, is paramount for the long-term
sustainability of any organism. Buildings and organizations are no exception. A buildings energy
use can vary for many reasons, including variable equipment efficiency and energy management
practices, as well as variations in climate and business activities. As shown in figure below
40 economy, in which economic growth and development is decoupled from environmental impact,
applying sustainable practices for the eco-effective use of resources (Braungart, McDonough,
Bollinger, 2006).
Figure 25.The material economy is bounded by the ecosystem; the intellectual economy
is not (Hepburn and Bowen, 2012).
Lack of methods to enforce and promote sustainable management and regulate green
messages in tourism has led to an increasing number of voluntary initiatives in the form of codes
of conduct, manuals, awards and ecolabels (Font, 2002). The sustainable and harmonic
development of the hospitality industry, in tune with local communities and with clear positive
impact on the environment and local processes is highly relevant. Standards and certifications are
being implemented as shown by Green Globe certification’s worldwide expansion and the
proposals for a European label and the Sustainable Tourism Stewardship Council seem to be the
framework in which the current ecolabels need to wrestle to maintain their identity, ensure
exposure and credibility, and gain more positioning with people being more exposed to the
effects and information regarding environmental challenges, like extreme weather and climate
41 evaluation and adaptation that address environmental impact but not necessary sustainability. As
it is shown in following sections the hospitality industry must go beyond green-wash, and truly
implement integral approaches that could yield long term benefits at different levels of the
company from addressing important environmental criteria such us energy, water and waste.
2.1.5.1 LIFE CYCLE ENERGY ANALYSIS (LCEA)
Achieving energy efficiency is a key issue for sustainable hospitality. One of the energy
use assessment tools hotels can use is the Life Cycle Energy Analysis (LCEA), which is based
on the original four-step LCA (Life Cycle Analysis) methodology, however it focuses only on
energy and concomitant carbon emissions as the only measure of environmental impacts as
shown in the figure 26 below (Filimonau, Dickinson, Robbins and Huijbregts. 2011).
Achieving effective energy benchmarking for hotels is integral in fostering the
sustainable development of the lodging sector. Energy is needed for all everyday duties of a hotel
such as food and materials processing, heating and cooling, illumination, and transport. In
Greece and Spain, hotels are the principal energy consumers among commercial buildings, being
responsible for about 1/3 of their country’s total energy demand; in France, the UK and USA the
share of hotels is lower, nevertheless significant: 18%, 16% and 14% of the energy demand
respectively (Filimonau, Dickinson, Robbins and Huijbregts, 2011). Benchmarking based on
facilities should be the first priority for hotel management or owners (Chan 2012). Since most
commercial buildings haven’t been built to be sustainable, too much energy is wasted in hotels
and buildings in general, thus presenting opportunities for the implementation of energy
conservation, energy efficiency and energy effectiveness practices. Although LCEA will get the
industry closer to energy efficiency, sustainable hospitality requires a broader and more integral
42 building, yet it lacks the integrality and interconnectedness needed for long term sustainability.
Life cycle analysis is only an aspect of multidimensional sustainability analysis, as this research
shows in following sections.
Figure 26. Simplified lifecycle diagram of a building. Modified from Kellenberger and
Althaus (2009); Scheuer et al. (2003). The white color represents the pre-operational phases of
43 corresponds to the building’s operations. The dark gray color indicates the end-of-life stages of
the building life frame (Filimonau, Dickinson, Robbins and Huijbregts. 2011).
2.1.5.2 SYSTEMS THEORIES
Although LCEA is a good attempt to become more efficient, it is not enough. As
previously shown in the IPAT equation, in order for the emissions to fall, at the level required to
achieve the 2°C change in global temperature, Ỉ/I must be at least -4.9% (Hepburn & Bowen,
2010). This would require Ṫ/T to fall at a high rate, requiring technologies and economic models
that take carbon out of the system and at the same time increasing the overall affluence at a lesser
rate. There are 7 systems theories: Laws of Ecology, Looped (later known as Performance)
Economy, Regenerative Design, Biomimicry, IndustrialEcology, Cradle to Cradle and Blue
Economy.
Figure27. The seven systems theories set up in a time line and their relation to Cradle to
Cradle (Dijk, Tenpierik and Dobbelsteen, 2013).
These theories try to consider 5 “Kingdoms of Nature” (bacteria, algae, fungi, animals