Review Article
Urban green space cooling
e
ff
ect in cities
Farshid Arama, Ester Higueras Garcíaa, Ebrahim Solgib,∗, Soran Mansourniac
aEscuela Tecnica Superior de Arquitectura, Universidad Politecnica de Madrid-UPM, Madrid, 28040, Spain bSchool of Engineering and Built Environment, Griffith University, Australia
cFaculty of Architecture and Urbanism, University of Art, Tehran, Iran
∗Corresponding author.
E-mail address:ebrahim.solgi@griffithuni.edu.au(E. Solgi).
Abstract
Urban green spaces are considered an appropriate way to reduce urban heat island
effects and provide comfort to the nearby occupants. In addition to cooling the
actual space, urban green spaces are also able to influence the surrounding area,
and this phenomenon is called the urban green space cooling effect. The most
important issues with regard to the cooling effects of urban green spaces are the
intensity and density of the cooling, which can play a major role for urban
designers and planners in dealing with urban heat island. This article reviews the
latest studies that have examined the cooling effects of urban green spaces in
recent years. Based on the method of evaluation of their samples, the studies are
divided into three groups. The first category consists of research into a set of
urban green spaces in one part of or in an entire city, mainly conducted through
remote sensing and satellite maps. The second category investigates city parks or
several urban parks with recognizable shapes and locations. In this section,
information was mainly gathered by virtue of field observations. The third
category relates to studies in which a part of urban space according to different
scenarios of green space placement was modeled by simulation. The results of
the present study illustrate that the highest cooling effect distance and cooling
effect intensity are for large urban parks with an area of more than 10 ha;
however, in addition to the area, the natural elements and qualities of the urban
Received: 3 January 2019 Revised: 6 March 2019 Accepted: 8 March 2019 Cite as: Farshid Aram, Ester Higueras García, Ebrahim Solgi, Soran Mansournia.Urban green space cooling effect in cities.
Heliyon 5 (2019) e01339. doi: 10.1016/j.heliyon.2019. e01339
https://doi.org/10.1016/j.heliyon.2019.e01339
green spaces, as well as climate characteristics, highly inform the urban green space
cooling effect.
Keywords: Energy, Environmental science
1. Introduction
The intensified accumulation of greenhouse gases in the Earth’s atmosphere has led to rapid changes in global temperature trends and climate (IPCC, 2017;Ng and Ren,
2017). While disrupting our daily lives and causingfinancial losses, these changes
are further expected to have serious safety, security, and health implications
(Demuzere et al., 2014;Heltberg et al., 2008;Ebi and Paulson, 2007;Khanian et al.,
2018). In urban areas, this issue has been exacerbated by another modern phenomenon
called the Urban Heat Island (UHI) effect (Taha et al., 1988;Oke, 1982). Owing to UHI
effect, an urban area can be on average 1.0e6.0C warmer than the nearby non-urban regions (Dimoudi et al., 2013). For example,USGCRP (2017)reported that because of
UHI effect, American cities experience 0.5e4.0C higher daytime air temperatures and 1.0e2.5C higher night-time air temperatures than the nearby rural areas. The UHI effect has several causes, including the increased absorption of sunlight by
dark-colored surfaces of buildings, the physical properties of the materials
commonly used in urban areas, the imposition of heat in the urban space due to
the urban morphology which affects shading and air movement, the urban
compact-ness which stems from density, plot ratio, land-use and travel proximity, and the
deficiency in urban green spaces (Giridharan and Emmanuel, 2018; O’Malley
et al., 2015;Kaloustian and Diab, 2015;Xi et al., 2012;Priyadarsini et al., 2008).
This phenomenon is also exacerbated by the growing size of the city dwelling human
population and the increasing rate of energy consumption (Mirzaei, 2015;Battista
et al., 2016). Research has shown that cities currently account for 60e80% of the
world’s total energy consumption (Kamal-Chaoui and Roberts, 2009). It was also indicated that distance from UHI is a key factor affecting heating and cooling loads
and thus the effect of urbanization on energy demand (Kolokotroni et al., 2010).
Since it has been estimated that the ratio of world urban population to total
popula-tion is set to increase from 54% in 2016 to 60% in 2030 (UN, 2016), UHI can be
expected to become a major challenge in the future urban life.
There is an extensive body of literature on the available strategies to reduce the UHI
effect (Aflaki et al., 2017;Rosenfeld et al., 1998;Azevedo and Leal, 2017;EPA,
2008;Wang et al., 2016;Huang et al., 1990). In general, the methods currently
avail-able for this purpose can be categorized into four groups: the use of vegetation cover
like trees, shrubs and lawns at different scales (Gago et al., 2013; Mackey et al.,
2012), the stack night ventilation (Kolokotroni et al., 2006), the use of waterbodies
2 https://doi.org/10.1016/j.heliyon.2019.e01339
2405-8440/Ó2019 The Authors. Published by Elsevier Ltd. This is an open access article under the CC BY license (http://creativecommons.org/licenses/by/4.0/).
(Gunawardena et al., 2017;Moyer and Hawkins, 2017;Daniel et al., 2018), and the
use of materials with high albedo rating for pavement and other ground surfaces
(Pacheco-Torgal, 2015;Santamouris, 2013;Li et al., 2013a,b;Taha et al., 1988).
The effectiveness of green infrastructure in reducing urban thermal islands is already
proven through measurements (filed measurements, scale models, and thermal remote
sensing), and computer simulation (Farhadi et al., 2019;Lai et al., 2019;Z€olch et al.,
2016;Norton et al., 2015;Chow and Brazel, 2012;Wong and Yu, 2005). The literature
related to this subject consists of broad investigations into green infrastructure of
different shapes and scales (Wang and Banzhaf, 2018), including small local parks
(Ca et al., 1998;Aram et al., 2019), large urban parks (Petralli et al., 2009;Buyadi
et al., 2015), urban forests (Oke et al., 1989; Brandt et al., 2016), urban gardens
(Mazhar et al., 2015), green roofs (Santamouris, 2014;Alcazar et al., 2016;Besir and
Cuce, 2018), green facades (Demuzere et al., 2014;Manso and Castro-Gomes, 2015),
and street trees (Lobaccaro and Acero, 2015;Shahidan et al., 2010;Klemm et al., 2015).
The majority of investigations into the effect of features and dimensions of urban
green spaces (UGSs) on UHI have been conducted over the past ten years (Akbari
and Dionysia, 2016). According to a review study published in 2010 (Bowler
et al.), green infrastructure (trees, parks, forests, and green roofs) have a higher level
of thermal comfort than other urban spaces. This is especially true for larger parks
and urban forests (UGS), which can have up to 0.94C lower daytime temperatures. Another recent review study has shown that thermal comfort and the UHI reduction
effect of a UGS depends on its size and shape. According to this study, the cooling
effect of an UGS is directly correlated with its vegetation cover and tree shade area
(Jamei et al., 2016). In a recent review paper byTaleghani (2018), among the
stra-tegies for reducing the effect of UHI, the role of effective UGSs has been
empha-sized. By taking six Urban Parks Studies (UGS) into account, it has also been
demonstrated that these spaces play a major role in UHI reductions.
Hence, thanks to their vast area and diverse vegetation cover, urban parks have a
much more significant cooling and thermal comfort impact than small green spaces
(Givoni, 1991). As a result, these parks have become known as effective
counter-measures against the UHI effect. In the urban studies and sustainability literature,
the cold aura around urban parks has become known as“Park Cool Island”(PCI)
(Cao et al., 2010; Spronken Smith and Oke, 1998) and lately, as “Green Space
Cool Island” (GCI) (Martins et al., 2016; Du et al., 2017). A recent study by
Bartesaghi Koc et al. (2018)showed that from all the studies conducted on the
cool-ing effect of green infrastructure, the contribution of the cooling effect of parks and
UGSs was 10.9% (PCIs: 6.7% and GCIs 4.2%). PCI or GCI generally refers to the
cooling impact of an UGS not only on the area within the park but on the
surround-ing area as well. Modern development plannsurround-ing science considers the UGS coolsurround-ing
effect to be a highly effective solution for dealing with thermal islands.
3 https://doi.org/10.1016/j.heliyon.2019.e01339
2405-8440/Ó2019 The Authors. Published by Elsevier Ltd. This is an open access article under the CC BY license (http://creativecommons.org/licenses/by/4.0/).
Although the growing public and academic attention to UHI has encouraged
research into this subject, the studies andfindings in relation to the cooling effect
of UGSs are yet to be summarized in a review. While there are some review studies
on the cooling effect of urban parks, they are not specific and also cover other green
infrastructure such as street trees, green roofs and green facade (Bowler et al., 2010;
Jamei et al., 2016;Taleghani, 2018). The present study aims to review and categorize
the recent studies carried out regarding the relation of characteristics of UGSs to their
cooling effect, in order to facilitate the study of data collection and analysis methods
commonly used in this area, and thus assist future planning and development
at-tempts to use urban parks and urban gardens for creating the cooling effect and
coun-tering the UHI effect.
2. Main text
2.1. Research methodology
This paper is a systematic review of recent research on the utilization of UGSs for
creating a cooling effect. Initially, a search was conducted for all articles that discuss
urban greening at any scale with the purpose of creating thermal comfort and a
cool-ing effect. Among these articles, those that included case studies on UGSs, in turn
including parks, gardens and local green spaces were shortlisted. Since one section
of the latest review study on the impact of green spaces on UHI(2010) (Bowler
et al.) was dedicated to urban parks and green spaces, the articles published before
2010 were excluded. The remaining recent articles werefirst studied in greater detail.
Studies on the relation of UGSs to their cooling effect can be classified into three
categories: (i) studies that investigate the combined impact of a group of UGSs
and provide no specific information about the characteristics of individual green
spaces; (ii) studies that contain specific information about the region and location
of the cases studied; (iii) studies in which the cooling effect of UGSs has been
exam-ined using computer simulation based on several scenarios regarding the specifi
ca-tions of the green space. After reorganizing the data into the aforementioned
categories, articles in the same category were compared in terms of quantitative
and qualitative data andfindings, including the number, shape, size, and dimensions
of green spaces, the type of vegetation cover, and the resulting cooling effect.
Conse-quently, the results of this review will be presented in three sections.
2.2. Cooling e
ff
ect of a group of urban green spaces
In this section, the studies that have investigated the combined impact of a group of
UGSs on a certain part or the entire domain of a city (Table 1) are examined. In
gen-eral, the objective of these studies is to determine how effective is a group of urban
green spaces in reducing UHI and cooling the environment. Given the well-known
4 https://doi.org/10.1016/j.heliyon.2019.e01339
2405-8440/Ó2019 The Authors. Published by Elsevier Ltd. This is an open access article under the CC BY license (http://creativecommons.org/licenses/by/4.0/).
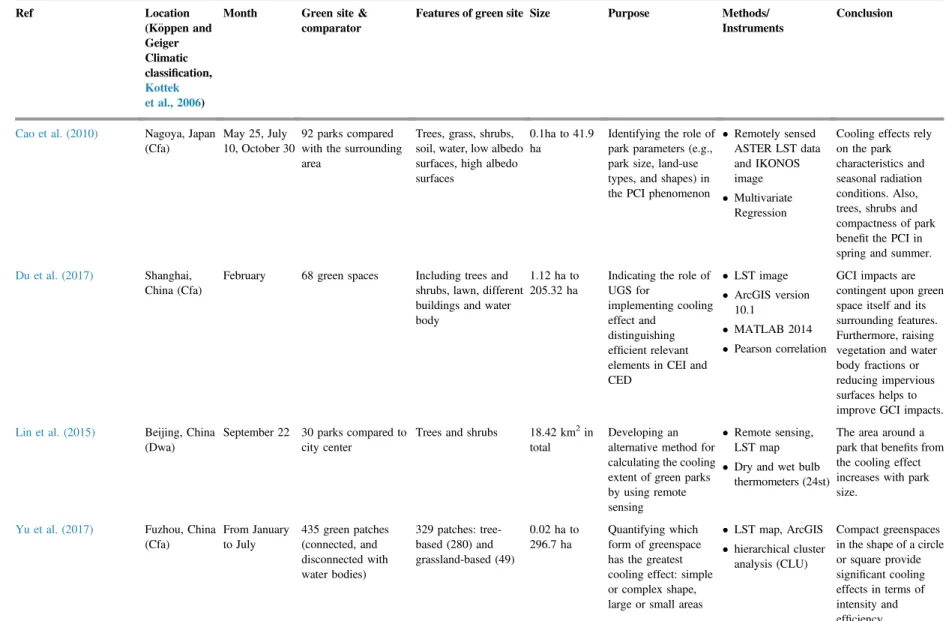
Table 1.Summary of studies investigating the cooling effect of a group of UGSs.
Ref Location
(K€oppen and Geiger Climatic classification, Kottek et al., 2006)
Month Green site & comparator
Features of green site Size Purpose Methods/ Instruments
Conclusion
Cao et al. (2010) Nagoya, Japan (Cfa)
May 25, July 10, October 30
92 parks compared with the surrounding area
Trees, grass, shrubs, soil, water, low albedo surfaces, high albedo surfaces
0.1ha to 41.9 ha
Identifying the role of park parameters (e.g., park size, land-use types, and shapes) in the PCI phenomenon
Remotely sensed ASTER LST data and IKONOS image
Multivariate Regression
Cooling effects rely on the park characteristics and seasonal radiation conditions. Also, trees, shrubs and compactness of park benefit the PCI in spring and summer.
Du et al. (2017) Shanghai, China (Cfa)
February 68 green spaces Including trees and shrubs, lawn, different buildings and water body
1.12 ha to 205.32 ha
Indicating the role of UGS for
implementing cooling effect and
distinguishing efficient relevant elements in CEI and CED LST image ArcGIS version 10.1 MATLAB 2014 Pearson correlation
GCI impacts are contingent upon green space itself and its surrounding features. Furthermore, raising vegetation and water body fractions or reducing impervious surfaces helps to improve GCI impacts.
Lin et al. (2015) Beijing, China (Dwa)
September 22 30 parks compared to city center
Trees and shrubs 18.42 km2in total
Developing an alternative method for calculating the cooling extent of green parks by using remote sensing
Remote sensing, LST map
Dry and wet bulb thermometers (24st)
The area around a park that benefits from the cooling effect increases with park size.
Yu et al. (2017) Fuzhou, China (Cfa)
From January to July
435 green patches (connected, and disconnected with water bodies)
329 patches: tree-based (280) and grassland-based (49)
0.02 ha to 296.7 ha
Quantifying which form of greenspace has the greatest cooling effect: simple or complex shape, large or small areas
LST map, ArcGIS
hierarchical cluster analysis (CLU)
Compact greenspaces in the shape of a circle or square provide significant cooling effects in terms of intensity and efficiency
(continued on next page)
Table 1.(Continued)
Ref Location
(K€oppen and Geiger Climatic classification, Kottek et al., 2006)
Month Green site & comparator
Features of green site Size Purpose Methods/ Instruments
Conclusion
Feyisa et al. (2014) Addis Ababa, Ethiopia (Cwb)
October 4e18 21 green areas: public parks, green spaces around building and private parks.
Green areas with dense tree vegetation (canopy cover of at least 60%)
0.85e22.3 ha Identifying the physical
characteristics of USG which determine cooling efficiency and examining its extent of extension
NDVI index
ArcGIS version 10.0
Regression model
Appropriate choice of species, geometry and size of parks may improve efficiency of urban cooling
Anjos and Lopes (2017) Aracaju, Brazil (As)
July 19 to October 10
UGS around 7 urban climate stations in different parts of the city
Vegetated area: from 2.2% to 53% Water bodies: From 0 to 50%
Not mentioned Assessing the UHI and PCI effects based on an urban climatological network
Climatic sensor
Local Climate Zone map
Most UHI and PCI intensities do not develop only in the light winds and clear sky But these factor have remarkable impact
Brown et al. (2015) Kuala Lumpur, Malaysia (Af); Lahore, Pakistan (Bsh); Alice Springs, Australia (Bwh); Kyoto, Japan (Cfa); Toronto, Canada (Dfb)
10 years data Five different zones were compared
Five sites infive different climate zones
Various sizes Recognizing the effect of microclimate modifications on thermal comfort caused by elements in the landscape
Simulated by hu-man thermal com-fort model COMFA
Decreasing air temperatures through a‘cool island park’is a moderately effective strategy
Chang and Li (2014) Taipei, Taiwan (Cfa)
August to September and December to February
60 urban parks were surveyed and compared with the surrounding area
Trees, shrubs and pavement
Various sizes Exploring details related to the planning and design of city parks such that they may effectively cool surrounding urban areas
Thermal sensor
Stationary regres-sion method
Parks and other open spaces should be designed with less than 50% paved area and at least 30% trees, shrubs, and other shadings.
(continued on next page)
Table 1.(Continued)
Ref Location
(K€oppen and Geiger Climatic classification, Kottek et al., 2006)
Month Green site & comparator
Features of green site Size Purpose Methods/ Instruments
Conclusion
Chen et al. (2014) Beijing, China (Dwa)
May 22, July 9, October 13 and November 14
Measured 6 types of UGS: wood-land, shrub land, grassland, cropland, rivers, lakes
UGS covering 35% of the overall study area
Total size: 6450 ha
Focusing on the effects of spatial patterns of urban green patches on their own surface cooling effect
LST map & Quick-Bird (QB) image
Regression analyses
In addition to patch size, the other elements such as shape, edge or connectivity have cooling effects
Sun and Chen (2017) Beijing, China (Dwa)
July 5 and July 29
Five types of UGS: Impervious land (IL), forest land (FL), grass land (GL), water body (WB), and bare land (BL).
Ringroad 5 of the city Total size: 108.86 km2 Investigating the dominant combinations of landscape conversions (2012), and quantifying the change of mean LST
ENVI software QuickBird (2002) and IKONOS (2012)
TM images
Greater focus on protecting natural forests in cities might provide greater benefits for climate mitigation.
Buyadi et al. (Dec 2013) Shah-Alam, Malaysia (Af)
February 21 and January 21
Study site situated in center of the city with various kind of land use and green spaces
Water bodies, high dense trees, mixed vegetation
Total size: 8530 ha
Surveying the influence of development on UGS and UHI
LST map
NDVI assessment
Decreasing the vegetation land cover in open spaces has a direct correlation to increasing UHI
Li et al. (2013a,b) Beijing, China (Dwa)
September 8 and October 4
Seven landscape Metrics, based on easily calculated, interpretable, and little redundancy
Not mentioned 0.52 ha to 0.89 ha
Examining the effects of spatial resolution on the relationship between LST and the spatial pattern of greenspace
ENVI 4.6 Quick-Bird, SPOT, and TM imagery
Pearson and partial Pearson correlation
The relationship between LST and the abundance of greenspace was negative, but with the spatial configuration of UGS varied by spatial resolution (continued on next page)
Table 1.(Continued)
Ref Location
(K€oppen and Geiger Climatic classification, Kottek et al., 2006)
Month Green site & comparator
Features of green site Size Purpose Methods/ Instruments
Conclusion
Kong et al. (2014) Nanjing, China (Cfa)
June 13 Part of the city includes the urbanized area of Nanjing and part of its suburbs
Impervious surface, water body, agricultural land, forest vegetation, and barren land
Total size: 9200 ha
Investigating the sensitivity of the cooling effect associated with greenspace to changes in scale; Correlation analyses IKONOS image CEI and characteristics formed by greenspace patterns, and increasing vegetation provide cooling effect
Zhang et al. (2014) Beijing, China (Dwa)
June to August 6387 green space Trees, shrubs, grass, tree-shrubs, shrub-grass
Total size: 22,556 ha
Measuring the ecological benefits of the cooling effect associated with the use of green spaces
Empirical model (11 weather stations)
The cooling effect and the environmental benefits of UGS largely depend on the green space’s structure and size
Mariani et al. (2016) Milan, Italy (Cfb)
33 years data (1981e2014)
Five metropolitan sites
Different sites in various zones (rural, urban parks, sites located in canyons of the urban plateau, and urban peaks)
Not mentioned Describing the behavior of the surface energy balance (SEB) and establishing a frequency distribution climatology of the sensible fraction (SF) index
Weather stations and remotely sensed data
SEB model
utility of remote sensing methods in urban ecological studies (Wilson et al., 2003),
most of the research in this category has employed satellite imagery data from
sour-ces such as LST map, QuickBird, IKONOS, and ASTER for convenient analysis of
the effect of green spaces over large expanses. Some of the studies to be discussed in
this section have also utilizedfield observations, temperature measurements, or
tem-perature sensors for better examination of cooling effect intensity (CEI) and cooling
effect distance (CED).
Thefirst article to be discussed in this category is a study conducted on 30 parks in
Beijing, where it was found that the size of the parks has an impact on cooling effect
creation. The parks investigated in this study had an average CED of between 85m
and 284m, and could reduce the average temperature by about 2.3e4.8C (Lin et al., 2015). A more recent study on 435 green spaces in another city in China (Fuzhou)
showed that CEI of a park is a function of not only its size, but also its shape and
quality. This study found that circular or rectangular compact green spaces play a
more significant role in cooling effect, and that the area of a green space and the
di-versity of its vegetation also directly affect the level of cooling. For example, they
reported that the CED of a space with an area of 2.3 ha and DLST of 0.93 C was 59.62m, but the CED of a space with an area of 35.78 ha andDLST of 4.43
C reached as high as 279.19 m. The green spaces examined in this study had an
average CEI of 1.78C and average CED of 104m (Yu et al., 2017). In a similar study, the impact of the geometric shape of 21 UGSs in Addis Ababa on the resulting
cooling effect was investigated. This study found a negative relationship between
CEI and Shape Index (SI), and a positive relationship between CED and SI, and
park size. Among the cases investigated in this study, the one with great cooling
impact had a CEI of 6.72C and a CED of 240m (Feyisa et al., 2014).
After studying 92 parks in Nagoya,Cao et al. (2010)found that PCI varies not only
with physical factors but also with the season. They reported that in spring, summer
and autumn, the largest park studied (41.9 hectares) had a peak CEI of 6.50 K, 6.82
K and 2.46K respectively, and the studied parks as a whole had an average CEI of
1.30 K, 1.16 K and 0.43K respectively. Ultimately, this study concluded that the
high-est cooling effect occurs in summer and autumn. However, a recent study conducted in
Aracaju reported that in both hot and cold seasons, CEI remains within the range of
1.5e2.0C, though the intensity of UHI varies with season (Anjos and Lopes, 2017). A recent analysis in 2017 of 68 green spaces found that in addition to areas and
com-plex shapes that play an important role in creating the cooling effect, another factor
termed water body, was also effective in CEI and CED indices. In this study, it was
also found that among the green space areas surveyed (1.12 hae205.32 ha), the area
of 1.12 ha had the lowest CED and CEI which were respectively 90m and 0.78C; however, the area of 129.46 ha had the highest CED and CEI which were 1610 m
and 9.35C, respectively (Du et al., 2017).
9 https://doi.org/10.1016/j.heliyon.2019.e01339
2405-8440/Ó2019 The Authors. Published by Elsevier Ltd. This is an open access article under the CC BY license (http://creativecommons.org/licenses/by/4.0/).
2.3. Cooling e
ff
ect of particular urban green spaces with known
speci
fi
cations
This section discusses the articles where the location and characteristics (size and
shape) of the studied UGSs are specifically mentioned. To enable more accurate
ex-amination of the cooling effect of green spaces, the articles in this category are
further divided into three subcategories based on the size and type of the case
stud-ied: (i) large-scale urban parks with areas of more than 20 ha, (ii) medium-sized
ur-ban parks with areas of between 0.1 and 12 hectares; and (iii) local and small parks
with areas of less than 0.1 hectares.
2.3.1. Large-sized urban parks
Research in this subcategory has studied large urban parks mostly located in city
centers (Table 2). The cooling effect of large urban parks has long been of paramount
interest to urban planners (Almendros Coca, 1992;Ca et al., 1998). Thanks to their
vast area and location in the heart of the city, these parks often have a significant
impact on the temperature of urban spaces (Jauregui, 1990). The cooling effect of
these parks is closely associated with their CED and CEI, which depends on several
factors, including park size and shape, type and amount of vegetation cover, and
regional climate.
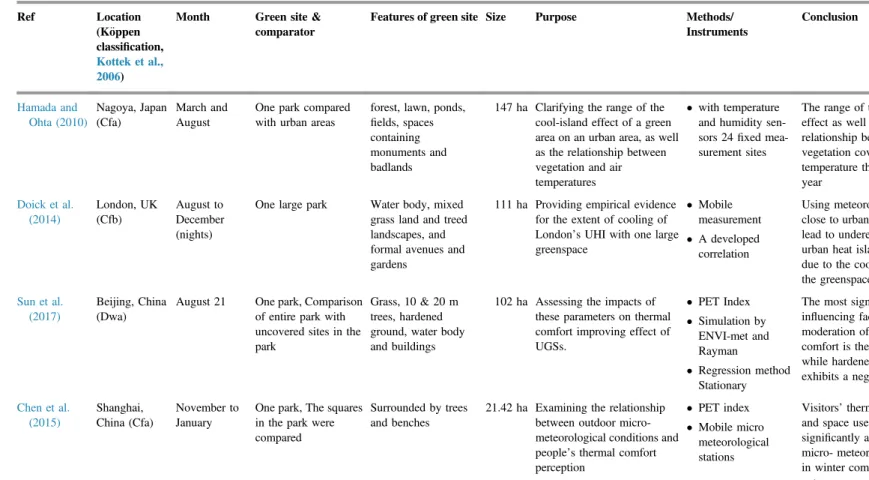
A study conducted byHamada and Ohta (2010)in Nagoya found that during
sum-mers, areas adjacent to Heiwa Park (147 ha) had up to 1.9C lower temperature than other areas. They reported that in summers, this park had a CED of 200e300 meters
during night hours and 300e500 meters during day hours. In another study (Doick
et al., 2014), the average night-time CED of Kensington Gardens (111 ha) in London
over the period between August and December (5 months) was found to vary
be-tween 20 and 440 meters. According to this study, this park reduces the summer
nighttime temperatures by an average of 1.1C and a maximum of 4C.
Besides CED and CEI, some studies of large parks have investigated the
Physiolog-ical Equivalent Temperature (PET), which is an indicator of human comfort under
temperature variations (Matzarakis et al., 1999;Matzarakis and Amelung, 2008),
to measure the cooling effect of green spaces. A study conducted in Shanghai, China,
showed that on a hot sunny day (August 21st, 2:00 pm), theYuan Dynasty Relics
Park(102 ha) decreased the PET by an average of 2C and a maximum of 15.6
C (Sun et al., 2017). Another study conducted in Shanghai (Chen et al., 2015)
re-ported that the cooling effect created byZhongshan Park(21.42 ha) located in the
city center resulted in a PET of 15e29 C during winter. In a similar study by
Mahmoud (2011), it was shown that during the hot months of summer, the cooling
effect ofCairo’s central Park(26.01 ha) results in a daytime PET of 22e30C and a nighttime PET of 21e29C.
10 https://doi.org/10.1016/j.heliyon.2019.e01339
2405-8440/Ó2019 The Authors. Published by Elsevier Ltd. This is an open access article under the CC BY license (http://creativecommons.org/licenses/by/4.0/).
Table 2.Summary of studies investigating the cooling effect of large-sized urban parks.
Ref Location (K€oppen classification, Kottek et al., 2006)
Month Green site & comparator
Features of green site Size Purpose Methods/ Instruments Conclusion Hamada and Ohta (2010) Nagoya, Japan (Cfa) March and August
One park compared with urban areas
forest, lawn, ponds,
fields, spaces containing monuments and badlands
147 ha Clarifying the range of the cool-island effect of a green area on an urban area, as well as the relationship between vegetation and air temperatures
with temperature and humidity sen-sors 24fixed mea-surement sites
The range of the cooling effect as well as the relationship between the vegetation cover and air temperature throughout the year
Doick et al. (2014) London, UK (Cfb) August to December (nights)
One large park Water body, mixed grass land and treed landscapes, and formal avenues and gardens
111 ha Providing empirical evidence for the extent of cooling of London’s UHI with one large greenspace
Mobile measurement
A developed correlation
Using meteorological stations close to urban greenspace can lead to underestimation of urban heat island intensity due to the cooling effect of the greenspace.
Sun et al. (2017)
Beijing, China (Dwa)
August 21 One park, Comparison of entire park with uncovered sites in the park
Grass, 10 & 20 m trees, hardened ground, water body and buildings
102 ha Assessing the impacts of these parameters on thermal comfort improving effect of UGSs. PET Index Simulation by ENVI-met and Rayman Regression method Stationary
The most significant influencing factor on the moderation of thermal comfort is the higher trees, while hardened ground exhibits a negative impact
Chen et al. (2015)
Shanghai, China (Cfa)
November to January
One park, The squares in the park were compared
Surrounded by trees and benches
21.42 ha Examining the relationship between outdoor micro-meteorological conditions and people’s thermal comfort perception
PET index
Mobile micro meteorological stations
Visitors’thermal sensations and space use were more significantly affected by the micro- meteorological factors in winter compared with autumn
(continued on next page)
Table 2.(Continued)
Ref Location (K€oppen classification, Kottek et al., 2006)
Month Green site & comparator
Features of green site Size Purpose Methods/ Instruments Conclusion Mahmoud (2011) Cairo, Egypt (Bwh) December and June
One big park near the city center (compact urban fabric of the old city core)
9 different zones: peak, spine, entrance, fountain, lake, canopy, pavement,
26.01 ha Assessing microclimatic and human comfort conditions in various zones within an urban park.
Field measurement campaign (thermal index PET and TSV)
RayMan
The results of this study contribute to the practice of providing appropriate thermal comfort in urban parks to attract visitors in summer and winter seasons.
Buyadi et al. (Nov 2013)
Shah-Alam, Malaysia (Af)
Not mentioned One big national park Forest reserved and protected
1,507 ha Investigating the effects of land use changes on the surface temperature of a big national park
GIS
Remote sensing images
The vegetation areas can provide positive impacts on regulating high temperatures in urban areas.
Yan et al. (2018)
Beijing, China (Dwa)
Summer month
One big Central park Park has hills, forest, lakes, wetland and other natural landscapes
680 ha Investigating the cooling effect of big park on thermal environment of surrounding urban area
Field measurement
Mobile micro meteorological stations
The cooling effect of the big park influences not only within the park but extends beyond the park’s border.
2.3.2. Medium-sized urban parks
The articles to be reviewed in this section (Table 3) can be divided into two groups:
works where only a single park has been studied, and works where several parks of
different sizes have been compared with each other. The articles belonging to the
second group have utilized different criteria for comparison, most notably the park
size, shape, location, and the type and quality of its vegetation cover (Bacci et al.,
2002;Spronken Smith and Oke, 1998).
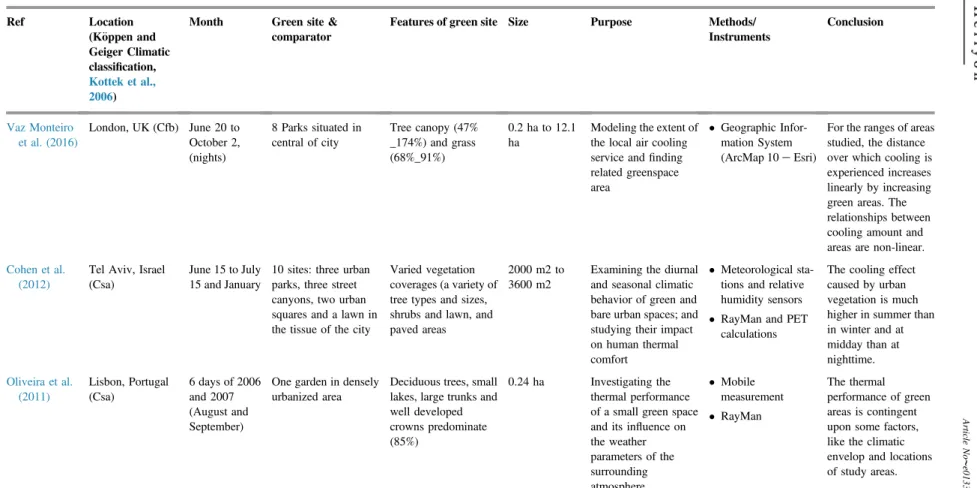
In a study conducted in London (Vaz Monteiro et al., 2016), eight city center parks
with areas ranging from 0.2 ha to 12.1 ha were studied to determine the impact of
park size on CEI and CED. In short, this study showed that green spaces with areas
of 0.5e2 ha can only cause up to 0.3C temperature reduction over 40m distance, but the temperature reduction caused by green spaces with areas of 3e5 ha can
extend over a 70e120 m distance and reach as low as 0.7C. It was also reported that larger green spaces with areas of up to 12.1 ha can decrease temperature by 1
C over 180e330 m distances. In a study conducted in Tel Aviv (Cohen et al.,
2012), the cooling effects of 10 urban parks with different sizes (0.2e0.36 ha)
and different vegetation quality and diversity were compared. This study found
that parks with dense vegetation cover have the greatest effectiveness in terms of
cooling and thermal comfort. The greatest cooling effect was observed in summer,
when the parks managed to reduce the temperature by up to 3.8C, resulting in a PET of 18C. In comparison, a smaller effect was observed in winter, when temper-ature reduction was 2C and the resulting PET was 10C.
Other studies on green spaces of medium-sized are focused on the cooling effect of a
single park. In these works, comparisons have been made either between differently
vegetated parts of a single park, or between the park as a whole and the surrounding
spaces. Research on a 0.24 ha urban park in Lisbon showed that during hot summer
days, the air within this park is up to 6.9C cooler than the surrounding area. This research highlighted other factors such as sunlight exposure, geometric shape, and
wind speed as determinants of cooling effect (Oliveira et al., 2011). A similar study
bySkoulika et al. (2014)on a 6 ha park in Athens reported that wind can have a
sig-nificant impact on the magnitude of cooling effect. The CEI of this park was found to
be between -0.7K and -8.8K during night hours, and between -0.2K and -2.6K
dur-ing day hours.
2.3.3. Small parks
Besides large and medium-sized parks, small parks can also play a role in creating
a cooling effect. Generally, studies on the cooling effect of UGSs are more focused
on large and medium-sized green spaces; however, among the articles in this area,
in a study, the role of small parks is also mentioned. According to this study
13 https://doi.org/10.1016/j.heliyon.2019.e01339
2405-8440/Ó2019 The Authors. Published by Elsevier Ltd. This is an open access article under the CC BY license (http://creativecommons.org/licenses/by/4.0/).
Table 3.Summary of studies investigating the cooling effect of medium-sized and small urban parks.
Ref Location (K€oppen and Geiger Climatic classification, Kottek et al., 2006)
Month Green site & comparator
Features of green site Size Purpose Methods/ Instruments
Conclusion
Vaz Monteiro et al. (2016)
London, UK (Cfb) June 20 to October 2, (nights)
8 Parks situated in central of city
Tree canopy (47% _174%) and grass (68%_91%)
0.2 ha to 12.1 ha
Modeling the extent of the local air cooling service andfinding related greenspace area
Geographic Infor-mation System (ArcMap 10eEsri)
For the ranges of areas studied, the distance over which cooling is experienced increases linearly by increasing green areas. The relationships between cooling amount and areas are non-linear.
Cohen et al. (2012)
Tel Aviv, Israel (Csa)
June 15 to July 15 and January
10 sites: three urban parks, three street canyons, two urban squares and a lawn in the tissue of the city
Varied vegetation coverages (a variety of tree types and sizes, shrubs and lawn, and paved areas
2000 m2 to 3600 m2
Examining the diurnal and seasonal climatic behavior of green and bare urban spaces; and studying their impact on human thermal comfort
Meteorological sta-tions and relative humidity sensors
RayMan and PET calculations
The cooling effect caused by urban vegetation is much higher in summer than in winter and at midday than at nighttime.
Oliveira et al. (2011)
Lisbon, Portugal (Csa)
6 days of 2006 and 2007 (August and September)
One garden in densely urbanized area
Deciduous trees, small lakes, large trunks and well developed crowns predominate (85%)
0.24 ha Investigating the thermal performance of a small green space and its influence on the weather parameters of the surrounding atmosphere Mobile measurement RayMan The thermal performance of green areas is contingent upon some factors, like the climatic envelop and locations of study areas.
(continued on next page)
Table 3.(Continued)
Ref Location (K€oppen and Geiger Climatic classification, Kottek et al., 2006)
Month Green site & comparator
Features of green site Size Purpose Methods/ Instruments
Conclusion
Skoulika et al. (2014)
Athens, Greece (Csa)
July 29 to September 2
One park surrounded by a very dense area with medium size residential and commercial buildings
Covered by grass, various types of bushes, low trees (olives, acacias, etc.), dense medium and high size trees
60,000 m2 Understanding and
analyzing the relative climatic conditions in the park compared to the reference urban areas, and evaluate its climatic contribution
Field measurement (The ninefixed temperature and humidity stations)
Mobile sensors
The park has an important mitigation impact on its surroundings (3.3 K). Increased wind speeds increase the mitigation potential beyond the park limit
Park et al. (2017)
Seoul, South Korea (Dwa)
Aug 9, 16, 27 and Sep 6, 7, 11
6 Small green space within urban blocks
Different shape types: polygonal, linear, single, and mixed.
300 m2to 650
m2
Understanding the cooling effect of SGs on urban block units based on their types (four types) and structures
Choose district by either local climate zone (LCZ) model
Air temperature logger (Testo 174H)
Small green areas can bring a positive benefit by increasing the cooling effects in urban blocks, and configuration of green space (polygonal and mixed types) plays a more important role.
conducted byPark et al. (2017)in Seoul, small green spaces with an area of 300
m2can result in 1C temperature reduction and slightly larger parks with an area of 650 m2can reduce the temperature by up to 2C. This study found that the CEI of a park correlates with its size, and accurately predicted that a 1500 m2green
space would reduce the temperature by up to 3.6 C. This study also showed that polygonal lands with combined vegetation cover can reduce the temperature
by up to 4C (Table 3).
2.4. Cooling e
ff
ect predicted in computer simulations
This section reviews the studies conducted more recently following the
populariza-tion of computer analysis, the use of ENVI-met and FLUENT software (CFD
model), in urban biochemical studies (Table 4). The articles covered in this section
have employed ENVI-met and CFD simulations to predict the cooling effect of green
spaces with different shapes, dimensions, and placements in different scenarios.
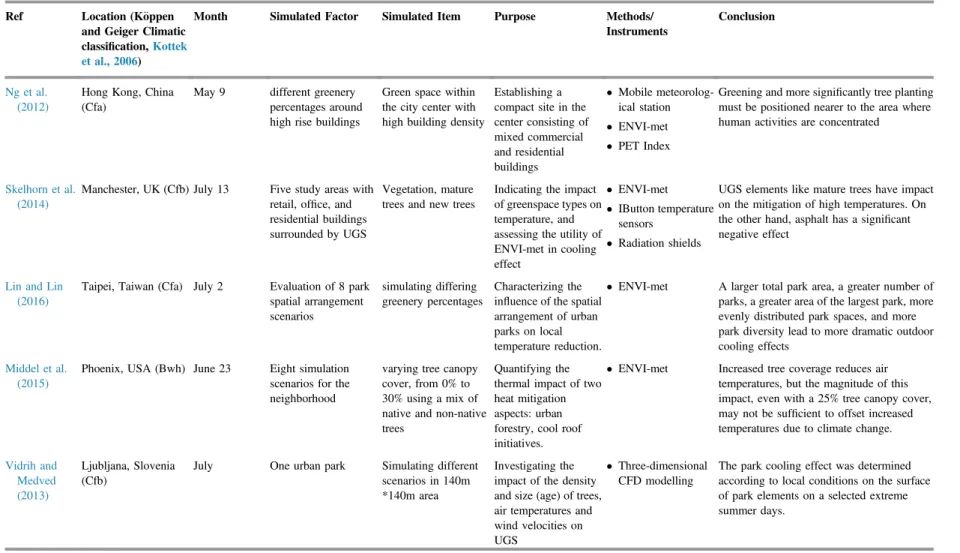
One of thefirst works in which the cooling effect of green spaces was analyzed with
ENVI-met was a study conducted in 2012, where the impact of replacing Hong
Kong sidewalk pavements with green materials was simulated in various climatic
scenarios. This study found that planting sidewalk trees in urban spaces result in a
better cooling effect than building green surfaces such as green roofs (Ng et al.,
2012). A similar study in Manchester also found that mature trees have a significant
impact on the pavement surface temperature. The simulation results of this study
showed that adding 5% mature tree density would reduce the surface temperature
by 1.0C, and even adding 5% density saplings would result in 0.5C temperature reduction in urban areas (Skelhorn et al., 2014).
In another recent study (Lin and Lin, 2016), ENVI-met software was used to
simulate eight scenarios regarding the placement of green spaces in Taipei City.
Of these eight scenarios, three were dedicated to the placement of 6 hectares of
green space, and the remainingfive assessed the placement of 36 hectares of green
space. In these simulations, the impact of park sizes and placement was studied.
Ultimately, the results showed that the larger the size of the UGS, the greater will
be the cooling effect. In this study, the best result in terms of cooling performance
was achieved by using a combination of smaller parks placed alongside a larger
green space.
Utilizing a three-dimensional CFD model in Ljubljana in Slovenia byVidrih and
Medved (2013), the study indicated that the summertime cooling effect of different
parts of a 1.96 ha park is depended on its leaf area index (LAI). They also reported
that in areas where LAIsp(planting density of 45 trees with an age of 50 years, per
hectare) is 3.16, CEI reaches -4.8C, but in the extremities of the park, where LAIsp
is 1.05, CEI reaches -1.2C.
16 https://doi.org/10.1016/j.heliyon.2019.e01339
2405-8440/Ó2019 The Authors. Published by Elsevier Ltd. This is an open access article under the CC BY license (http://creativecommons.org/licenses/by/4.0/).
Table 4.Summary of studies investigating the cooling effect predicted in computer simulations.
Ref Location (K€oppen and Geiger Climatic classification,Kottek et al., 2006)
Month Simulated Factor Simulated Item Purpose Methods/ Instruments
Conclusion
Ng et al. (2012)
Hong Kong, China (Cfa)
May 9 different greenery percentages around high rise buildings
Green space within the city center with high building density
Establishing a compact site in the center consisting of mixed commercial and residential buildings Mobile meteorolog-ical station ENVI-met PET Index
Greening and more significantly tree planting must be positioned nearer to the area where human activities are concentrated
Skelhorn et al. (2014)
Manchester, UK (Cfb) July 13 Five study areas with retail, office, and residential buildings surrounded by UGS
Vegetation, mature trees and new trees
Indicating the impact of greenspace types on temperature, and assessing the utility of ENVI-met in cooling effect
ENVI-met
IButton temperature sensors
Radiation shields
UGS elements like mature trees have impact on the mitigation of high temperatures. On the other hand, asphalt has a significant negative effect
Lin and Lin (2016)
Taipei, Taiwan (Cfa) July 2 Evaluation of 8 park spatial arrangement scenarios
simulating differing greenery percentages
Characterizing the influence of the spatial arrangement of urban parks on local temperature reduction.
ENVI-met A larger total park area, a greater number of parks, a greater area of the largest park, more evenly distributed park spaces, and more park diversity lead to more dramatic outdoor cooling effects
Middel et al. (2015)
Phoenix, USA (Bwh) June 23 Eight simulation scenarios for the neighborhood
varying tree canopy cover, from 0% to 30% using a mix of native and non-native trees
Quantifying the thermal impact of two heat mitigation aspects: urban forestry, cool roof initiatives.
ENVI-met Increased tree coverage reduces air temperatures, but the magnitude of this impact, even with a 25% tree canopy cover, may not be sufficient to offset increased temperatures due to climate change.
Vidrih and Medved (2013)
Ljubljana, Slovenia (Cfb)
July One urban park Simulating different scenarios in 140m *140m area
Investigating the impact of the density and size (age) of trees, air temperatures and wind velocities on UGS
Three-dimensional CFD modelling
2.5. Summary and discussion
The present paper reviewed the recent articles related to the impact of UGS on the
creation of cooling effect, reduction of UHI, and provision of thermal comfort in
ur-ban environments. In the past ten years, the growing attention to the importance of
green spaces, and especially parks, in the creation of cooling effect has led to the
publication of many research works with different methodologies and at different
scales in relation to this subject. Given the high number and variety of articles
pub-lished on this subject, we categorized the works based on methodology and scale of
research. Although the literature contains a number of review studies on the subject
of urban parks and green spaces (Bowler et al., 2010;Jamei et al., 2016;Taleghani,
2018;Bartesaghi Koc et al., 2018), they have taken a comprehensive perspective and
investigated the articles on the entirety of green infrastructure. Hence, in these
studies, the research on urban parks and green spaces has been reviewed as a part
of an extensively broader literature and there is no detailed categorization in regard
to the methods and findings of the studies specifically focused on this subject.
Considering this gap in the literature and the importance of UGS cooling effect
for urban planning, we attempted to address the lack of a review study in literature
in regard to UGSs and their impact on cooling effect.
In thefirst section of this paper, we reviewed the articles on the combined impact of a
group of UGSs on a part or the entire area of a city. The studies covered in this
sec-tion were mostly based on remote sensing methods, with the excepsec-tion of a few
works that utilizedfield observations as well.
The next section of this study was dedicated to the articles where the location, size,
and shape of the studied UGSs are specifically mentioned. These articles are mainly
based on the studies of one or several specific parks, usingfield data collected from
temperature sensors installed in and around the case, and/or by collecting PET data
from residents to estimate the cooling effect. Some of these studies have also
em-ployed ENVI-met software, satellite imagery and remote sensing data for deeper
analysis. For better categorization, these articles were divided into three
subcate-gories based on the size of the studied case. A summary of results reported by these
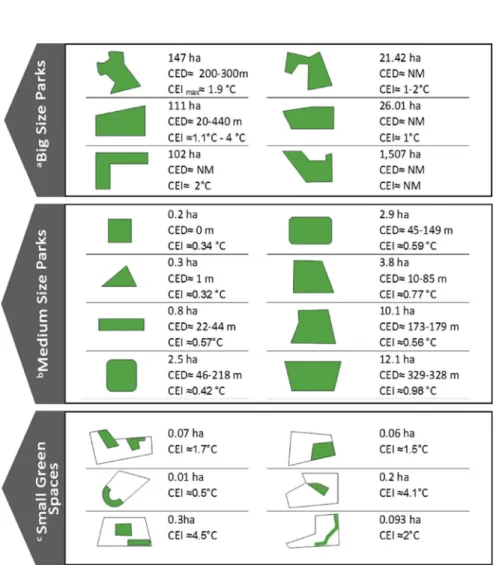
articles is presented inTable 5andFig. 1.
The last category of articles included the studies that have heavily utilized computer
simulation. While being a relatively new method in this line of research, computer
simulation has greatly facilitated the qualitative analyses that put more emphasis
on the effect of vegetation type and quality and the placement of green spaces, rather
than CED and CEI measurements. Although simulation is a convenient and quick
method of analysis, it is not as accurate and reliable as the study of aerial maps
andfield observations, and is only suitable for developing initial hypotheses and
as-sumptions and studying how the change of scenarios and variables affect the
18 https://doi.org/10.1016/j.heliyon.2019.e01339
2405-8440/Ó2019 The Authors. Published by Elsevier Ltd. This is an open access article under the CC BY license (http://creativecommons.org/licenses/by/4.0/).
Fig. 1.(a) 6 parks were investigated at this scale. (b) 21 parks were investigated at this scale. But, the information ofVaz Monteiro et al. (2016)study having both CEI and CED is illustrated. (C) 6 parks were investigated at this scale.
Table 5.Summary of studies investigating the cooling effect of particular UGSs
with known specifications.
Size General features
Big Size Parks Mature and tall trees with high percent of
canopy
Water body
Different zones and landscapes with various vegetation types
Medium Size Parks Different size of trees (medium and high)
various vegetation types
small water body
Small Green Spaces Low tree diversity
Low vegetation diversity
Has an enclosure space
19 https://doi.org/10.1016/j.heliyon.2019.e01339
2405-8440/Ó2019 The Authors. Published by Elsevier Ltd. This is an open access article under the CC BY license (http://creativecommons.org/licenses/by/4.0/).
responses. As a result, the articles included in this section lack specific CED and CEI
measurements. Overall, it can be concluded that each of the above methods has a set
of unique features, which make it preferable for research at certain scales or with
certain purposes.
Although the impact of UGS cooling effect has been researched at different scales
and for different climates, the number and geographical distribution of studies in
thisfield do not match the importance of the subject. The majority of past studies
on this subject have been carried out in Eastern Asia, and their results cannot be
generalized to other regions. Also, the majority of these studies are focused either
on large and central parks or medium-sized parks, and have largely overlooked
the smaller and local green spaces. Although it is known that larger parks have
greater cooling effect, the only study that has investigated the effect of small parks
(Park et al., 2017) has demonstrated the noticeable cooling effect of small parks
on their surroundings, which indicates the necessity of further research into this
matter.
It is also notable that the reviewed articles have overlooked some aspects of the
subject in favor of a focus on the size of green spaces. While, some of these works
have studied factors such as shape index (SI) (Feyisa et al., 2014), leaf area index
(LAI) (Vidrih and Medved, 2013), wind speed (Skoulika et al., 2014),DLST of
surfaces (Yu et al., 2017), seasonal changes (Anjos and Lopes, 2017), vegetation
type (Cohen et al., 2012;Skelhorn et al., 2014;Middel et al., 2015), and sunlight
exposure (Oliveira et al., 2011), none of them have examined the collective effect
of that may influence the CED and CEI of a green space. In addition, most of
these studies have ignored the role of natural and artificial objects and elements
typically found within parks, such as waterbodies and urban furniture. A study
on urban design and planning solutions to reduce the effects of urban heating
was carried out by Kleerekoper et al. (2012) in the Netherlands, emphasizing
on the use of various solutions, such as green space and waterbodies alongside
each other. Furthermore, the other recent article that has considered the effect
of the different qualitative and quantitative green space elements is the study of
Xu et al. (2017), and there is still a huge gap in the research literature in regard
to this issue.
Furthermore, only a few studies have considered the actual size of the vegetated area
within green spaces. In other words, most studies, and especially those that have
em-ployed remote sensing methods, have assumed the entire area of green space
(including sidewalks and buildings) as vegetated surface; a simplifying assumption
that can undermine the accuracy of research. Another problem observed in the
re-viewed articles is the size mismatch between the studied cases, which may
under-mine the quality of comparisons, and thus the research power to discover the
factors influencing the temperature reduction. In view of the above issues, it is
20 https://doi.org/10.1016/j.heliyon.2019.e01339
2405-8440/Ó2019 The Authors. Published by Elsevier Ltd. This is an open access article under the CC BY license (http://creativecommons.org/licenses/by/4.0/).
imperative for future research to pay further attention to the specifications of the
cases to be studied and to the selection of proper methodology according to research
objectives and scale.
3. Conclusion
With steadily growing impacts of global warming, cities are increasingly struggling
with new problems such as intensified UHI effect. Further academic attention to the
impact of UGS on UHIs can provide city planners with viable strategies to address
this issue. In this paper, we reviewed and categorized recent articles in thisfield of
study. In summary, all of the reviewed articles agreed on the fact that UGSs,
including parks, play a key role in reducing UHI, creating cooling, and providing
thermal comfort for citizens.
In the reviewed articles, the impact of green spaces and their specifications were
investigated through different approaches including the use of field observation
and temperature sensors for accurate CEI and CED measurement and the use of
sat-ellite maps and remote sensing methods to investigate the collective impact of a
group of UGSs on large expanses of a city. A good agreement was observed between
the results derived from satellite imagery data and those obtained fromfield studies.
From the results reported by these groups of research, it can be concluded that large
parks with areas of more than 10ha have the highest average CED and CEI; that is, a
1e2 C temperature reduction that extends over a 350m distance from the park boundary.
A relatively new method in thisfield of research is computer simulation, which
al-lows research and analysis variables to be adjusted as desired. Given the unique
merits and characteristics of the above methods and the success of previous attempts
to combinefield examinations with simulation or with remote sensing data,
consid-eration of all these methods in line with research objectives and specifications can
facilitate future research into cooling effect.
Since the majority of studies on cooling effect of UGS have been published in the
last ten years, and this subject can be considered a relatively new branch of urban
sustainability research, future studies are expected to cover broader geographic
and climatic spectra and to focus their comparisons on carefully selected cases
with similar characteristics such as size and shape. Future studies are also
recom-mended to develop and test new advanced methods for this particular line of
research and also incorporate the natural and artificial features commonly found
in urban spaces into their analyses, in order to identify and evaluate the impact
of all variables of UGS that play a role in temperature reduction through cooling
effect.
21 https://doi.org/10.1016/j.heliyon.2019.e01339
2405-8440/Ó2019 The Authors. Published by Elsevier Ltd. This is an open access article under the CC BY license (http://creativecommons.org/licenses/by/4.0/).
Declarations
Author contribution statement
All authors listed have significantly contributed to the development and the writing
of this article.
Funding statement
This research did not receive any specific grant from funding agencies in the public,
commercial, or not-for-profit sectors.
Competing interest statement
The authors declare no conflict of interest.
Additional information
No additional information is available for this paper
References
Aflaki, Ardalan, Mirnezhad, Mahsan, Ghaffarianhoseini, Amirhosein,
Ali, Ghaffarianhoseini, Omrany, Hossein, Wang, Zhi Hua, Akbari, Hashem,
2017. Urban heat island mitigation strategies: a state-of-the-art review on Kuala
Lumpur, Singapore and Hong Kong. Cities 62 (February), 131e145. Elsevier Ltd.
Akbari, Hashem, Dionysia, Kolokotsa, 2016. Three decades of urban heat islands
and mitigation technologies research. Energy Build. 133 (December), 834e852.
Elsevier Ltd.
Alcazar, Saiz, Susana, Olivieri, Francesca, Neila, Javier, 2016. Green roofs:
exper-imental and analytical study of its potential for urban microclimate regulation in
mediterraneanecontinental climates. Urban Climate 17 (September), 304e317.
Elsevier B.V.
Almendros Coca, M.A., 1992. Aspectos climaticos del parque del Retiro, Madrid
(Cli- mate features of Retiro Park, Madrid). Estud. Geograficos 53, 217e239 [in
Spanish: English abstract].
Anjos, Max, Lopes, Antonio, 2017. Urban heat island and park Cool island
inten-sities in the coastal city of Aracaju, north-eastern Brazil. Sustainability
(Switzerland) 9 (8), 1379.. MDPI AG.
22 https://doi.org/10.1016/j.heliyon.2019.e01339
2405-8440/Ó2019 The Authors. Published by Elsevier Ltd. This is an open access article under the CC BY license (http://creativecommons.org/licenses/by/4.0/).
Aram, Farshid, Solgi, Ebrahim, Holden, Gordon, 2019. The role of green spaces in
increasing social interactions in neighborhoods with periodic markets. Habitat Int.
84 (February), 24e32. Elsevier Ltd.
Azevedo, Isabel, Leal, Vítor M.S., 2017. Methodologies for the evaluation of local
climate change mitigation actions: a review. Renew. Sustain. Energy Rev. Elsevier
Ltd.
Bacci, Laura, Morabito, Marco, Raschi, Antonio, Ugolini, Francesca, 2002.
Ther-mohygrometric Conditions of Some Urban Parks of Florence ( Italy ) and Their
Ef-fects on Human Well-Being. Iraq, no. April 2016: 2e5. Export Date 19 June 2013.
Bartesaghi Koc, Carlos, Osmond, Paul, Peters, Alan, 2018. Evaluating the cooling
effects of green infrastructure: a systematic review of methods, indicators and data
sources. Sol. Energy. Elsevier Ltd.
Battista, Gabriele, Carnielo, Emiliano, De Lieto Vollaro, Roberto, 2016. Thermal
impact of a redeveloped area on Localized urban microclimate: a case study in
rome. Energy Build. 133 (December), 446e454. Elsevier Ltd.
Besir, Ahmet B., Cuce, Erdem, 2018. Green roofs and facades: a comprehensive
review. Renew. Sustain. Energy Rev. Elsevier Ltd.
Bowler, Diana E., Buyung-Ali, Lisette, Knight, Teri M., Pullin, Andrew S., 2010.
Urban greening to Cool towns and cities: a systematic review of the empirical
ev-idence. Landsc. Urban Plann.
Brandt, Leslie, Derby Lewis, Abigail, Fahey, Robert, Scott, Lydia,
Darling, Lindsay, Chris Swanston, 2016. A framework for adapting urban forests
to climate change. Environ. Sci. Policy 66 (December), 393e402. Elsevier Ltd.
Brown, Robert D., Vanos, Jennifer, Kenny, Natasha, Lenzholzer, Sanda, 2015.
Designing urban parks that ameliorate the effects of climate change. Landsc. Urban
Plann. 138 (June), 118e131. Elsevier.
Buyadi, Siti Nor Afzan, Wan Mohd Naim Wan Mohd, Misni, Alamah, 2015.“
Veg-etation’s role on modifying microclimate of urban resident. Proc. Soc. Behav. Sci.
202 (August), 400e407.
Buyadi, Siti Nor Afzan, Wan Mohd Naim Wan Mohd, Misni, Alamah, 2013. Green
spaces growth impact on the urban microclimate. Proc. Soc. Behav. Sci. 105
(December), 547e557.
Buyadi, Siti Nor Afzan, Wan Mohd Naim Wan Mohd, Misni, Alamah, 2013.
Impact of land use changes on the surface temperature distribution of area
surround-ing the national botanic garden, shah alam. Proc. Soc. Behav. Sci. 101 (November),
516e525.
23 https://doi.org/10.1016/j.heliyon.2019.e01339
2405-8440/Ó2019 The Authors. Published by Elsevier Ltd. This is an open access article under the CC BY license (http://creativecommons.org/licenses/by/4.0/).
Ca, Vu Thanh, Asaeda, Takashi, Mohamad Abu, Eusuf, 1998. Reductions in air
conditioning energy caused by a nearby park. Energy Build. 29 (1), 83e92.
Cao, Xin, Onishi, Akio, Chen, Jin, Imura, Hidefumi, 2010. Quantifying the Cool
island intensity of urban parks using ASTER and IKONOS data. Landsc. Urban
Plann. 96 (4), 224e231.
Chang, Chi Ru, Li, Ming Huang, 2014. Effects of urban parks on the local urban
thermal environment. Urban For. Urban Green. 13 (4), 672e681. Elsevier GmbH.
Chen, Ailian, Yao, X. Angela, Sun, Ranhao, Chen, Liding, 2014. Effect of urban
green patterns on surface urban Cool islands and its seasonal variations. Urban
For. Urban Green. 13 (4), 646e654. Elsevier GmbH.
Chen, Liang, Wen, Yongyi, Zhang, Lang, Xiang, Wei Ning, 2015. Studies of
ther-mal comfort and space use in an urban park square in Cool and cold seasons in
Shanghai. Build. Environ. 94 (December), 644e653. Elsevier Ltd.
Chow, Winston T.L., Brazel, Anthony J., 2012. Assessing xeriscaping as a
sustain-able heat island mitigation approach for a desert city. Build. Environ. 47 (1),
170e181.
Cohen, Pninit, Potchter, Oded, Matzarakis, Andreas, 2012. Daily and seasonal
cli-matic conditions of green urban open spaces in the mediterranean climate and their
impact on human comfort. Build. Environ. 51 (May), 285e295.
Daniel, M., Lemonsu, A., Viguie, V., 2018. Role of watering practices in
large-scale urban planning strategies to face the heat-wave risk in future climate. Urban
Climate 23 (March), 287e308. Elsevier B.V.
Demuzere, M., Orru, K., Heidrich, O., Olazabal, E., Geneletti, D., Orru, H.,
Bhave, A.G., Mittal, N., Feliu, E., Faehnle, M., 2014. Mitigating and adapting to
climate change: multi-functional and multi-scale Assessment of green urban
infra-structure. J. Environ. Manag. 146 (December), 107e115. Academic Press.
Dimoudi, A., Kantzioura, A., Zoras, S., Pallas, C., Kosmopoulos, P., 2013.
Inves-tigation of urban microclimate parameters in an urban center. Energy Build. 64,
1e9.
Doick, Kieron J., Peace, Andrew, Hutchings, Tony R., 2014.“The role of one large
greenspace in mitigating London’s nocturnal urban heat island. Sci. Total Environ.
493 (September), 662e671. Elsevier.
Du, Hongyu, Cai, Wenbo, Xu, Yanqing, Wang, Zhibao, Wang, Yuanyuan,
Cai, Yongli, 2017. Quantifying the Cool island effects of urban green spaces using
remote sensing data. Urban For. Urban Green. 27 (October), 24e31.
24 https://doi.org/10.1016/j.heliyon.2019.e01339
2405-8440/Ó2019 The Authors. Published by Elsevier Ltd. This is an open access article under the CC BY license (http://creativecommons.org/licenses/by/4.0/).
Ebi, Kristie L., Paulson, Jerome A., 2007. Climate Change and Children. Pediatr.
Clin.
EPA (United States Environmental Protection Agency), 2008. Reducing Urban
Heat Islands: Compendium of Strategies. Available at: http://www.epa.gov/
heatisland/resources/compendium.htm.
Farhadi, Hamed, Faizi, Mohsen, Sanaieian, Hanyieh, 2019. Mitigating the urban
heat island in a residential area in tehran: investigating the role of vegetation,
ma-terials, and orientation of buildings. Sustain. Cities Soc., 101448. January. Elsevier
BV.
Feyisa, Legese, Gudina, Dons, Klaus, Meilby, Henrik, 2014. Efficiency of parks in
mitigating urban heat island effect: an example from Addis Ababa. Landsc. Urban
Plann. 123 (March), 87e95.
Gago, E.J., Roldan, J., Pacheco-Torres, R., Ordo~nez, J., 2013. The city and urban
heat islands: a review of strategies to mitigate adverse effects. Renew. Sustain.
En-ergy Rev. 25, 749e758.
Giridharan, Renganathan, Emmanuel, Rohinton, 2018. The impact of urban
compactness, comfort strategies and energy consumption on tropical urban heat
is-land intensity: a review. Sustainable Cities and Society. Elsevier Ltd.
Givoni, B., 1991. Impact of planted areas on urban environmental quality: a review.
Atmos. Environ. Part B Urban Atmos. 25 (3), 289e299.
Gunawardena, K.R., Wells, M.J., Kershaw, T., 2017. Utilising green and bluespace
to mitigate urban heat island intensity. Sci. Total Environ. 584e585 (April),
1040e1055. Elsevier B.V.
Hamada, Shuko, Ohta, Takeshi, 2010. Seasonal variations in the cooling effect of
urban green areas on surrounding urban areas. Urban For. Urban Green. 9 (1),
15e24.
Heltberg, Rasmus, Siegel, Paul Bennett, Jorgensen, Steen Lau, 2008.“Addressing
human vulnerability to climate change: toward a‘No regrets’approach. Glob.
En-viron. Chang. 19 (1), 89e99.
Huang, Yu Joe, Davis, Susan, Akbari, Hashem, 1990. A guidebook for the control
of summer heat islands. In: ACEEE Summer Study on Energy Efficiency in
Build-ings 1990, pp. 79e85. LBL-29224.
IPCC, 2017. Meeting report of the intergovernmental panel on climate change
expert meeting on mitigation, sustainability and climate stabilization scenarios
[shu-kla, P.R. J. Skea, R. van Diemen, K. Calvin, Ø. Christophersen, F. Creutzig, J.
Fu-glestvedt, E. Huntley, F. Lecocq, M. Pathak, J. Portugal-pereira, J. Rogelj, J. Roy, J.
25 https://doi.org/10.1016/j.heliyon.2019.e01339
2405-8440/Ó2019 The Authors. Published by Elsevier Ltd. This is an open access article under the CC BY license (http://creativecommons.org/licenses/by/4.0/).
Scull, R. Schaeffer, R. Slade, D.Urge-vorsatz, D. van Vuuren.]. In: IPCC Working€
Group III Technical Support Unit. Imperial College London, London, the United
Kingdom.
Jamei, Elmira, Rajagopalan, Priyadarsini, Seyedmahmoudian, Mohammadmehdi,
Jamei, Yashar, 2016. Review on the impact of urban geometry and pedestrian level
greening on outdoor thermal comfort. Renew. Sustain. Energy Rev. 54 (February),
1002e1017. Elsevier Ltd.
Jauregui, E., 1990. Influence of a large urban park on temperature and convective
precipitation in a tropical city. Energy Build. 15 (3e4), 457e463.
Kaloustian, Noushig, Diab, Youssef, 2015. Effects of urbanization on the urban
heat island in beirut. Urban Climate 14 (December), 154e165. Elsevier B.V.
Competitive cities and climate change. In: Kamal-Chaoui, Lamia, Robert, Alexis
(Eds.), 2009. OECD Regional Development Working Papers N2. OECD
publish-ing,ÓOECD, p. 2009.
Khanian, Mojtaba, Marshall, Nadine, Zakerhaghighi, Kianoosh, Salimi, Marziyeh,
Naghdi, Asadollah, 2018. Transforming agriculture to climate change in famenin
county, west Iran through a focus on environmental, economic and social factors.
Weather Clim. Extremes 21 (September), 52e64. Elsevier B.V.
Kleerekoper, Laura, Van Esch, Marjolein, Baldiri Salcedo, Tadeo, 2012. How to
make a city climate-proof, addressing the urban heat island effect. Resour. Conserv.
Recycl. 64, 30e38. Elsevier B.V.
Klemm, Wiebke, Heusinkveld, Bert G., Lenzholzer, Sanda, Bert van Hove, 2015.
Street greenery and its physical and psychological impact on thermal comfort.
Landsc. Urban Plann. 138 (June), 87e98. Elsevier.
Kolokotroni, M., Giannitsaris, I., Watkins, R., 2006. The effect of the London urban
heat island on building summer cooling demand and night ventilation strategies.
Sol. Energy 80 (4), 383e392.
Kolokotroni, Maria, Davies, Michael, Ben, Croxford, Bhuiyan, Saiful,
Anna, Mavrogianni, 2010. A validated methodology for the prediction of heating
and cooling energy demand for buildings within the urban heat island: case-study
of London. Sol. Energy 84 (12), 2246e2255.
Kong, Fanhua, Yin, Haiwei, James, Philip, Hutyra, Lucy R., Hong, S. He, 2014.
Effects of spatial pattern of greenspace on urban cooling in a large metropolitan
area of eastern China. Landsc. Urban Plann. 128, 35e47. Elsevier.
26 https://doi.org/10.1016/j.heliyon.2019.e01339
2405-8440/Ó2019 The Authors. Published by Elsevier Ltd. This is an open access article under the CC BY license (http://creativecommons.org/licenses/by/4.0/).
Kottek, Markus, Grieser, Jurgen, Beck, Christoph, Rudolf, Bruno, Rubel, Franz,
2006. World map of the Koppen-geiger climate classification updated. Meteorol.
Z. E. Schweizerbartische Verlagsbuchhandlung 15 (3), 259e263.
Lai, Dayi, Liu, Wenyu, Gan, Tingting, Liu, Kuixing, Chen, Qingyan, 2019. A
re-view of mitigating strategies to improve the thermal environment and thermal
com-fort in urban outdoor spaces. Sci. Total Environ. Elsevier B.V.
Li, H., Harvey, J., Kendall, A., 2013a. Field measurement of albedo for different
land cover materials and effects on thermal performance. Build. Environ. 59
(January), 536e546.
Li, Xiaoma, Zhou, Weiqi, Ouyang, Zhiyun, 2013b. Relationship between land
sur-face temperature and spatial pattern of greenspace: what are the effects of spatial
resolution? Landsc. Urban Plann. 114 (June), 1e8.
Lin, Bau-Show, Lin, Ciao-Ting, 2016. Preliminary study of the influence of the
spatial arrangement of urban parks on local temperature reduction. Urban For.
Ur-ban Green. 20 (December), 348e357.
Lin, Wenqi, Ting, Yu, Chang, Xiangqi, Wu, Weijia, Zhang, Yue, 2015. Calculating
cooling extents of green parks using remote sensing: method and test. Landsc.
Ur-ban Plann. 134 (February), 66e75. Elsevier.
Lobaccaro, Gabriele, Acero, Juan A., 2015. Comparative analysis of green actions
to improve outdoor thermal comfort inside typical urban street canyons. Urban
Climate 14 (December), 251e267. Elsevier.
Mackey, Christopher W., Lee, Xuhui, Smith, Ronald B., 2012. Remotely sensing
the cooling effects of city scale efforts to reduce urban heat island. Build. Environ.
49 (1), 348e358.
Mahmoud, Ayman Hassaan Ahmed, 2011. Analysis of the microclimatic and
hu-man comfort conditions in an urban park in hot and arid regions. Build. Environ.
46 (12), 2641e2656.
Manso, Maria, Castro-Gomes, Jo~ao, 2015. Green wall systems: a review of their
characteristics. Renew. Sustain. Energy Rev. Elsevier Ltd.
Mariani, L., Parisi, S.G., Cola, G., Lafortezza, R., Colangelo, G., Sanesi, G., 2016.
Climatological analysis of the mitigating effect of vegetation on the urban heat island
of milan, Italy. Sci. Total Environ. 569e570 (November), 762e773. Elsevier B.V.
Martins, Tathiane A.L., Adolphe, Luc, Bonhomme, Marion, Bonneaud, Frederic,
Faraut, Serge, Ginestet, Stephane, Michel, Charlotte, Guyard, William, 2016.
Impact of urban Cool island measures on outdoor climate and pedestrian comfort:
27 https://doi.org/10.1016/j.heliyon.2019.e01339
2405-8440/Ó2019 The Authors. Published by Elsevier Ltd. This is an open access article under the CC BY license (http://creativecommons.org/licenses/by/4.0/).