Determination of Pressure Effects on the a -» y
Phase Transition and Size of Fe in Nd-Fe-B Spring
Exchange Magnets
MANUEL ABUIN, ZAFER TURGUT, NATAN ARONHIME, VLADIMIR KEYLIN, ALEX LEARY, VINCENT DEGEORGE, JOHN HORWATH, S. LEE SEMIATIN, DAVID E. LAUGHLIN, and MICHAEL E. MCHENRY
Pressure effects in RE-lean Nd2Fe14B-based nanocomposite systems developed from
nanocrys-talline precursors are studied in this work. In particular, the pressure dependence of the a —> y phase transformation in the Fe phase is examined along with the suppression of coarsening (growth) in both phases at higher pressures. By synchrotron X-ray diffraction we determined that the a —> y-phase transformations occur at temperatures of 1120 K (847 °C) at 1 GPa and 960 K (687 °C) at 5 GPa. A composition rich in Fe appears to have an -373 K (100 °C) range of temperature over which the a, y-phases coexist for atmospheric pressure. We compare our experimental data with other reported observations for Fe and with equations of state (EOS) determined from first principle calculations. From this study we observe an important feature: the phase transition begins at a higher temperature in flake samples than in powder samples. We consider the magnetic contribution to the heat capacity in the EOS for Fe and describe the implications of dipole moments on the slope of the Clapeyron equation for the P-T phase diagram in Fe. Additionally, the phase transition occurs at temperatures where growth by diffusional coarsening is also operative. This is significant since the size of soft Fe nanostructures is important to spring exchange. Suppression of the phase transition and Fe coarsening at higher pressures suggest that there may be interesting mechanical processing routes to be investigated to optimize spring exchange effects in Nd-Fe-B permanent magnets.
DOI: 10.1007/sll661-015-3120-0
© The Minerals, Metals & Materials Society and ASM International 2015
I. INTRODUCTION
RARE-EARTH transition metal (RT) alloys are important rare-earth permanent magnet (REPM)
materials. Magnetic properties in RT alloys depend on the T to R ratio. A low-symmetry crystal structure is necessary for permanent magnetic properties because they can result in large uniaxial magnetocrystalline anisotropy that impacts their coercivity, Hc. The
mag-netocrystalline anisotropy is understood with respect to crystal structure. In RT systems, R atoms typically contribute largely to the magnetic anisotropy, while the
T atoms contribute to the dipole moment and the Curie
temperature, Tc. Low symmetry T-rich compounds are
currently state of the art materials. However, issues of rare earth criticality have led to efforts to produce rare-earth lean permanent magnets and microstructures that result in larger stored magnetic energies in smaller sizes.
The Nd2Fe14B (2:14:1) phase is the most important
tetragonal permanent magnet material because of its large magnetocrystalline anisotropy and magnetic induction. ,2] Nd2Fe14B has a tetragonal structure with
a P42/mnm space group. Properties of the 2:14:1 phase
were reviewed by Herbst.[3] The suggestion of
nanocom-posite spring exchange m a g n e t ?] combining large
coercivities in hard magnets with large inductions of transition metal magnets motivated efforts to control microstructures in multi-phase magnetic systems. Early attempts to develop 2:14:1-based nanocomposites[5] used
-30 nm Nd2Fei4B nanoparticles surrounded by
mag-netic a-Fe and amorphous phases that act as an exchange-coupled medium.[32, 3] In general, REPMs
containing two or more phases, where the majority phase is nanocrystalline (taking advantage of the favor-able high coercivity in particles of optimum size) and one or more phases to pin magnetic domain walls. Chemical and structural variations on a nanoscale are important to determine optimum magnetic properties. The optimal particle size is in the nm size range, and depends on intrinsic properties of the soft material and anisotropy of the hard material.
A means of changing multi-phase nanostructures is through transformations under pressure. Pressure/61
fields, and nanocrystallization from amorphous pre-cursors[8] can both shift the equilibrium phase
bound-aries and change the barriers to nucleation and growth in magnetic systems. Here, we investigate pressure effects in RE-lean 2:14:1-based nanocomposite sys-tems^1 developed from nanocrystalline precursors
where the Nd2Fe14B, a-Fe and amorphous phases have
been identified as important in the nanocomposites, but details of the nanocrystallization process will depend on composition and thermodynamic field variables. In these systems the a-Fe phase mediates the spin exchange and also goes through a structural x —> y phase transformation taking the ferromagnetic (FM) BCC allotrope into a paramagnetic (PM) FCC allotrope of iron.
Here, we examine the pressure dependence of the x —> y phase transformation in the Fe phase in these nanostructures and the diffusional coarsening of the Fe phases with temperature. We compare the pressure dependence with other reported observations for Fe and with equations of state (EOS) and consider the suppres-sion of diffusuppres-sional coarsening of the Fe nanostructures with Pressure. We provide an analysis of the magnetic contributions to the free energy of the a —> y phases and the Clapeyron equation describing the phase boundary between a —> y Fe. Suppression of the phase transition and Fe coarsening at higher pressures suggest that there may be interesting mechanical processing routes to be investigated to optimize spring exchange effects in Nd-Fe-B permanent magnets.
II. EXPERIMENTAL PROCEDURES
Alloys of compositions Fe87.4Ndg.2B44 (NB1) and
Feg9.iNd5.9B50 (NB3) were produced as 10 g ingots using a Lab Arc Melter MAM-1 (Edmund Biihler, Germany) from ready Fe77Nd15Bg alloy, pure Iron, and
crystalline Boron (all from Alfa Aesar). The ingots were remelted 5 times to get uniform composition. These alloys were chosen to be close to the 4 pet B isopleth in a recently published Fe-Nd-B phase diagram.™1 These
compositions are to the left (NB1) and right (NB3), respectively, of the Tl (Fe14Nd2B) line compound in (Fe
+ Tl + Fe17Nd2) and (Fe + TI +T2) phase fields,
respectively, for which both are reported to have the same atmospheric pressure a —> y phase transition temperature of -1183 K (910 °C). These alloy
compositions were cast into flakes by a planar flow casting (PFC) technique using a Lab Spin Caster SC (Edmund Biihler, Germany) in low pressure argon atmosphere (300 mbar abs.), at copper wheel circum-ferential speed 44 m/s, and cast temperature of 1873 K (1600 °C.)
Note that the compositions to the left of the Tl line compound in the (Fe + Tl + Fe17Nd2) phase field,[9]
the Fe phase is expected to be nominally pure and the other two phases are line compounds. In equilibrium, the chosen composition fixes the relative volume frac-tion of the three phases. On the other hand, for compositions to the right of the Tl line compound in the (Fe + Tl + T2) phase field,[9] the T2 phase has a
modulated structure^101 with the modulation period
offering an additional compositional degree of freedom. In both compositions the path to equilibrium involves diffusion of Fe from the metastable amorphous phase.
The as-cast materials were observed to be mostly amorphous with some nanocrystalline a-Fe. The sam-ples were in the form of several centimeters long discontinuous ribbons and first run through a micro-hammer mill below 32 mesh. A portion of the obtained flakes were vacuum milled to further amor-phize the materials using a SPEX 8000 high-energy ball mill for 4 hours and a ball to powder ratio of 5:1.
Samples were thoroughly characterized at atmo-spheric pressure. Temperature-dependent magnetic properties were characterized using a Lakeshore 7407 vibrating-sample magnetometer with a 1273 K (1000 °C) oven assembly. Structural phase transitions, including crystallization of the amorphous phase, were characterized using a PerkinElmer DSC 8500 differential scanning calorimeter (DSC) and phases in the as-cast and crystallized states were characterized using a Rigaku powder X-ray diffractometer, XRD.
In situ energy dispersive diffraction experiments at
constant heating rates in pressures up to 5 GPa were conducted using a Paris-Edinburgh cell on Sector
16-BM-B (HPCAT) at the Advanced Photon Source.[n 13] The detector energy calibration was
deter-mined by measuring diffraction patterns of a Pt refer-ence sample to 29 = 31 deg. For each experiment, the sample and a Au calibration standard were loaded into a custom gasket assembly containing a hexagonal boron nitride capsule as described by Yamada et a/.[11] The
initial pressure for each experiment was determined by applying the equation of state to the room temperature lattice parameter of Au under load.[14] Direct current
through a graphite sleeve surrounding the capsule heated the sample and calibration material to -1473 K (1200 °C) to observe the Fe a —> y phase transition. Type K thermocouples inserted into the cell directly above the sample provided temperature measurements and agreed within ±10 °C with previous calibration data. The cell pressure through the heating experiment was determined using the calibrated temperature and measured Au lattice parameter.
Bragg's law can be written conveniently for energy dispersive diffraction where the energy for a reflection iihkj is measured in keV and lattice spacing iihkl is given
6.199
-hkl
4ki sin(0o) [1]
Energy dispersive diffraction patterns were collected every 60 seconds at 26 = 6 deg. The relatively low 26 was chosen due to the low symmetry of the sample phases and instrument broadening. These patterns were boxcar averaged to ± 3 minutes to improve counting statistics. Diffraction patterns of the calibration material during the run were obtained by periodically reposi-tioning cell position in reference to the beam. Due to the sensitivity of Í 4 H to 6Q, £hki values for Au were
normalized to the room temperature value to allow for measurements using both the {111} and {220} Au peaks.
III. RESULTS AND DISCUSSION
A. Allotropic Forms of Fe
Understanding the role of magnetism on the poly-morphism of iron, i.e., answering the question of what the conditions are that stabilize the various modifica-tions of iron help to advance these technologies.[17] Iron
has two phases with different crystal structures at atmospheric pressure: the body-centered cubic (BCC) a and the face-centered cubic (FCC) y. In the ground state, the BCC FM—>-phase is stable. At atmospheric pressure and 1184 K (911 °C) a-Fe transforms into FCC y-Fe, which is stable up to 1665 K (1392 °C) where it transforms to the PM BCC ¿-Fe. At pressures in excess of 10 GPa an HCP allotrope, s-Fe is observed as shown in Figure 1(a).[18] Polymorphism of iron, and especially
the BCC-FCC transformation, is the basis for the occurrence of a broad range of structures and techno-logically important properties in iron alloys. Without it, the wide spectrum of applications of iron alloys would have not been possible.
Structural transformations in iron occur with a "discontinuous" first-order transformations like in the liquid-solid transformation.[17,20] Such a transformation
is accompanied by a sudden change in the entropy and other physical properties and is accompanied by a latent heat. y-Fe below its stability range would have ordered antiferromagnetically (AF) below about 50 K (223 °C) as illustrated in the heat capacity data of Figure 1(b). In this regard, Fe disobeys a general rule of polymorphism that the high temperature crystal structure is closer packed (e.g., FCC or HCP) than the low temperature structure (e.g., BCC). Iron, however, does not comply with this rule and shows exactly the opposite behavior. The BCC phase, which is stable in the ground state, transforms to the close-packed FCC state at a higher temperature. The reason for this exception lies in the unusual magnetic properties of iron.[5, ] Magnetic field
effects are increasingly being studied in their influence on phase equilibria.[ ,21] In the work here, it is the
influence of the internal exchange field that influences phase stability.
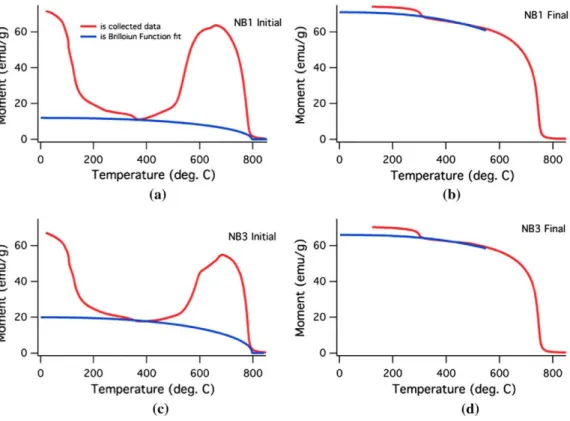
Figure 2(a) illustrates magnetization as a function of temperature during heating for a sample of composition
Feg7.4Nd8.2B44 (NB1) and Figure 2(c) the same for a Feg9jNd5.9B5.o (NB3) composition. The as-cast sample
is amorphous with some pre-existing a-Fe nanocrystals. Crystallization of the amorphous phase occurs at -773 K (500 °C) for a heating rate of 8 °C/minutes with the fraction of a-Fe increasing. The disappearance of the magnetization in a second-order phase transfor-mation at 1043 K (770 °C) is consistent with the Curie temperature, Tc, for a-Fe. The data suggests a nominally
pure a-Fe phase results from crystallization. Tc is well
below the a —> y phase transformation for pure Fe [1183 K (910 °C) at 1 atm.]
Brillouin functions were fit to the heating and cooling curves in Figure 2 in order to determine the percentage of a-Fe in the as-cast state and after crystallization. The functions are of the form[20]:
M =tanh- M
f¡T~c [2]
where M is the magnetization and T is temperature. The Brillouin function was fit to the window of data below the temperature where crystallization occurs, and above
50
1?
40<D 3 0
-u
% 2 0
-8
0-1
10-x 109 / /
E(HCP) / / / / / Y (FCC) /
•~^TX 6(BCC)/Liquid
a (BCC\ V /1 Ns. 1 syt 1
100
Temperature (K)
(a)
Fe
allotropes
ój-
iqTc Ta/y Tyg Tg/Mq
(1042K)(U84K) (1665 K), (1809 K)
ii
500 1000 1500 2000 Temperature (K)
(b)
09 6 0 -—
E £ 4 0
-Momen
t
0
o 1 l
\ — is collected data -\ — is Brilloiun Function fit /
\ [
^J
* *1 1 1 1
. _ NBl Ini
\
--L
i200 400 600
Temperature (deg. C)
(a)
800
"S 60-| E
3.
40-*->
c <u
E 20 o 2
NBl Final
- 1 1 1
200 400 600
Temperature (deg. C) (b)
800
- . 60 H
V 40 H
¡
20H
o 20-1 - 1 1 1 —
200 400 600
Temperature (deg. C)
(c)
NB3 Initial _ c»
60-E
£ 40-*-> c
<D E 20 o
0 - 1 800
NB3 Final
~~I 1 1
200 400 600
Temperature (deg. C)
(d)
800
Fig. 2—M(T) for samples of nominal composition (a) Feg7.4Ndg.2B44 (NBl) and (c) Feg9.1Nd5.9B50 (NB3) showing transitions associated with the crystallization of an amorphous phase at 773 K (500 °C) and a Curie transition at 1043 K (770 °C) in red and Brillouin function fits in blue.
(b) and (d) are M vs T cooling curves for NBl and NB3, respectively. 2:14:1 phase Tc can be seen at 573 K (300 °C) (Color figure online).
576 K (303 °C), which is the Tc of the 2:14:1 phase. As
such, the only phase contributing to the M(T) is a-Fe. The mass percentage of a-Fe in the sample is then calculated by dividing the magnetization due to the presence of a-Fe by the specific magnetization of a-Fe, 220 emu/g. For NBl, this yields a-Fe percentages of 5.5 and 32.3 pet for NBl as-cast and crystallized, respec-tively. For NB3, this yields 9.1 and 30.0 pet for as-cast and crystallized, respectively. These phase percentage balances can be compared to similar calculations based on atomic percentages. If all the Nd is assumed to form the 2:14:1 phase, and any remaining B forms Fe2B, then
the remaining Fe is the percentage of a-Fe in the sample. For composition NBl, this yields 29.2 pet a-Fe, and 43.7 pet a-Fe in NB3. NBl is quite close to the value from the magnetization data, NB3 is not. This is probably due to the presence of other phases in the sample. The NB3 composition, to the right of the 2:14:1 line compound, is in a phase field in which a T2 phase, described as incommensurate-modulated intergrowths of borides into Fe may also have larger Tc making
analysis more complicated. Lastly, the difference in Tc
for a-Fe in the heating and cooling curves is attributed to the difference in heating and cooling rates.
Figure 3 shows waterfall plots of synchrotron X-ray diffraction data for BCC {011} and FCC {111} and {002} reflections for the a- and y-phases of Fe, respec-tively, at two pressures each. The plots show peak intensity from 30 to 80 keV and clearly show the a —> y phase transformation. Peak intensity near 38 keV is due to Nd fluorescence. The BCC {002} and FCC {002} reflections were fit to Gaussian/Lorentzian shapes from
which the nominal nanostructure size of the a-Fe and y-Fe was estimated using a Scherrer analysis.[22,23] From
these plots it can be seen that there is a range of temperatures over which the a-Fe and y-Fe coexist in the ternary system.
The Fe nanostructure size scale is determined from Scherrer analysis of X-ray diffraction data. This was accomplished utilizing the Multi-Peak Fit package in Igor Pro. The {002} peaks for BCC and FCC were fitted with a Gaussian curve. For a Gaussian, the width of the peak is simply related to the integral breadth by
f> = Wy/ñ, [3]
where fi is the integral breadth and w is the width. Instrumental broadening is then removed from the peak integral breadth via quadratic subtraction. The resulting integral breadth can be attributed to crystal size and strain effects. Ignoring the strain effects, the calculated integral breadth fis was used to estimate the
crystal size using the Scherrer equation for energy dis-persive X-ray diffraction[24]:
D = Kx 6.199
Ps sin(0o) ' [4]
K'OO 1 L O 1 0 0 0 - B 1
^ H m
3 800 • •
Temperatur
e
-t
C
D
o
o
o
o
200 • •
0 - ^ 1
/
(111)
1
I
I
NB
l Hi
¡
Y \ ^(002)
\ / (011)
\J \
1200-H H
-*—~» ^ ^ ^ ^ 1 • •
o íooo • U
^ ^ ^ E ^^H
! :^tiS
J^^H **^H
^ 9
TJ^H
l^^^^l ^^^^^E
T
íf
rí
("D U
1
l
n i
í
\
i
W
(002)t
z/ (011)
30 40 50 60 70
Energy (keV)
(a)
80 30 40 50 60 70
Energy (keV)
(b)
80
1000 800
2 E
0)
600 400 200
40 50 60 70
Energy (keV)
(c)
80 40 50 60 70
Energy (keV)
(d)
80
Fig. 3—Waterfall plots of synchrotron X-ray diffraction data for the BCC and FCC reflections for the a- and y-phases of Fe, respectively (a) NBl 2.2 GPa, (b) NBl 5.0 GPa, (c) NB3 0.9 GPa, and (d) NB3 4.6 GPa.
characteristic size of the Fe nanostructures. In both cases the as-cast samples have some nominally 10 to 12 nm a-Fe in the amorphous matrix. The characteristic size scale of the a-Fe increases significantly on approaching the a —> y-phase transformation tempera-ture with noticeable pressure dependence of this growth. Above the a —> y-phase transformation temperature the y-Fe phase continues to grow. This growth appears to be significantly suppressed at higher pressures. In contrast to the isopleth published[9] for atmospheric pressure,
both compositions appear to have an -373 K (100 °C) range of temperature over which the a and y-phases coexist.
A region of coexistence between the a and y phases over a range of temperatures is possible in ternary and the multicomponent systems and has been seen for example in Fe-Ni-Zr-B(Cu) systems.[23] The coexistence
is potentially related to differences in particle size and interfacial effects, but differences between flake and powdered samples are ambiguous at present. The
coexistence regions are marked with ovals in the Figure. The area of coexistence is easily seen in (c) and (d). These are plots of the {002} peak areas with tempera-ture. The high-temperature Fe structure size decreases in (a) and (c) are due to melting.
The pressure dependence of the Fe particle size growth is consistent with a defect-mediated diffusion process.[25] In the as-cast state, these materials contain
significant amorphous phase content and the diffusion of Fe atoms can be suppressed by pressure. This is technically relevant to limit the size of the soft magnetic phase in spring exchange magnets. Coercivity is maxi-mized in spring exchange materials by aligning the crystal texture of the hard phase.[27,28] This alignment is
often accomplished using anisotropic stress, whereas the stress applied in this case is largely isotropic. Further work is required to determine the effect of anisotropic stress on diffusion in these materials.
1 4 0 0
< 1 2 0 0
-N 1 0 0 0
s; 8 0 0
o 6 0 0
¿o 4 0 0
-q>
"• 2 0 0 -0 - ,
NBl
is high pressure BCC is high pressure FCC is low pressure BCC is low pressure FCC
1 ' 1 "-400 800
Temperture (deg. C) (a)
1200
1400-< 1200
N 1000 £ 800-S 600 5> 400 "- 200
OH
NB3
is high pressure BCC is high pressure FCC is low pressure BCC is low pressure FCC
T T T 1 1
200 400 600 800 1000
Temperature (deg. C)
(b)
1.0
0.8
0.6
0.4
0 . 2
-- | 1 1 ^ 7 -- i -
r-400 800 1200
Temperature (deg. C) (c)
1.0=> 0 . 8
0 . 4
-S 0.2
~\ 1 1 T r
200 400 600 800 1000
Temperature (deg. C)
(d)
Fig. 4—Fe nanostructure size scale as determined from Scherrer analysis of XRD data for the (002) reflection for the a- and y-phases vs temper-ature at 1.0 and 5 GPa, for sample composition (a) NBl and (b) NB3. (c) and (d) are (002) peak area as a function of tempertemper-ature.
exchange length is calculated as proportional to (A/K)1/2
where A is the exchange stiffness and K is the magnetic anisotropy. For a hard material like the 2:14:1 phase the exchange length is ~1 nm, whereas for soft Fe it is an order of magnitude greater, -20 nm. In this light, the data of Figure 4 is quite significant. The soft Fe size is considerably smaller than its exchange length for T < -873 K (600 °C). Both Scherrer and peak area analyses indicate considerable coarsening in the vicinity of the a —> y-phase transformation. It is perhaps not surprising that the rate of attachment of Fe from any remaining amorphous phase to the FCC phase is correlated to increased coarsening. Encouraging for applications in spring exchange magnets is the fact that grain growth can be significantly suppressed at higher pressures. If methods for achieving reduced coarsening as favorable texture of the hard-phase grains can be demonstrated then possibilities for improved 2:14:1 spring exchange magnets may be possible. Note that the suppression of the a —> y-phase transformation temperature with pressure is anomalous and considered in terms of magnetic contributions to the enthalpy and entropy of the phase transformation in the next sections of this paper.
B. Equations of State (EOS) for Fe
The EOS of a solid (P, V, T relation) can be determined from first principle calculations and used to determine thermodynamic properties for comparison with experiments. Different approaches include finding
reliable methods of curve fitting[31] and proposing
models based on the rather different energetics of various classes of solids.[32] In evaluating
thermody-namic properties of Fe we begin by considering the previous work of Austin,[33] where the heat capacity
under constant pressure, cp, is a quantity that can be
determined experimentally as illustrated in Figure 1. The difference in cp of Fe in the a —> y transition has
been determined to be
AC„ -2.75 + 0.00113 T [5]
The Enthalpy change in the a —> y transition is determined using the relationship:
AH = / Ac„ • AT [6]
Finally to determine the functional dependence, P(T), for the P-T phase boundary for the a —> y transition we employ a Clapeyron relationship:
dP
df~
TAVa^y [7]1200
1000-800
600-
400-200
-Abuin etal. theory - Anderson theory
J. Zhang eta. (1999) R. Boehleretal. (1987) Peter W. Miraaldetal. (1979) H. M. Strong etal. (1973) BunoyF.P. (1965)
- 1 — 10
r -
12001100
-
1000-
900-\
V FeNdB3
^ ; > Powder
FeNdB3 \
a
Abuin et at. theory Anderson theory • J. Zhang eta. (1999)
A R. Boehleretal. (1987)
* Peter W. Mirvraldetal. (1979)
• H. M. Strong etal. (1973) O Experimental results (transition begin) O Experimental results (transition finish) > O Flake
^ FeNdB3
v
• % ^" v
^4
* í5^ A^ •
\
/V
^
^
^^ 1
12
P (GPa)
(a)
P (GPa)
(b)
Fig. 5—(a) Experimental data from 1965 to 2000[35 391 as compared with the Austin and Anderson-derived equations of state and (b)
superim-posed data for flake and powder samples in this study. The two dash lines show a ±5 pet error in our calculation and Anderson theory.
P(T) =A+B-T+C-T2+D-lnT [8]
Another empirical representation of the EOS has been proposed by Anderson. Anderson proposes "A Univer-sal Thermal Equation-of-State." His studies indicate an empirical relationship between P, T and V of the form:
P(T) b-T- [9]
where "a + ZrT" is independent of volume and the last term is the anharmonic correction to the classical quasi-harmonic solid case.
Figure 5(a) plots experimental data published between 1965 and 2000[Í6 30] as compared with the
Austin and Anderson-derived EOS. This data is banded within ± 5 pet error bar as illustrated by the two dashed lines. In Figure 5(b), we include results of this study on the Fe phase in our nanocomposite samples. This figure distinguishes between flake and powder samples. Figure 2(b) shows two important features:
(1) The phase transition begins at a higher temper-ature in flake samples than in powder samples. (2) At low pressure this difference is smaller than at
high pressure.
It is important to note that neither of the models consider the magnetic contributions to the heat capac-ities which were illustrated in Figure 1 and considered in more detail below.
C. Considerations of Thermodynamic Equations of State
(EOS) for Fe in Light of Magnetic Contributions to the Heat Capacity
Analysis of the Clapeyron equation on the basis of the experimental and predicted EOS lead to the following conclusions:
(1) As shown in both Figures 1 and 2, for Fe: The slope of the P-T boundary between the ± and a phase fields is negative. Pepperhoff and Acet[40]
show this boundary to turn over and change slope at negative pressures and then increase continu-ously in the FCC y to BCC 5 phase transforma-tion.
(2) This negative slope of the P-T coexistence boundary for a and y is anomalous. The slope ^jj = j ^ is usually positive in solids since the smaller molar volume phase usually has the smaller entropy, (considering only vibrational or configurational entropy). For the y and a phases the volume difference can be calculated on the basis of crystallographic data as shown in Table I.[40'41] Of note is that the BCC structure,
is the most stable modification at low temper-atures and has an atomic volume at 4 K that is 3.5 pet larger than that of FCC Fe:
AV Va - V1
V Va
= 3.5 pet
Phase
Table I. Room Temperature Lattice Constants and Atomic Volumes for a and y Iron'40'41'
T [K (°C)] Lattice Constant a (nm) Volume Per Atom Ka (10 3 nm3) Molar Volume (cm3 mol :)
295 (22)
295 (22) 0.2866 0.3571
0.2860
0.3562
aj/2 = 11.697
= 11.773 a3/4 = 11.295
= 11.384
Since AV is negative for y going to a, AS must be positive, which means that the entropy of y is larger than that of y.
(3) Combining the slope of the phase boundary and the sign of the volume change allows us to conclude further that both AHa^ and ASa^y
are positive quantities.
(4) At low temperature there are two main contribu-tions to the entropy of a magnetic solid: (i) the lattice (vibrational) entropy and (ii) the spin entropy of the moments on each atom. The Clapeyron equation therefore predicts
S>>S"
s
y+
s
y>sr +sr
lattice spin lattice spinbut it is further well known that the lattice entropy for BCC metals is larger than that for FCC metals so that it can be further concluded that
& >(Sa -S> ) + sa
spin x lattice lattice' spin
Since both terms on the right hand side are positive we conclude that
S1 >Sa
spin spin
which shows that FCC y-iron must have larger spin entropy than BCC y-iron does. The origin of the large cp
and entropy of the a-phase at low temperatures is the disordering of the AF state of y-iron. Thus, if y-iron were not AF at low temperature it would not form at high temperatures.
(5) The origin of larger spin entropy in y-iron is in part rooted in larger dipole moments as well as the larger coordination number in the FCC phase. The negative slope (dP/dT) in the Clapeyron equation is analogous to that seen in the lower density solid to higher density liquid phase transformation in water. In the case of water, the origin of the negative slope has been explained as resulting from the electric dipole moment of the water molecule.[42] The extra degree of freedom
offered by an internal magnetic or electric field is thus seen as important to these anomalous slopes in the Clapeyron equation behavior in structural phase transformations.
In light of the observed slope of the P-T phase boundary for the a —> y transformation we lastly consider the enthalpy change in the phase tion and its comparison with other phase transforma-tions between BCC and FCC allotropes of elements that are magnetic and non-magnetic. Pepperhoff and Acet[40]
report average AH for the a —> y transformation,
AIT ~* \ to be -900 J/mol at 1184 K (911 °C) and AH
for the y —> S transformation, AH1 ~* s, to be -850 J/mol
at 1665 K (1392 °C) which are each on the order of 6 pet of the enthalpy of melting of the BCC, 5 phase [-14,000 J/mol at 1809 K (1536 °C)]. These are both the same sign, consistent with the fact that the opposite change in sign of AV for the y —> 5 transformation as compared with the a —> y transformation is reflected in a positive slope of the y —> 5 P-T phase boundary.
Recent ab initio studies have been compared with CALPHAD elemental lattice stabilities.[43] In this paper,
Wang et a/.[43] have calculated the relative enthalpies
among the BCC, FCC, and HCP structures using a first-principles approach, at 0 K (273 °C), across the periodic table. The authors observe enthalpies for the a —> y transformation in Fe that are an order of magnitude larger than experimental values. Although magnetism was included in the context of the local density approximation in the calculations (i.e., spin-den-sity functional theory[44]) there is a large discrepancy
between theory and experiment. On the other hand, calculations for non-magnetic elements yield reasonable agreement with experiments for other elements with BCC to FCC and BCC to HCP phase transformations. In this context, the order of magnitude difference in magnitude of the enthalpy of the BCC—>FCC and BCC—>HCP transformation between Fe and non-mag-netic elements is further suggestive of the important role magnetism has in determining structural stability. Ab
initio calculations may be improved for magnetic
sys-tems with inclusion of spin-orbit interactions in the energetics.
D. Coarsening/Growth Mechanisms for Iron
The observations of the increase in average size of the (a/y) iron crystallites with increasing temperature can be interpreted in terms of classical models. Two possibil-ities are postulated to explain the kinetics, one based on crystallization and one on coarsening of a distribution of pre-existing particles.[45 48] Distinction between these
possibilities will require further study including microstructural observations after holding at various times under isothermal conditions and observations of evolution of the size evolution of Fe particles at different heating rates. Such experiments are limited in the configuration and atmospheres accessible with the Paris-Edinburgh cell used at the APS. However, more controlled ex situ experiments may be possible in the future. Magnetometry data on flake samples suggest that even at the highest cooling rates attainable in our PFC experiments, some pre-existing Fe particles are present in the amorphous matrix. These can be further amorphized through ball milling, but the powdered samples are more prone to oxidation at elevated temperatures complicating the analysis of the size evolution. Our data does suggest that thermomechanical processing routes[49] may be extended to further
IV. CONCLUSIONS
The pressure dependence of the a —> y phase trans-formation in Fe phase in spring exchange magnets was studied. A suppression of coarsening (growth) in both phases was observed at higher pressures. Synchrotron X-ray diffraction showed the a —> y-phase transforma-tions to occur at temperatures of 1120 K (847 °C) at 1 GPa and 960 K (687 °C) at 5 GPa. Our experimental data was consistent with other reported observations for Fe and with EOS determined from first-principle calcu-lations. A consideration of the magnetic contribution to the heat capacity of Fe points to the importance of dipole moments on the slope of the Clapeyron equation for the P-T phase diagram in Fe. The phase transition occurs at temperatures where diffusional growth is also operative. This is significant since the size of soft Fe nanostructures is important to spring exchange. Sup-pression of the phase transition and Fe size at higher pressures suggest that there may be interesting thermo-mechanical processing routes to be investigated to optimize spring exchange effects in Nd-Fe-B permanent magnets.
ACKNOWLEDGMENTS
All authors would like to acknowledge Argonne Nation Laboratory for beam time. M.A. would like to acknowledge the PICATA fellowship. M.E.M, V.K., V.D., N.A., and A.L. acknowledge support from the Wright Patterson Air Force (Contract Number: FA8650-12-D-2225).Z.T, J.C.H and S.L.S acknowl-edge support from the AFOSR.
REFERENCES
J.F. Herbst, J.J. Croat, and F.E. Pinkerton: Phys. Rev. B, 1984. vol. 29, pp. 4176-78.
D. Givord, H.S. Li, and J.M. Moreau: Solid State Commun., 1984, vol. 50, pp. 497-99.
J.F. Herbst: Rev. Mod. Phys., 1991, vol. 63, pp. 819-98.
R. Skomski and J.M.D. Coey: Phys. Rev. B, 1993, vol. 48. pp. 15812-16.
A. Inoue, A. Takeuchi, A. Makino, and T. Masumoto: IEEE Trans. Magn., 1995, vol. 31, pp. 3626-28.
A. Leary, S. Kernion, M.A. Lucas, P. R. Ohodnicki, and M. E. McHenry: /. Appl. Phys., 2013, vol. 113, 17A317-317-3.
Y. Hanlumyuang, P.R. Ohodnicki, D.E. Laughlin, and M.E. McHenry: /. Appl. Phys., 2006, vol. 99, p. 08F101.
P.R. Ohodnicki, D.E. Laughlin, M.E. McHenry, and M. Widom: Acta Mater., 2010, vol. 58, pp. 4804-813.
M.-A. Van Ende and I.-H. Jung: / . Alloys Compounds, 2013, vol. 548, pp. 133-54.
D. Givord, P. Tenaud, and J.M. Moreau: /. Less Common Met.. 1986, vol. 123, pp. 109-116.
A. Yamada, Y.B. Wang, T. Inoue, W . G Yang, C. Park, T. Yu, and G Y . Shen: Rev. Sci. Instrum., 2011, vol. 82, p. 015103. Y. Kono, C. Park, C. Kenney-Benson, G. Shen, and Y. Wang: Phys. Earth Planet. Inter., 2014, vol. 228, pp. 269-80.
13. G. Shen, P. Chow, Y. Xiao, S. Sinogeikin, Y. Meng, W. Yang, H.-P. Lieermann, O. Shebanova, E. Rod, A. Bommannavar, and H.-K. Mao: High Press. Res., 2008, vol. 28, pp. 145-62.
14. O.L. Anderson, D G . Isaak, and S. Yamamoto: / . Appl. Phys., 1989, vol. 65, pp. 1534-43.
15. B. Buras, D.L. Gerward, J. Jorgensen, and B. Willis: International Tables for Crystallography, 2006, Section 2.5.1, vol. C, pp. 84-87. 16. S. Clark: Crystallogr. Rev., 2002, vol. 8, pp. 57-92.
17. T.B. Massalski and D.E. Laughlin: CALPHAD, 2009, vol. 33. pp. 3-7.
18. T. Dinsdale: CALPHAD, 1991, vol. 15, pp. 317^125.
19. C. Barrett and T.B. Massalski: Structure of Metals, Crystallo-graphic Methods, Principles and Data", 3rd revised edition, Inter-national Series on Materials Science and Technology, Pergamon. Oxford, 1980, vol. 35.
20. M. E. McHenry and D. E. Laughlin; Chapter 19—Magnetic Properties of Metals and Alloys. Physical Metallurgy 5th Edition, (in press).
21. P.R. Ohodnicki, Y. Hanlumyuang, D.E. Laughlin, and M.E. McHenry: Metall. Mater. Trans. A, 2007, vol. 38A. pp. 738-44.
22. M.E. McHenry, S.A. Majetich, M.J. De Graef, J.O. Artman, and S. Staley: Phys. Rev. B, 1994, vol. 49, pp. 11358-63.
23. D. Apel et al.: Zeitschrift fur Kristallographie, 2011, vol. 226, No. 12.
24. F J. J. Ipus, P. Herre, P. R. Ohodnicki, and M. E. McHenry: /. Appl. Phys., 2012, vol. I l l , 07A323-07A325-27.
25. F. Faupel, W. Frank, M.-P. Macht, V. Naundorf, K. Ratzke, H. Schober, S. Sharma, and H. Teichler: Rev. Mod. Phys., 2003, vol. 75, pp. 237-280.
26. E.F. Kneller and R. Hawig: IEEE Trans. Magn., 1991, vol. 27, pp. 3588-60.
27. R. Skomski and J.M.D. Coey: Phys. Rev. B, 1993, vol. 48, pp. 15812-16.
28. G. Herzer: IEEE Trans. Magn., 1990, vol. 26, pp. 1397-402. 29. M.E. McHenry, M.A. Willard, and D.E. Laughlin: Prog. Mater.
Sci., 1999, vol. 44, pp. 291-433.
30. J. Birch: Geophys. Res., 1952, vol. 57, pp. 227-86.
31. B.D. Cullity and C D . Graham: Introduction to Magnetic Mate-rials, 2nd ed., IEEE Press, Wiley, Hoboken, 2009.
32. P. Vinet et at J. Phys. Condens. Matter, 1989, vol. 1. 33. J.B. Austin: bid. Eng. Chem., 1932, vol. 24, pp. 1225-35. 34. O.L. Anderson: / . Geodyn., 1984, vol. 1, pp. 185-214. 35. F.P. Bundy: /. Appl. Phys., 1965, vol. 26, pp. 616-20. 36. H.M. Strong et al:. Met. Trans., 1973, vol. 4, pp. 2657-61. 37. P.W. Mirwald and G C . Kennedy: / . Geophys. Res., 1979, vol. 84,
pp. 656-58.
38. R. Boehler et al.: High-Pressure Research in Mineral Physics, 1987. pp. 173-76.
39. J. Zhang: Phys. Chem. Miner., 1999, vol. 26, pp. 644-48. 40. W. Pepperhoff and M. Acet: Constitution and Magnetism of Iron
and Its Alloys, 3, Springer, Berlin, 2001.
41. M. DeGraef and M.E. McHenry: Structure of Materials, 1st ed., Cambridge University Press, New York, 2007.
42. P.A. Rock: Chemical Thermodynamics, University Science Books, Mill Valley, CA, 1983.
43. Y. Wang, S. Curtaroala, C. Jiang, R. Arroyave, T. Wang, G Ceder, L.Q. Chen, and Z.K. Liu: Comput. Coupling Phase Diagr. Thermodyn., 2004, vol. 28, pp. 79-90.
44. J.M. MacLaren, D.P. Clougherty, M.E. McHenry, and M.M. Donovan: Comput. Phys. Commun., 1991, vol. 66, pp. 383-91. 45. S.L. Semiatin, J.C. Soper, and I.M. Sukonnik: Scr. Metall. Mater..
1994, vol. 30, pp. 951-55.
46. D.L. Bourell and W. Kaysser: Acta Metall. Mater., 1993, vol. 41. pp. 2933-2937.
47. S.V. Prikhodko and A.J. Ardell: Acta Mater., 2003, vol. 51, pp. 5001-5012.
48. S.V. Prikhodko and A.J. Ardell: Acta Mater., 2003, vol. 51, pp. 5013-5019.