Design of maintenance structures for rural electrification with solar
home systems. The case of the Moroccan program
L.M. Carrasco , F.J. Martín-Campo , L Narvarte , M.T. Ortuño , B. Vitoriano
A B S T R A C T
In decentralised rural electrification through solar home systems, private companies and promoting institutions are faced with the problem of deploying maintenance structures to operate and guarantee the service of the solar systems for long periods (ten years or more). The problems linked to decen-tralisation, such as the dispersion of dwellings, difficult access and maintenance needs, makes it an arduous task. This paper proposes an innovative design tool created ad hoc for photovoltaic rural elec-trification based on a real photovoltaic rural elecelec-trification program in Morocco as a special case study. The tool is developed from a mathematical model comprising a set of decision variables (location, transport, etc.) that must meet certain constraints and whose optimisation criterion is the minimum cost of the operation and maintenance activity assuming an established quality of service. The main output of the model is the overall cost of the maintenance structure. The best location for the local maintenance headquarters and warehouses in a given region is established, as are the number of maintenance technicians and vehicles required.
1. Introduction
Human development is a concept that has evolved over the years. In recent times, this has included access to basic services, such as electricity [1]. In the so-called developing countries, most remote rural areas do not have access to electricity grids (an example is India, that had up to 400 million people without access to electricity in 2011 [2], concentrated in the poorest states of the country [3]). Photovoltaic rural electrification (PVRE) represents, in many cases, the only hope of accessing electricity [4]. A recent study [5] shows how regions in developing countries with a low density population favour stand-alone solutions for providing ac-cess to energy. A good example is the case of remote regions in Mali [6], where PVRE has been implemented as a sustainable energy solution for rural villages. PVRE has gone through a change of scale during the last decade in terms of size and sustainability, which has given rise to the development of large-scale programs with thou-sands of solar home systems (SHS) and long operation and main-tenance (O&M) service periods. Bangladesh is a paradigmatic
example with more than 4 million solar home systems installed up to July 2016 [7]. The fee for service financial model [8] has largely been adopted in many of these programs devolving the re-sponsibility for the implementation and management of the pro-grams to specialized energy service companies (ESCO), as in South Africa [9], Zambia [10] or Morocco in the PERG program [11].
Acronyms
Ah CM ESCO GAMS LC MTTF O&M ONEE PERG PM PV PVRE PWM SHS Si SLI SOC Wp
Ampere hour
Corrective Maintenance Energy Service Company
General Algebraic Modelling System Low power Consumption light lamps Mean Time To Failure
Operation and Maintenance
Office National de l'Electricité et l'Eau (Morocco) Program d'Electrification Rurale Globale (Morocco) Preventive Maintenance
Photovoltaic
Photovoltaic Rural Electrification
Pulse-Width Modulation (charge controller) Solar Home Systems
Silicon
Start-Lighting-Ignition (Battery) State Of Charge
Watt peak
fee for service model is to organise the operation and maintenance
of the systems and fee collection in a financially sustainable way. In fact, decentralisation adds uncertainty the O&M costs, depending on aspects such as the geographical density of the SHSs, their actual reliability in operating conditions, road access [16] or the different local costs (salaries, vehicles, fuel, taxes, etc.). To date no cases of the systematic use of maintenance structure design tools based on actual data are known in the field of PVRE.
To tackle this deficiency, the objective of this paper is to carry out a first approach of an ad-hoc tool for the design of maintenance structures for PVRE programs in decentralised areas, with the aim of minimising the O&M costs. This tool has been developed for an actual PVRE program carried out in Morocco as a case study, whose inputs are not traditional assumptions but real figures as regards the actual reliability of the SHS components in this program, the O&M structure deployed and their costs. Similar ad hoc tools have been developed in the field of rural development [17] and electri-fication through renewable energies [18]. However, to our knowl-edge, there are no reported cases in the field of O&M in PVRE using SHSs. As this study is restricted to this particular program, it is not the aim of the authors to present this tool as a general solution but to show the potential benefits of its application to this kind of PVRE program. Adaptations of this tool could be useful for other pro-grams with different kinds of technical features and management requirements.
The methodology used in the research work is based on the development of a mathematical optimisation model [19], applied to the PVRE program carried out in Morocco, the so-called Programme
d'Electrification Rurale Global (PERG) [20], as a representative case of the fee-for-service initiatives carried out worldwide. The authors have had access to the 5-year maintenance and cost databases of the PERG program from between 2006 and 2010, provided by the ESCO, ISOFOTON, as well as the organizational and management structure deployed by the ESCO during that period. The mainte-nance of the PERG program has already been analysed in three previous papers in which the reliability study of the SHSs [21 ], the degradation of batteries and PV modules [22] and the O&M cost assessment [23] were set out. The proposed optimisation model has been implemented using GAMS [24], one of the most powerful algebraic modelling languages, and solved using the CPLEX
optimiser [25], which uses a branch-and-cut procedure [26]. The input data required has been defined together with several vari-ables and restrictions. An objective function for computing the cost of the O&M services is optimised, and the following outputs have been obtained:
- composition of the maintenance structure (number of techni-cians and vehicles),
- location and number of local agencies (local maintenance headquarters and warehouses),
- scheduling of preventive maintenance and the collection of fees, - total cost of the services.
A prototype model has been implemented and validated in three of the nine provinces of the PERG region in order to show how this tool can be useful in helping ESCOs in the design of the maintenance structures in PVRE programs.
2. Perg program baseline data
The Moroccan PERG program was carried out by different ESCOs in partnership with the national utility; the Office National
d'Elec-tricité et l'Eau (ONEE) [27]. Our study focuses on the program car-ried out by the ESCO ISOFOTON, one of the participants in the program, which started in 2005 in a vast and mountainous area of around 200,000 km2, and with 13,452 installed SHSs.
The ONEE, as the promoter of the electrification program, established the technical, financial and organizational conditions, which the ESCO had to follow in the development of the program. The PERG was set up as a fee for service model, so the ESCOs were responsible for the marketing, sales, installation and operation & maintenance of the SHSs in accordance with the following princi-ples set out by the ONEE:
• The SHS cost is 90% subsidized by the utility. The remaining 10% is paid by the user through a fee collected by the ESCO (around €70).
• The SHS model is sized and standardized by the ONEE for the whole concession (Fig. 1).
• The user signs a subscription contract with the ONEE, and a second contract with the ESCO and the ONEE for the O&M service.
• The time required for installing the SHS is 2 weeks from signing the contract and paying the subscription fee.
• The ONEE utility is the owner of the SHS.
• The 10-year maintenance period begins after installation. Dur-ing this period the ESCO has to guarantee the service of the SHS, replacing any components that fail.
• The ESCO had to train the customers only in the use of the SHS, as the maintenance work is the responsibility of the ESCO • During the O&M period the user has to pay a monthly fee of
around € 5 (taxes not included) to the ESCO corresponding to the maintenance service
• The ESCO is required to have a free phone number available for the customers in case of a fault in the SHS or any of its components.
• The ESCO has to repair or replace every defective or malfunc-tioning SHS component within 48 h from being notified by the user (corrective maintenance).
• The ESCO must visit every SHS at least once each 6 months to check the state of the SHS and to fill the battery with distilled water (preventive maintenance).
75 Wp PV module
15 A charge controller
LC lamps
<
150 Ah/12 V SLI battery
12 Vix plug
Qt SHS component
Si-Monocristallin PV module of 75Wp
1 SLI Pb-acid battery of 150 Ah C20 and 12 V Charge controller PWM of 15 A
Compact fluorescent lamps of 7 W
Compact fluorescent lamps of 11W
Miscellaneous (wire, switches, plug, etc)
Fig. 1. SHS scheme and components of the PERG program standardized by the ONEE. Note that a DC plug is provided to supply loads such as radio, TV, smart phone chargers, etc, as long as it does not exceed a load of 15 A.
• In case of more than 3 months of non-payment by the user, the ESCO is able to dismount the SHS.
Note that some specifications imposed by the ONEE could have been better, the preventive maintenance for example, since two visits a year might not be enough to guarantee the replenishment of the water in the battery.
The local O&M structure deployed by the ESCO and validated by the ONEE is detailed in Table 1. The location of the ISOFOTON PERG provinces is shown in Fig. 2. The local structure was made up of 9 local agencies, 43 employees and 19 vehicles.
The provinces are administratively divided into several rural communities (R), comprising a rural centre (r) and a number of dispersed villages (V). The rural centre (r) is the administrative capital of the community (R).
The ESCO's local agency serves as both executive office and warehouse. One administrative employee is in charge of the administration tasks and remains permanently in the agency. The SHS' spare parts are stocked in the warehouse, where the O&M technicians pick them up for the maintenance and return the failed components from the in-field SHSs. The O&M teams are made up of two technicians and one vehicle.
The choice of the location of the local agencies adopted by the ESCO management staff was made for logistic and administrative reasons. This is why some of the agencies are located in the capital of the provinces, close to the utility bureaus, banks and regional government offices. Nevertheless, other agencies were based in rural community centres (r) to be closer to the PERG users, such as in Errachidia, Al Kalaa des Sraghnas, Al Haouz or Beni Mellal (see Fig. 2).
2.1. Operation and maintenance
Depending on its nature, maintenance in the PERG program is differentiated into two types. Preventive maintenance (PM)
consists of checking the performance of the SHS periodically. The battery must be filled with distilled water if necessary, the PV module cleaned, electric connections checked and failed lamps replaced. The PM is a deterministic process, as each SHS must be checked every 6 months, according to PERG regulations.
Corrective maintenance (CM) is carried out after prior notifica-tion from the user when he/she notices a problem in the operanotifica-tion of the SHS. Then, the ESCO technicians (distributed in teams of two people per vehicle) go to the dwelling within 48 h to repair the system or replace the failed components and return to restart the SHS.
Apart from maintenance, the technicians are also responsible for collecting the monthly fees paid by the users, which can be carried out during the maintenance visits, in the local agency, or mainly at the weekly markets organized in the rural centres (r), known as
souks. These traditional soul<s attract most of the surrounding rural
population and are the best places to meet the SHS users, collect the monthly fees and replace failed lamps that users bring from their dwellings. Note that lamps are the only SHS component that can be replaced at the souks.
The maintenance technicians are in charge of collecting the fees at the souks every week. This task can be carried out by one tech-nician so the other one can devote the time to maintenance services in the surrounding villages.
3. Methodology
The steps to build and run the modelling tool are described below. It is based on a mixed integer linear optimisation model. The input of the tool is made up of a set of parameters with which certain associated variables are calculated. An objective function is optimised according to a series of constraints that must be satisfied. Fig. 3 shows the schematic running of the optimisation model:
The model considers at least one local agency in the province located in the capital or in one of the rural centres (variable BLr). Table 1
Summary of the O&M structure location (local agencies) in the different provinces of the PERG program. The areas in the provinces and the installed SHSs are also shown. Provinces
Total Ben Slimane Errachidia Beni Mellal Azilal Al Haouz -Al Kalaa des Ouarzazate Taroudant
Marrakech Sraghnas - Zagora Tiznit — Guelmim — Assa-Zag
Province Capital
-Ben Slimane Errachidia Beni Mellal Azilal Taghnaout Al Kalaa des Ouarzazate Taroudant Tiznit
Sraghnas
Area km2
214,531 2760 59,585 6638 9800 7883 10,070 55,298 16,500 45,997
Number of SHSs 13,452 857 959 2723 1809 862 4396 841 689 316
Density (SHS/km2) 0.063
0.311 0.016 0.410 0.185 0.109 0.437 0.015 0.042 0.007
Local agency location 9
¿Í-Jiznit I
^ - G u e l m i m jl
^ _ _ _ _ _ - - ' \ \ Assa-Zag
^ — ^ — ^ ^ ^ ^ W (^_) Local Agency
/^ 0 Capital of the Province
( • ) Local Agency in the Capital
Fig. 2. Moroccan provinces belonging to the PERG program. More than 13,000 SHSs were installed in an area of 214,000 km2. The location of the local agencies is indicated. Note
that some of them are placed in the capital of the province.
Number of SHSs and location
Road network (distances) MATHEMATICAL
Number of villages and location
Time needed for travel
• Time devoted to collecting fees
• Local markets {souks} timetable and location
Dbjective function
Variables output: - Local agencies: quantity
and location
- O&M structure: number
Fig. 3. Modelling tool scheme. The inputs describe the situation in the field and the outputs are the results of the modelling tool in accordance with the mathematical model.
The first decision that the model must make is the location of the local agency or agencies. Furthermore, each rural community is assigned to a local agency (variable BATf) in such a way that the SHSs in the rural community are attended to by technicians from the associated local agency.
The second element to be determined is the number of vehicles associated to each local agency. They are required for the O&M technicians to get to the villages and souks, and a vehicle is assigned for every two technicians. Each local agency has at least one vehicle (variable NCRr).
The model is developed taking into account that described in section 2 and the following work dynamic:
• On the work day, the O&M teams depart in a vehicle early in the morning from the local agency with two possible destinations: a) the rural dwellings for maintenance work; b) one of the souks for fee collection. Fig. 4 summarizes the work-day scheme. If
option a), the team will go to the rural dwellings in accordance with a set plan be it PM or CM for repairs. If option b), the team will go to the souk. There, at least one of the technicians will
MORNING
LOCAL
Departure of O&M teams
P
AFTERNOON EVENING
VILLAGES
PM and CM Maintenance
SOUK
i / \
| _ | /
L0CALL-í>
Fee collection
A b L N L Y
Return of O&M teams
remain while the other one carries out maintenance tasks in the villages of the rural community, if necessary. When the work of the day is completed, they return to the local agency.
The technician's daily work must include the travelling time (departure from the local agency and return) as well as the maintenance service time. In no case should it exceed the established working day.
As regards the soul<s, not all of them will be visited for fee collection, but just those frequented by PERG users (defined by the parameter br¿). The time devoted to the souk work is expressed by parameter tbr ¿.
The average time required to undertake a maintenance action
(tas), either preventive or corrective (from arriving at the
dwelling to leaving) is also defined, taking into account the average time set out by the ESCO, ISOFOTON. Travel and time for maintenance activities take into account the daily work of the technicians, which is not allowed to exceed the established work day (dailyt).
3.1. Input parameters and associated variables
The optimisation model is designed to be used in a particular province. The model consists of a network of nodes representing the capital of the province and several rural communities (R), which includes some small villages (V). Around each village, there are few dispersed dwellings where a number of SHSs are installed.
The model will run for a given planning period or "planning horizon", D. To avoid problems of dimensions, this planning period will not be a complete year, but the period in which at least one visit to each rural community must be carried out. Because of the established quality of service committed to, each SHS must be visited twice a year for preventive maintenance, so each rural community will be visited at least once every six months. However, being realistic, as there is corrective maintenance to be carried out and fees to be collected, the assumption will be that each rural community has to be visited every two months. Then, the proposed planning period will be two months, corresponding to 52 working days (6 working days per week).
R = {\,...,R} Rural communities in the province considered. V = {1,..., V} Villages in the province.
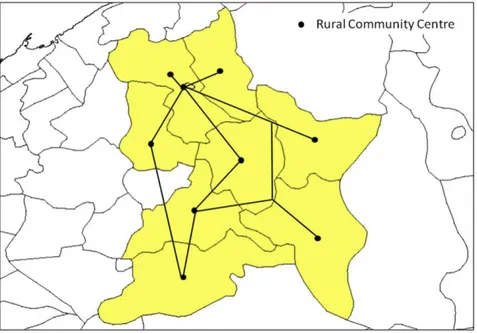
D = {1, ...,D} Days to be considered in the planning period. The transport network consists of paved roads that link the main towns (almost all the rural community centres), and tracks to reach the small villages. Distances and average speed according to the type of road are used to calculate the travel time. Fig. 5 shows a schematic example of nodes in one of the PERG provinces.
The input parameters are described in Table 2:
The parameters described in Table 3 are calculated from the previous setting:
After setting the input parameters, the model variables are defined in accordance with Table 4:
3.2. Model assumptions 3.2.1. Displacement scheme
For reasons of simplicity, it has been assumed that to reach a village (V), it is always necessary to go through the rural centre, which is also supposed to be placed at the geographical centre of the rural community. Data on the exact location of the different villages (nvr) are not available, they are assumed to be dispersed throughout the rural community around the geographical centre at an average distance (dist\) (see example in Fig. 6). Moreover, the model will consider that moving from a village (vr) to another
within the same rural community (v\) has to be made by going through the centre.
Furthermore, it will be assumed that the displacements to rural communities from the local agencies are a round-trip, i.e., not configuring routes. The main reason for doing so is that when computing the costs of the corrective maintenance, it is very plausible that each rural community must be visited directly at least once during the planning period.
3.2.2. Corrective maintenance
As corrective maintenance is a stochastic event, it cannot be planned in advance. The model sizes the maintenance structure (number of technician teams) to carry out preventive maintenance (PM) and fee collection. Once this is done, the remaining time in the working days is counted and compared with the time required for carrying out the corrective maintenance (CM). If the remaining time is not enough to guarantee the CM, it will be necessary to increase the number of technician teams. As regards corrective
Table 2 Input parameters.
nvr Number of villages in the rural community r e R . civr Element of a 0—1 matrix which is equal to 1 if village n e V
belongs to the rural community r e R and 0 otherwise. nshsv Number of SHSs in the village neV.
distrr Distance between the rural centres r,r' e R .
tdrr, Time needed for travelling between the rural centres r, r' e R.
dist'r Average of distances from the rural centre of the rural
community r e R to each of its villages neV.
td'r Average time for the displacements within the same rural
community r e R .
tas Time needed to attend to a solar home system.
br d Element of a 0— 1 matrix which is equal to 1 if there is a market
(souk) in the rural community r e R on day d e D and 0 otherwise.
tbr ¿ Time devoted to the market (souk) located in the rural
community r e R on day d e D .
numc Maximum number of vehicles available to be distributed between the local agencies.
dailyt Length of the technician's working day.
cmcr Cost for locating a local agency in the Capital of the rural
community r e R .
cncr Cost for assigning a team (vehicle and two technicians) to the
possible local agency located in the rural community r e R . ctr Travelling cost per unit of distance.
Table 3
Parameters calculated according to the inputs introduced.
nsysv
dist''
td'
Number of SHSs to be attended during the planning horizon (proportional part of the total SHSs to be visited), computed as nsysv = 2'ns/is„3^j
Average of distance assigned to an SHS in the rural community r e R , computed as dist'' = ^ ""'
Average time devoted to attending an SHS in the rural community r e R , (including travel time) computed as td" = tas
+-maintenance service is required in a certain village, as set out in the established quality service specifications, it must be carried out within 48 h, and all the preventive maintenance services scheduled in this village for the next few days will be carried out the day of the corrective maintenance, and other tasks should be rescheduled.
3.3. Criteria and objective function
The model is developed under the criterion, firstly, of giving a certain quality of maintenance service. Previous hypotheses are assumed in order to ensure that, with the resources available and the cost, it will be possible to carry out the maintenance operations with the degree of quality stipulated in the contract. Thus, these hypotheses and the service conditions will be included in the model as hard constraints (constraints that must be taken into account by any feasible solution). Then, the cost has to be mini-mised, assuming a fixed level of service. The total cost is made up of the cost of locating local agencies, the cost of teams (vehicles + technicians) and the cost of travelling:
• Costs related to the location of local agencies, such as renting offices, personnel resources and other operational costs (it in-cludes a fixed cost per province and a variable cost per number of local agencies established):
y ^ cmcrBLr
J2 mys
-• Costs related to the number of teams assigned to each local agency (it includes the annual fixed costs of the vehicle, such as insurance and maintenance, and the salaries and some expenses of the two technicians):
Y cncrNCRr reR
maintenance, the authors have published a previous paper [21 ] in which the reliability of the SHS components belonging to the PERG program has been achieved and the failure rate of every component is known in terms of percentage of devices that fail per unit time. The optimisation model will incorporate the corrective actions as part of the preventive maintenance just by adding the expected number of corrective actions to be carried out during the planning period corresponding to the schedule. For example, if a corrective
Table 4
Model variables. They represent the decisions to be taken.
BLr 0-1 variable which equals 1 if a local agency is located on the
rural community r e R and 0, otherwise.
BAr¡r 0-1 variable which equals 1 if a possible local agency located on
r e R goes to the rural community r ' e R and 0, otherwise. NCJ?r Number of vehicles assigned to the possible local agency located
in the rural community r e R
BRr r, d 0-1 variable which equals 1 if the rural community r' e R is
visited from the possible local agency located in the rural community r e R on day d e D and 0, otherwise.
NSJ?r, d Number of solar home systems in the rural community r' e R attended to on day d e D .
NCTrr, d Number of vehicles travelling to the rural community r' e R
from a possible local agency located in the rural community r e R on day d e D .
™r,i*,d Time spent in the rural community r' e R coming from the possible local agency located in the rural community r e R on day d e D .
• Costs related to travelling (fuel), made up of journeys covered from the local agencies to rural communities and from rural communities to villages:
2ctr Y Yl distrtfNCTrr,td + 2ctr Y Y dist¡,NSRr,d r . r ' e R d e D r e R d e D
Then, the objective function to be optimised is the aggregated sum of the previous costs:
Y cmcrBLr + Y cncrNCRr + 2ctr Y
r e R r e R r.r'eR
X Y distr,r'NCTr,r',d + 2ctr Y Yl dist'r'NSRr',d deD r e R d e D
3.4. Definition of constraints
The constraints defined must guarantee that the service is provided with a given level of quality and the schedule is robust enough to be adapted in real operations. Besides the assumptions included at the beginning of this section, two preventive mainte-nance visits are also made to each SHS per year. A proportional number of SHSs will be considered in the planning period model (in our case, two months D = 52 days).
Rural Community Centre.
Circles represent the
dist'r distance to the
villagesfnv,.).
Fig. 6. Assumed distribution of rural communities and villages.
1) At least one local agency must be located in the province:
J2
BLr > 1
2) Each rural community r ' e R must be visited from one and only one local agency.
Y,BA
r,r' = l , V r ' e R
reR
3) A rural community r ' s R is assigned to a possible local agency only if this is established, and, if so, it can be visited on day d e D.
BRrrd <BAr¡f <BLr, V r , r ' e R , d e D
4) If there is a souk on day d e D in the rural community r' e R, then it must be visited.
J2BRr,r,d > br-,d, V r ' e R , V d e D r e R
5) All the SHSs included in a rural community r ' e R and contem-plated in the planning horizon must be visited:
NCRr < numcBLr, V r e R
8) The number of vehicles used for displacements from one local agency to a rural community r' e R on day d e D is limited by the number of vehicles assigned to the local agency.
^2 NSRr,d = X^ av,rnsysv, V r ' e R
NCTrrd <NCRr, V r , r ' e R , V d e D
9) The time spent in the rural community r' e Ron day d e D is the maximum of the time spent in the souk and the time spent carrying out SHS maintenance. For rural communities where a local agency is located, it is not necessary to take the souk time into account since users are attended to directly by the local agency staff.
TMrr,d > tbrd(\ - BLr) - M ( l - BRrr,d), Vr, r ' e R , V d e D
TMrr,d > td'¡.NSRr, d-M(\ - BRrrd), Vr, r ' e R , V d e D
10) The time spent in the rural community r ' e R by all the ve-hicles sent there, plus the travelling time to the rural com-munity of all the vehicles (round-trip) must be less than the working day of the technicians.
TMr rd + 2tdvNCrr rd< dailyt NCTr r d, Vr, r1 e R , V d e D
6) On day d e D , the SHSs of a rural community r ' s R can be visited only if that rural community is visited on that day
NSRrd < ^2 avrnsysv ^ BRrr,d, V r e R , d e D
7) Vehicles can be assigned to a rural community if there is a local agency located in that rural community.
11) The total time spent on day d G D by the teams assigned to a local agency is at most the length of their workdays'.
J2 {tdrrNCTrr,d + TMrr,d) < dailytNCRr, V r e R , V d e D f e R
Table 5
Parameters for the rural communities in Azilal.
(R) Rural communities nsySy dist¡. (km) td'r (min)
0 1 2 3 4 5 6 7 8 9 10 11 12 13 14 15 16 17 18 19 20 21 22 23 24 25 26 27 28 29 Azilal (Capital) Afourer Agoudi N'lkhair Ait Abbas Ait Bououli Ait Mazigh Ait M'hamed Ait Taguella Ait Tamlil Anergui Beni Hassan Bin El Ouidane Bni A'yat Bzou Foum Jamaa Imlil Isseksi
Moulay Aissa Ben Driss Ouaouizeght Ouaoula Rfala Tabante Tabaroucht Tamda Noumarcid Tañante Taounza Tidili Fatouaka Tilougguite Timoulilte Zaouiat ahansal 22 124 361 22 80 1 8 43 3 10 23 80 19 3 8 55 10 71 18 1 5 66 90 2 16 8 349 9 302 22 0 4.1 7.5 8.3 11.1 6.9 13.0 6.0 12.8 10.5 6.1 6.8 6.4 8.2 5.3 5.4 7.8 6.9 5.3 8.1 7.5 10.3 5.9 7.3 6.9 5.9 5.0 12.0 4.1 16.7 0 8 15 17 22 14 26 12 26 21 12 14 13 16 11 11 16 14 11 16 15 21 12 15 14 12 10 24 8 33 0 2 9 6 5 3 1 5 12 2 1 1 8 1 2 2 3 2 3 6 1 1 2 6 1 3 2 12 3 11 1 (Thursday) 0 0 1 (Friday) 0 1 (Monday) 0 0 0 0 0 0 0 0 0 0 1 (Friday) 0 1 (Wednesday) 1 (Wednesday) 0 0 0 1 (Thursday) 1 (Tuesday) 0 0 1 (Saturday) 0 1 (Monday) Table 6
Time parameters for Azilal. These parameters are average values and have been provided by the ESCO ISOFOTON.
Time needed to attend to a solar home system (tas) 20 min Time devoted to the market located in the rural community (tbrd) 4 h Maximum time allowed in a working day (dailyt) 9 h
accelerate the process (although their sense is redundant) have been included. The model has been implemented in the GAMS algebraic modelling system, linked to the CPLEX optimiser, which uses a branch-and-cut procedure.
4. Model application
Table 7
Costs based on real expenses in 2010 in Azilal, considering associated costs, including other secondary expenses linked to the main concept (i.e. telephone and fax costs of the local agency).
Concept (comprising associated costs) Annual unit cost (€) Local agency
Agency head
Administrative employee O&M technician Vehicle (type: van) Vehicle (type: 4 x 4 )
Vehicle fuel consumption (€/100 km)
3521 6589 3068 4295 3462 6402 5.31 Table 8
Optimisation model results compared to the actual data for Azilal. Output parameters Model results ESCO real data Local Agency location
(BLr)
Vehicles (NO?r)
O&M technicians Local structure costs
(€/year) Travel costs (fuel)
(€/year) O&M annual cost (€)
R = 0 (1 local agency located in 1 local agency located in AZILAL) AZILAL 2 vehicles 2 vehicles
4 technicians 4 technicians
48,011 48,011
7257
55,268
8687
56,698
The model has been applied in three of the nine provinces of the PERG program: Azilal, Al Kalaa des Sraghnas and Ben Slimane. The results are compared to the real maintenance structure deployed by the ESCO and the real associated costs.
4.1. Example 1: Azilal
Tables 5—7 summarize the input parameters in the case of Azilal. Note that travelling time (td'r) corresponds to average values measured by the ESCO, ISOFOTON.
Other inputs are the distances (distV' expressed in km) and travel times (tdrr' expressed in minutes) between the different rural communities (R).
Table 8 summarizes the results of the optimisation of the model: The results show that both the model solution and ESCO real data are similar (O&M annual costs differ by 2.5%, which is not significant).
Table 9
Failure forecasting for the SHS components according to the reliability data in Azilal. The failure rate of batteries reaches the maximum during the sixth year. Batteries and charge controllers are replaced in the user dwelling while lamps are replaced in the souk.
Year
Batteries
Charge controllers
Total
1
8
12
20 2
62
39
101 3
186
62
248 4
286
62
348 5
369
62
431 6
397
62
459 7
361
62
423 8
305
62
367 9
272
51
323 10
278
24
302
Table 10
Optimisation model results compared to the actual data for Al Kalaa des Sraghnas. Output parameters
Local Agency location (BLr)
Vehicles (NO?r)
O&M technicians
Model results R = 18 (1 local agency located in JAAFRA) 3 vehicles 6 technicians Local structure costs 59,170
(€/year) Travel costs (fuel)
(€/year) O&M annual cost
(€)
13,413 72,583
ESCO real data 1 local agency located in BEN GUERIR
4 vehicles 8 technicians 66,875 23,280 90,155
maintenance is 20', around 153 h will be necessary, less than the 283 h available, according to the model results. For the other years during the maintenance period, the time available for CM will be even longer.
4.2. Example 2: Al Kalaa des Sraghnas
In the case of the province of Al Kalaa des Sraghnas, with 55 rural communities and 4396 SHSs, the results of the model optimisation are shown in Table 10, taking into account the same time param-eters as defined in Table 6:
First of all, the model has been applied by establishing the real configuration in the province (1 local agency located in Ben Guerir, 4 vehicles and 8 technicians), meaning a cost of €82,413 which represents 9% less than the overall cost of the ESCO. However, the model is able to find a better configuration if there is one, as is the case in this province.
The results of the model optimisation (without establishing any variables) indicate a lower annual maintenance cost of 19.5% with respect to the real ESCO data, due to the reduction of 1 maintenance team and the optimisation of the maintenance displacements, in addition to the relocation of the local agency (Fig. 7).
Stcoura Lhadra
C Jaafra j
' O u l a d Hassoune Hamri
P ayate
\
-Nzalat Laadam
)ui,;a.t*<P"
", y a Oulad Bo\ia« L'Ouad
Oulad Aam
M'ZerrfSanhaja
5¡d¡ Bou OtJipriane Timid
Jatdal
Ras Ain ftr
• Jouala
\ ^ Tamafo
Zeirírane tamna /
SkU
Ou
N . Chdara B<Mr'
Zemrane <\ frqia
' _ Assahrij
a O m a r
Oulad»
Í^ÍA;
lallouf
«3
Table 11
Failure forecasting for the SHS components according to the reliability study in Al Kalaa des Sraghnas. In the 5th, 6th and 7th year the failure rate of batteries reaches the maximum. Batteries and charge controllers are replaced in the user dwelling. Lamps are replaced in the souk.
Year
Batteries Charge controllers
Total
1
31 43 74
2 3
158 507 98 167 256 674
4
777
167 944
5 6 7
1,002 1,076 985 167 167 167 1,169 1,243 1,152
8
836
167
1,003 9
745 125
870 10
755
70 825
Table 12
Optimisation model results compared to the actual data for Al Kalaa des Sraghnas.
Output parameters Model results ESCO real data
Local Agency location (BLr) Vehicles (NO?r)
O&M technicians
Local structure costs (€/year) Travel costs (fuel) (€/year) O&M annual cost (€)
R = 1 (1 local agency located in AHLAF) 1 vehicle
2 technicians 29,012 1165 30,177
1 local agency located in BEN SLIMANE 1 vehicle
2 technicians 29,012 977 29,989
As regards the CM, there will be around 346 h per year available for corrective maintenance services. The highest number of corrective maintenance services will also take place during the sixth year (see Table 11). The number of corrective maintenance visits during the sixth year corresponds to 1076 batteries +167 charge controllers = 1243 CM services, around 414 h will be necessary, more than the time available, according to the model (346 h are enough to carry out 1040 CM services). As shown in Table 12, only the 5th, 6th and 7th years have more than 1040 CM services to be carried out, thus the maintenance structure calcu-lated by the model will be suitable for the remaining maintenance period. Just during these 3 critical years, it will be necessary to extend the number of maintenance teams from 3 to 4. This means that during these 3 years the costs of two technicians and 1 vehicle must be added to the cost structure, which has been considered in the resulting costs shown in Table 10.
4.3. Example 3: Ben Slimane
This province is made up of 8 rural communities and has 857 SHSs, the results of the model optimisation are shown in Table 12, taking into account the same time parameters as defined in Table 6: The results show that both the model solution and ESCO real data are very similar. Note that the model has moved the local agency.
As regards the CM, there will be around 195 h per year available for corrective maintenance services. The highest number of corrective maintenance services in this province will also take place during the sixth year. The number of corrective maintenance ser-vices during the sixth year corresponds to 212 batteries +34 charge controllers = 246 CM services. Around 82 h will be necessary, less than the 195 h available, according to the model results.
5. Conclusions
A special case study based on the Moroccan Photovoltaic Rural Electrification Program has been developed to illustrate the per-formance of an optimisation tool, based on a mixed integer linear optimisation model, intended to design maintenance structures in decentralised PVREs. The model has been formulated in accordance with the technical and O&M specifications of the Moroccan pro-gram, imposed by the local utility. These rules have determined
some of the constraints included in the optimisation model to ensure the operability and quality of maintenance service.
The purpose of the tool is to obtain an optimised maintenance structure in terms of number of technicians and vehicles and the best location for the local agencies, able to satisfy all the constraints defined, to guarantee the SHSs' maintenance service and the fee collection carried out in the local markets (souks).
The defined objective function must minimise the associated costs of:
- Location of local agencies - Vehicles and technicians
- Maintenance and fee collection journeys
The usefulness of the tool has been illustrated using three of the provinces belonging to the PERG program.
The results of the application show that, in two cases, the model solution matches the real ESCO data in these provinces, which suggests that the ESCO optimised the maintenance structure and costs in these cases. In the other province, the model has optimised the maintenance structure by reducing the number of maintenance teams by 1 (2 technicians and 1 vehicle) during 7 of the 10 years of the maintenance period; it has relocated the local agency to a better location and it has optimised the maintenance journeys. Thus, the cost of the O&M in this province has been reduced by 19.5%. This optimisation can be explained as this province has a high number of SHSs (4396 SHSs, one third of the total amount) it is intuitive to think that the organization of maintenance in this province was harder than in other provinces with far fewer SHSs (Ben Slimane had 857 and Azilal 1809). Therefore, it was expected that if the tool could provide a reduction in cost and structure, it would happen in this province.
Through these results, the potential usefulness of this tool to help ESCOs in the design of the maintenance structures in PVRE programs based on the knowledge of the reliability parameters of the SHSs and the operating costs has been shown.
with different kinds of technical features and management requirements.
Acknowledgements
The first author would like to thank Isofoton Maroc s.a.r.l., of which I was part of the management team during the first five years of development of the PERG program in Morocco, which have given me the opportunity to compile all the data and expertise necessary to carry out this work.
The authors would like to thank Marta Artalejo Alvarez, MSc, for her valuable collaboration.
This work has been partially supported by the Government of Spain, TIN2012-32482, and by the local Government of Madrid, grant S2013/ICE-2845 (CASI-CAM).
References
[ 1 ] Ouedraogo NS. Energy consumption and human development: evidence from a panel cointegration and error correction model. Energy 2013;63:28-41.
[2] Aklin M, Bayer P, Harish SP, Urpelainen J. Quantifying slum electrification in India and explaining local variation. Energy 2015;80:203-12.
[3] Balachandra P. Dynamics of rural energy access in India: an assessment. En-ergy September 2011;36(9):5556-67.
[4] Levin T, Thomas VM. Utility-maximizing financial contracts for distributed rural electrification. Energy 2014;69:613-21.
[5] Nerini FF, Broad O, Mentis D, Welsch M, Bazilian M, Howells M. A cost com-parison of technology approaches for improving access to electricity services. Energy January 2016;95(15):255-65.
[6] Johnson NG, Bryden KM. Energy supply and use in a rural West African village. Energy July 2012;43(l):283-92.
[7] IDCOL, [http://www.idcol.org/old/bd-map/bangladesh_map/], access in September 2016.
[8] Cabraal A. Experiences and lessons from 15 years of World Bank support for photovoltaics for off-grid electrification. In: 2nd international conference on the developments in renewable energy technology (ICDRET); January 2012. p. 1-4. Dakha (Bangladesh).
[9] Lemaire X. Off-grid electrification with solar home systems: the experience of a fee-for-service concession in South Africa. Energy Sustain Dev 2011;15(3): 2 7 7 - 8 3 .
[10] Lemaire X. Fee-for-service companies for rural electrification with photovol-taic systems: the case of Zambia. Energy Sustain Dev 2009;13(1):18—23.
[11] Tsikalakis A, Tomtsi T, Hatziargyriou ND, Poullikkas A, Malamatenios Ch, Giakoumelos E, et al. Review of best practices of solar electricity resources applications in selected Middle East and North Africa (MENA) countries. Renew Sustain Energy Rev 2011;15(6):2838-49.
121 Notton G, Muselli M, Poggi P. Costing of a stand-alone photovoltaic system. Energy 1998;23(4):289-308.
13] Qpaider L, Steinbrecht D. Photovoltaic systems: a cost competitive option to supply energy to off-grid agricultural communities in arid regions. Appl En-ergy 2010;87(2):427-35.
141 Azimoh CL, Klintenberg P, Wallin F, Karlsson B. Illuminated but not electrified: an assessment of the impact of Solar Home System on rural households in South Africa. Appl Energy October 2015;155:354-64.
151 Nieuwenhout FDJ, van Dijk A, Lasschuit PE, van Roekel G, van Dijk VAP, Hirsch D, et al. Experience with solar home systems in developing countries: a review. Prog. Photovolt. Res Appl 2001;9:455-74.
161 Linguet L, Hidair I. A detailed analysis of the productivity of solar home system in an Amazonian environment. Renew Sustain Energy Rev February 2010;14(2):745-53.
171 Lu M. AD HOC regionalism in rural development. Geogr Rev July 2011;101(Issue3):334-52.
181 Broceo A. Ad-hoc self-organized microgrid for rural electrification and post-disaster response. In: 2013 IEEE green technologies conference (GreenTech); April 2013. p. 3 1 5 - 2 1 . Denver, CO (USA).
191 Beasley JE. Advances in linear and integer programming. Oxford University Press; 1996.
201 Jamrani A. The Moroccan general rural electrification programme (PERG). In: Proceedings of the ISES 2000 utility initiative for Africa seminar: rural elec-trification in Africa, Midrand (South Africa); April 2000. p. 1 7 - 8 .
21] Carrasco LM, Navarte L, Peral A, Vázquez M. Reliability of a 13,000-SHS photovoltaic rural electrification program. Prog Photovolt. Res Appl 2013;21: 1136-45.
22] Carrasco LM, Narvarte L, Martínez-Moreno F, Moretón R. In-field assessment of batteries and PV modules in a large photovoltaic rural electrification pro-gram. Energy 2014;75:281-8.
23] Carrasco LM, Navarte L, Lorenzo E. Operational costs of A 13.000 solar home systems rural electrification program. Renew Sustain Energy Rev 2013;20: 1-7.
24] Rosenthal RE. Gams A User's Guide. Washington. DC. USA. Gams Development Corporation; 2014.
25] User's manual for Cplex. IBM ILOG; 2014.
26] Mitchell JE. Branch-and-cut algorithms for combinatorial optimization prob-lems, handbook of applied operations research. Oxford University Press; 2002. p. 6 5 - 7 7 .