Energy Yield Determination of Concentrator Solar Cells
Using Laboratory Measurements
John F. Geisz , Iván Garcia , William E. McMahon , Myles A. Steiner , Mario
Ochoa , Ryan M. France , Aron Habte and Daniel J. Friedman
Abstract. The annual energy conversion efficiency is calculated for a four junction inverted metamorphic solar cell that
has been completely characterized in the laboratory at room temperature using measurements fit to a comprehensive optoelectronic model of the multijunction solar cells. A simple model of the temperature dependence is used predict the performance of the solar cell under varying temperature and spectra characteristic of Golden, CO for an entire year. The annual energy conversion efficiency is calculated by integrating the predicted cell performance over the entire year. The effects of geometric concentration, CPV system thermal characteristics, and luminescent coupling are highlighted.
INTRODUCTION
Concentrator solar cells are typically designed for optimal performance under the AMI.5 direct spectrum at 25°C because this is a convenient condition for measurement and comparison. However, CPV power plant operators are more concerned about how much energy they can produce than the efficiency at some standard operating condition. The actual operating conditions of a concentrator solar cell continually vary throughout the day and year. Thus, to predict the energy yield of a specific solar cell in a specific CPV system at a specific location can be a rather daunting, but important task. The ambient conditions, temperature, spectrum, and irradiance at a location must be known as a function of time throughout a typical year. Moreover, the effect of these parameters on the CPV system (optics, cooling, etc) must be predicted in order to determine the actual operating conditions (temperature, irradiance, spectrum) of the solar cell receiver. Finally, the cell must be well characterized over a wide range of temperature, irradiance, and spectral balance in order to calculate the energy output. This paper presents an advanced model that accounts for all the solar cell processes and is able to predict the energy output. A 4-junction inverted metamorphic solar cell working at high concentration is used as an example. The ultimate goal of this work is to design multijunction solar cells to optimize energy yield rather than designing to a particular reference spectrum.
MODEL INPUTS
In order to predict the energy output of a CPV system, the operating conditions of the power-producing solar cell must be known. A fairly long set of varying parameters affect the operating conditions of the solar cell working in the field, including atmospheric parameters and CPV system characteristics. They can be summarized as:
1) Spectrum and irradiance of the light reaching the solar cell, which depend on atmospheric parameters such as the air mass (AM), aerosol optical depth (AOD) and precipitable water (PW), and also on the characteristics of the CPV system optics, which define the optical transmittance.
2) Solar cell temperature, which depends on the ambient temperature, irradiance, and thermal characteristics of the CPV cooling system, which in turn depends on the ambient wind speed and humidity.
3) Spatial uniformity of the light across the solar cell area, including irradiance uniformity and spectral uniformity. These are determined by the characteristics of the optics, tracking accuracy, etc. and the influence of the ambient parameters (mainly the temperature) on these.
In this work, 1) and 2) are considered. While the 1-D model presented does not account for spatial non-uniformities, it provides the parameters that can be fed into other models, such as advanced distributed models [1], to take into account the effect of non-uniform irradiances, chromatic aberration, etc.
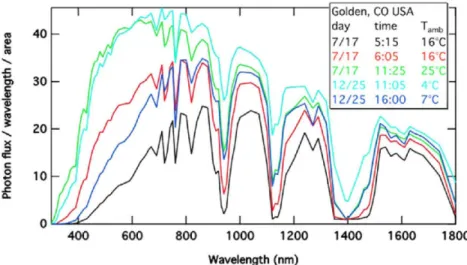
The prediction of the energy output at a site relies on the availability of representative annual data sets for the spectra, irradiance, temperature, etc., for the site, and the knowledge of the CPV system sensitivity to these parameters. In this work we focus on the prediction of the energy output once all these parameters are known. To test and illustrate the model and calculation procedures, we use a spectral dataset generated by the NREL resource assessment group using TMYspec model for Golden, CO USA over an example year (2013-2014), using broadband measured atmospheric data. The data is provided for the 320-1800 run spectral range, in 10 nm steps. A few representative spectra are shown in Fig. 1. One year of data is provided in 5 min steps, for daylight hours only, which gives around 40000 data points.
400 600 800 1000 1200 1400 1600 1800 Wavelength (nm)
FIGURE 1. Example spectra contained in the full annual spectral dataset used to illustrate the application of the model presented in this work.
As for the CPV system and its influence on the operating conditions of the solar cell receiver, the temperature of the cell is simplistically modeled as TceU = Tam^t + AT*DNI/1000. The optical transmittance of the optics and possible non-uniformities are neglected, as commented before. We note again that it is conceptually straightforward to add the details of more sophisticated CPV system characteristics to the model and calculations presented here.
MULTIJUNCTION SOLAR CELL ELECTRO-OPTICAL MODEL
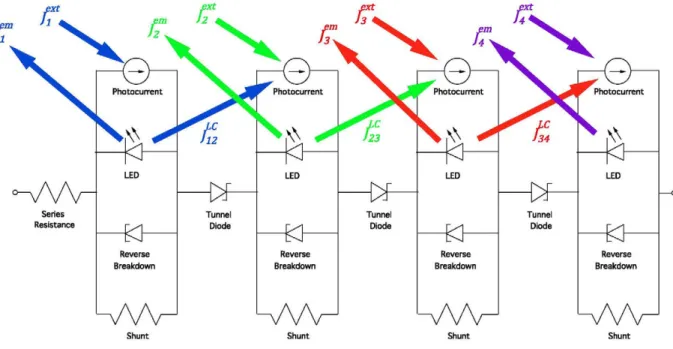
FIGURE 2. Schematic of equivalent optoelectronic circuit to describe series-connected 4 junction solar cells.
10
-E
o v
<
+ j
</>
c <u
Q
10¿
10°
-2
10
10
10
1 2 3 4
Voltage (V)
3.35
3.30
3.25
3.20
c a)
L -L_
3 O Ü
o
Q_
m c
^-^
M
E
< b '
0.001
g
° A A
-A
[A¿
' *
O O O0D O O O
around 0.7 suns
A
# . ' A
A
A' x *
£
M
:'
áAr , J r next
P^.** junction dark
_L _L
10"1 10° I O1 i oz i o3 i o4
2
Current Density (mA/cm )
0.0 0.5 1.0 1.5 2.0 2.5 Concentration on Junction 1, 2, 3, or 4 (Suns)
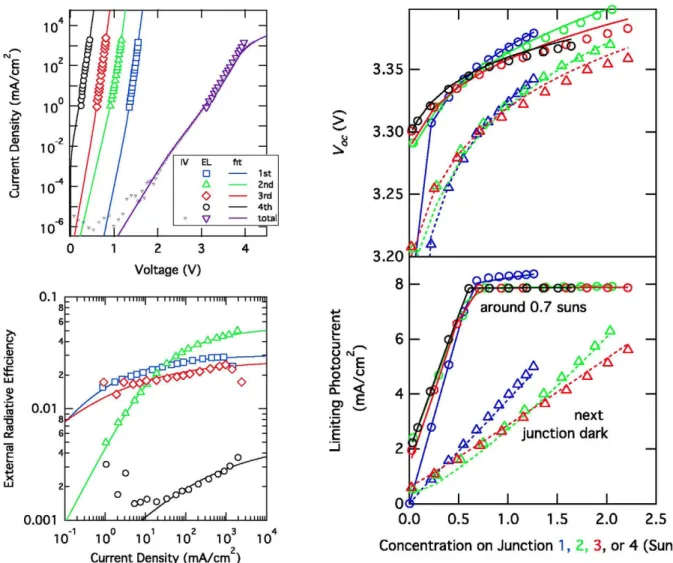
FIGURE 3. Characterization and fit (lines) of the measurements (markers) for the 4J solar cell used in this work (MM966An5). Left: dark IV measurement of the subcell in the 4J stack, obtained using electroluminescence measurements and corrected by luminescence coupling effects (top); external radiative efficiency obtained by quantitatively measuring the light emitted by the subcells and the total injected current (bottom). Right: measurement of cell parameters when varying the number of suns of external photocurrent on individual junctions while keeping the other junctions around 0.7 suns. For the "dark" measurements the next junction is kept in the dark. The top graph is the open circuit voltage and the bottom graph is the limiting photocurrent.
The effect of temperature is important when trying to predict the energy output of a CPV system. All the measurements that are carried out to generate the solar cell model can be repeated for a range of temperatures and, thus, generate a model that accounts for the temperature sensitivity of the solar cell performance. While conceptually straightforward, this can be time consuming. For this work we used a semiempirical method to predict the temperature dependence of the photocurrents and reverse saturation recombination currents of each junction. Available measurements on 3 J solar cells were used to validate the model which was then applied to the 4 J solar cell under study. The external photocurrent of each junction, Jfc, at different temperatures was obtained by first
calculating the EQE by shifting the band edges using Varshni equation [5], and then computing
Jfc = qjEQEi(A)cpillum(A)dA (1)
where <plllum is the site-specific spectral irradiance that varies with time. Figure 4(left) shows the result of applying
which relate the real values to the
,01 .on
recombination currents are calculated assuming that the ratios -^ and —l—r,
ideal Shockley-Queisser reverse saturation current (jfb), remains constant with temperature, over the temperature
range covered. Since the recombination currents are determined through empirical fitting at room temperature, and the temperature dependence of jfb is well known [6]
- " v l J h3c2 \kTj kT
e-Ef/kT
(2)
the evolution of/f1 and/fn with temperature can be predicted. Figure 4(right) shows that this model is reasonably accurate capturing the exponential variation with temperature.
I
125100 75 J L
E u if E
400 600 800 1000 Wavelength (nm)
1200 1400
1 0 0 0 / T ( K )
FIGURE 4. Comparison of modeled (lines) and measured (markers) temperature sensitive parameters of a 3 JIMM solar cell
(MM670nlO), Left: EQE and Right: recombination currents.
APPLICATION OF THE MODEL: CELL PERFORMANCE OVER TIME AND
ANNUAL ENERGY CONVERSION EFFICIENCY
The model parameters for the 4J solar cell were generated by fitting the data in Fig. 3 at room temperature and using the temperature dependent model described above. The cell performance was calculated at every point in time throughout the year with ambient conditions prescribed by the Golden spectral dataset. The results are shown in Fig. 5. In order to illustrate the effect of luminescence coupling, the same calculation is performed using the original solar cell parameters but artificially removing the luminescence coupling parameter. The top two graphs are scatter dot plots as a function of the externally induced photocurrents in the possible pairs of junctions in the 4 J solar cell, for each datapoint in the annual spectra set used. The color of the dots represents the energy conversion efficiency at each instant represented by each dot. First, it can be observed how the 1st junction (top cell) is the most sensitive to spectral variations with respect to the other junctions, as corresponds to the stronger impact of the AM and AOD in the higher photon energy region of the spectrum. The effect of the luminescence coupling is also evident: in the situations when a higher bandgap junction is over-illuminated, the solar cell efficiency is higher with luminescence coupling.
With luminescence coupling (as measured) Luminescence coupling removed
1 Is F
clear day summer! winter
- 4 4 3
1-36^5
5 10 13D 5 10 I D 5 10 15
June 1 June 2 June 3
External Photocurrent / C
4 . 5
4 . 0
3 . 5
3 . 0
2 . 5
1 0 0
9 0
8 0
7 0
6 0
4 5
4 0
3 5
3 0
2 5
6 0
4 0
2 0
0
2 0 1 0 0 0
8 0 0
6 0 0
4 0 0
2 0 0
0
-_ «—
\i
-1 ;
! •
V-:A
i -.&;
1' -..
• '• ' : J*Z
• '
i\ i
M
!
i 1
^
n
— i —
C = 933
h-i r
'
;suns limiting junction:
1 st 2nd 3rd 4th
uu
M
M
n
ifpN
/- /"
ambientA fl
V
ft
a
t" • \ ;.l¿; '
i -s , « f «. ( ;?.:
4-i 1 i •! T
|
V
1
-L
* T
; • -L
: | = T
-[-AT
+
T
T •.:•• T ,!. 1Ul
4-1 0 / 3 / 4-1 3 1 0 / 5 / 1 3 1 0 / 7 / 1 3
Date & Time
1 0 / 9 / 1 3 1 0 / 1 1 / 1 3 Q clear day summer winter 44 3 o - 40 a
P36>5 |L3 2
5 10 I D 5 10 1 D 5 10 15
June 1 June 2 June 3
External Photocurrent / C
4.5 4.0 3.5 3.0 2.5 100 90 80 70 60 45 40 35 30 + 25 T
•'•' H !
5 "
C = 933 suns limiting junction:
1st 2nd 3rd 4th
*'. T
l i H u u U ^ i W V
[ i •:
U
M M &
M
$
1 0 / 1 1 / 1 3
FIGURE 5. Predicted 4J IMM solar cell (MM966An5) performance for varying ambient conditions assuming C=933 sun
The annual energy conversion efficiency is calculated as
n
Annual Energy c^DNl 2 X (3)The energy conversion efficiency of the 4J solar cell for the Golden data set used was calculated for a range of geometrical concentrations, and at different operating temperature conditions. The result is shown in Fig. 6, together with the measurement of the cell at NREL in the THIPSS flash solar simulator.
1 T i T
n=2 n*2
- • AMI .5d STC - o - - _ (|_C removed)
" ' ambient
- (LC removed)
- AT = 40°C
- (LC removed)
— AT = 100°C
- O - _ _ (LC removed)
Y THIPSS data
Concentration (Suns)
FIGURE 6. Annual energy production efficiency of the 4 J solar cell for the Golden annual spectra set. The effect of different
operation temperatures, luminescence coupling are illustrated as well as the effect of assuming an ideality factor different to 2 for the recombination in the depletion region of the subcells. The conversion efficiency measured at NREL using a THIPSS flash solar simulator is also shown.
Some conclusions that can be drawn from Fig. 6 are:
1) The full cell model developed is suitable for predicting the flash data.
2) A model constrained to an ideality factor n=2 (as typically done) for the recombination in the depletion regions gives a different slope with concentration, and illustrates the improvement obtained with the new model presented here.
3) The luminescence coupling (LC) improves the energy efficiency by a significant factor. Its effect is higher at higher concentrations, where the n=l recombination dominates.
4) For the data set used, the results obtained for a cell temperature equal to the ambient temperature is very close to the result for the AM1.5d spectrum.
SUMMARY AND CONCLUSIONS
A model has been developed that accounts for the internal physical processes occurring in a multijunction solar cell. This facilitates accurate prediction of the annual energy production for any given location and operating condition. For the spectra set used as an example, corresponding to Golden 2013-2014, the annual energy conversion efficiency at ambient temperature is very close to obtained using the AM1.5d reference spectrum at standard testing conditions. We showed that the effect of elevated temperature is more important than the effect of spectral variations, and this effect might be mitigated if the solar cell was designed for operation at higher temperatures. Luminescence coupling is also shown to significantly boost the annual energy conversion efficiency and mitigates the spectral sensitivity of the solar cell. Future work include obtaining better dependencies of the cell performance with temperature, add CPV system specific variable temperature and spectral attenuations, and extend the model to take into account spatial non-uniformities caused by the optics.
ACKNOWLEDGMENTS
This work is supported by the U.S. Department of Energy under Contract no. DE-AC36-08-GO28308 with the National Renewable Energy Laboratory. I. Garcia holds an IOF grant from the People Programme (Marie Curie Actions) of the European Union's Seventh Framework Programme (FP7/2007-2013) under REA Grant Agreement no. 299878.
REFERENCES
1. I. Garcia, P. Espinet-González, I. Rey-Stolle, and C. Algora, "Analysis of Chromatic Aberration Effects in Triple-Junction Solar Cells Using Advanced Distributed Models," IEEE J. Photovolt., vol. 1, no. 2, pp. 219-224,2011.
2. J. F. Geisz, "Generalized Optoelectronic Model of Series-Connected Multijunction Solar Cells," IEEE J. of
Photovolt., vol. to be published.
3. I. Garcia, W. E. McMahon, M. A. Steiner, J. F. Geisz, A. Habte, and D. J. Friedman, "Optimization of Multijunction Solar Cells Through Indoor Energy Yield Measurements," IEEE J. Photovolt., vol. 5, no. 1, pp. 438-445, Jan. 2015.
4. R. M. France, J. F. Geisz, I. Garcia, M. A. Steiner, W. E. McMahon, D. J. Friedman, T. E. Moriarty, C. Osterwald, J. Scott Ward, A. Duda, M. Young, and W. J. Olavarria, "Quadruple-Junction Inverted Metamorphic Concentrator Devices," IEEE J. Photovolt, vol. 5, no. 1, pp. 432-437, Jan. 2015.
5. Y. P. Varshni, "Temperature dependence of the energy gap in semiconductors," Physica, vol. 34, no. 1, pp. 149-154, 1967.