Comparing the contribution of vocabulary breadth to IELTS and TOEFL reading cubtests
17
0
0
Texto completo
(2) Porta Linguarum. Nº 20, junio 2013. del TOEFL está más asociada a la riqueza léxica que la prueba del IELTS. Además se ha reflexionado sobre las consecuencias de los datos obtenidos. Palabras clave: riqueza léxica; poder predictivo; prueba de lectura IELTS; prueba de lectura TOEFL; estudiantes de inglés lengua extranjera.. 1. Introduction Vocabulary knowledge is no longer regarded as the Cinderella of language learning and teaching. Yet, Milton et al. (2008) indicate that fresh vocabulary research can still provide some contributions to the practice of language pedagogy. These researchers talk about several direct ways in which vocabulary research can contribute to the task of teaching and learning languages. Vocabulary research, according to Milton et al. (2008: 123–137), can help us (a) understand “how language is constructed, how it is learned, and how it is used in communication”, (b) “establish norms of progress and even standards of knowledge and performance”, (c) “understand and control language input”, and (d) select “appropriate methodologies and techniques to enhance progress and performance” of language learners. These potential roles of vocabulary research, as Akbarian (2010) suggests, might be the reason why researchers are motivated to investigate vocabulary from different novel perspectives. Though there are many studies conducted on the relation hip between vocabulary knowledge and different aspects of language proficiency, there is still an absence of studies exploring the extent to which vocabulary size contributes to the different language skills... (Stæhr, 2008: 139) and sub-skills (Alavi & Akbarian, 2012). More particularly, few studies try to link vocabulary breadth to high-stakes examinations, such as IELTS (Milton, 2009). As a matter of fact, Milton’s (2009) volume which is an update on issues in assessing vocabulary does not report any investigation exploring the comparative contribution of vocabulary breadth to the reading section of IELTS and TOEFL in foreign language situations. Given that, the current research reports the results of an empirical study, addressing the extent to which the size or breadth of vocabulary knowledge is associated with the reading subtests of these two widely used proficiency tests.. 2. Review. of the. Literature. Apparently, the association between vocabulary breadth and reading comprehension has been explored from two perspectives in the literature: Firstly, this issue is linked with the question of how many words in a text a language learner needs to know so as to comprehend that text adequately (Stæhr, 2008). Secondly, more empirical investigations have been reported on finding the mere relationship between vocabulary breadth and reading comprehension or skill. In essence, the studies on vocabulary breadth and reading skill exceed those related to the other skills. In accordance with the first line of research, Hu and Nation (2000) examined the relationship between text coverage, i.e. the percentage of running known words in the text, and reading comprehension for non-native speakers of English. The researchers showed that 98% text coverage (1 unknown word in 50) would be needed for most learners to comprehend a fiction text adequately.. 136.
(3) Is`haaq Akbarian and Seyyed Mohammad Alavi. Comparing the Contribution of Vocabulary.... Also, on the basis of the British National Corpus, Nation (2006) conducted a trialling of 14 most frequent 1,000 word-family lists and used them to detect what vocabulary breadth would be needed for unassisted comprehension of written and spoken English. Taking a lexical coverage of 98% of any text as the ideal coverage for unassisted comprehension, Nation states that a 8,000 to 9,000 word-family vocabulary is needed for comprehension of written text and a vocabulary of 6,000 to 7,000 for spoken text(p. 59). In line with the second perspective, more researches have been reported. For instance, Qian (1999) carried out an investigation on the relationship between vocabulary breadth, vocabulary depth, and reading comprehension of Chinese and Korean English learners. His results displayed high inter-correlations between these variables, ranging from 0.78 to 0.82. As a follow-up to this study, Qian (2002) conducted another study to conceptually validate the roles of breadth and depth of vocabulary knowledge in reading comprehension in academic settings using a heterogeneous sample of mixed first language backgrounds. He used a refined version of the depth-of-vocabulary-knowledge (DVK) test of Read (1995), reading for basic comprehension measure (TOEFL-RBC), a vocabulary size (VS) measure developed by Nation (1983), and a TOEFL vocabulary measure (VM). Qian showed that there were high inter-correlations between the scores on the DVK, VS, TOEFL VM, and TOEFL-RBC. A strong significant correlation was displayed between VS test and TOEFLRBC (r = 0.74, p < 0.01). Administering Vocabulary Levels Test (VLT), the Productive Version of the VLT, and a TOEFL test to 76 Iranian undergraduate students, Golkar and Yamini (2007) examined the relationship between active and passive vocabulary knowledge, and the learners’ proficiency level and reading comprehension ability. What is significant to our interest is that vocabulary size turned out to have a high and significant correlation with both proficiency levels and the reading comprehension ability. The correlation between their passive and active vocabularies and reading comprehension ability produced a coefficient of 0.75 and 0.80, respectively, with active vocabulary showing a higher index. The researchers attribute it to the fact that “passive knowledge takes much practice and experience in language to turn into active”, and conclude that language learners “with a higher active vocabulary have had a higher amount of practice in reading texts, too; hence their better reading comprehension ability” (p. 101). In a recent study, Zhang and Anual (2008) explored the role of vocabulary knowledge in reading comprehension with 37 year-4 secondary students in Singapore. They used VLT to measure students’ vocabulary knowledge in relation to the different measures, i.e. short answer questions and summary task, intended to test their reading comprehension. Vocabulary knowledge at the 2,000-word level and reading comprehension significantly (r = 0.423, p < 0.01) correlated together, while at the 3,000-word level, a strong significant correlation was produced for the short-answer questions (r = 0.848, p < 0.01). At the 5,000-word level, the correlation was not significant for the short-answer questions. However, no significant correlation was displayed for the summary task at any level. For this, the researchers suspect that different task formats might have affected comprehension performance. Stæhr (2008) investigated the relationship between vocabulary breadth and the reading skill, in addition to writing and listening of Danish learners of English from lower secondary education whose language skills were assessed as part of the national school leaving examination. Vocabulary size displayed a high correlation of 0.83 (p < .01) with reading comprehension, thus indicating the reading skill to be the most dependent on vocabulary size in that study. The researcher further found that the participants, knowing the most frequent. 137.
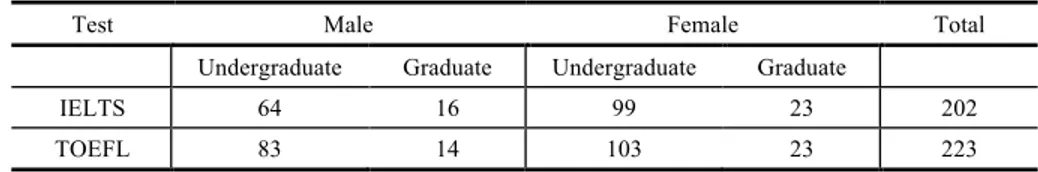
(4) Porta Linguarum. Nº 20, junio 2013. 2,000 word families, obtained a score above average on reading and the other two skills, while for those not mastering the most frequent 2,000 word families, “the picture was less clear” (Stæhr, 2008: 149). Whereas there are several investigations using the reading section of TOEFL, researchers have not conducted any studies, other than Milton, Wade, and Hopkins (2010), to correlate vocabulary breadth with the reading section of IELTS or to compare the importance of vocabulary breadth in these two widely used tests. Using 30 EFL learners as participants, Milton, et al. (2010) correlated two receptive vocabulary size measures, the X_Lex (Meara & Milton, 2003) and the A_Lex (Milton & Hopkins, 2005), with the IELTS test. They used Spearman correlations, producing a signicorrelate vocabulary with the reading section of IELTS to compare the the ficanttocoefficient of .699 forbreadth the relationship between vocabulary sizeor(the X_Lex) and importance of vocabulary breadth in these two widely used tests. reading component of IELTS. Actually, vocabulary size explains nearly 50 per cent of the Using 30 EFL learners as participants, Milton, Wade, and Hopkins (2010) correlated variance in the reading scores IELTS. the X_Lex (Meara & Milton, 2003) and the A_Lex two receptive vocabulary sizeofmeasures, A closer examination of the studies, in which role used of vocabulary reading com(Milton & Hopkins, 2005), with the IELTS test.theThey Spearman in correlations, prehension wasa investigated, shows that there paucity between of research in the size field.(the Since, producing significant coefficient of .699 for is thestill relationship vocabulary an understanding of reading this relationship essential to vocabulary the field and language education, X_Lex) and the componentisofquite IELTS. Actually, sizeinexplains nearly 50 per cent variance thethis reading scores of IELTS. this study is of anthe attempt toinfill particular gap. The above-cited studies, showing paucity of research in the area, merit another investigation into the role of vocabulary breadth for reading comprehension in two widely2.1. Research question used tests, i.e. TOEFL and IELTS reading subtests. The following question, therefore, guides our investigation:. The present study aimed to investigate the role of vocabulary breadth for reading comprehension in two widely-used proficiency tests, i.e. TOEFL and IELTS reading subtests. To 2.1. Research question this end, the following research question guided this investigation: Is there any thepredictive predictivepower power vocabulary breadth Is there anysignificant significantdifference difference between between the of of vocabulary breadth and the reading subtests of IELTS and TOEFL? and the reading subtests of IELTS and TOEFL? 3. METHOD Participants 3. M3.1. ethod There were 202 participating EFL students on IELTS and 223 on TOEFL from different. 3.1. Participants Iranian universities. They ranged from BA sophomores studying English literature to MA. students studying TEFL (Table 1). VLT was used to classify the participants into three There were 202 participating studentslevels. on IELTS and 223 TOEFL from different groups with different vocabularyEFL proficiency Classifying theon participants into three Iranian universities. They from BArank sophomores studying English literature to MA groups was based on ranged their percentile in the scores on VLT (discussed later). Experience sometimes degree does not show learners’into vocabulary students studyingshows TEFLthat (Table 1). VLT was used to classify the EFL participants three groups level. with knowledge different vocabulary proficiency levels. Classifying the participants into three groups. was based on their percentile rank in the scores on VLT (discussed later). Experience shows that sometimes degree does not show EFL learners’ vocabulary knowledge level. Table 1 Profile of the Participants Test. Table 1. Profile of the Participants. Male. Female. Undergraduate. Graduate. IELTS. 64. TOEFL. 83. Total. Undergraduate. Graduate. 16. 99. 23. 202. 14. 103. 23. 223. 3.2. Materials. 138. To conduct this research, three tests were administered: Vocabulary Levels Test, the reading section of IELTS (40 items), and the reading section of TOEFL (50 items): 3.2.1. Vocabulary Levels Test (VLT) Version 2 of VLT, revised and validated by Schmitt, Schmitt, and Clapham (2001), was used in this study. According to Nation (1990), the vocabulary of English (and indeed any.
(5) Is`haaq Akbarian and Seyyed Mohammad Alavi. Comparing the Contribution of Vocabulary.... 3.2. Materials To conduct this research, three tests were employed. They are Vocabulary Levels Test (VLT), the reading section of IELTS containing 40 items, and the reading section of TOEFL consisting of 50 items. 3.2.1. Vocabulary Levels Test (VLT) Version 2 of VLT, revised and validated by Schmitt, Schmitt, and Clapham (2001), was used in this study. According to Nation (1990), the vocabulary of English (and indeed any language) can be viewed as consisting of a series of levels based on frequency of occurrence. The levels contain groups of 1,000 words. So VLT measures knowledge of words at five levels: 2,000, 3,000, 5,000, 10,000, and Academic Vocabulary section that is not used since it is different in kind from the other levels and should not be included in the profile comparison (Schmitt et al., 2001). At each level, there are 10 three-item clusters (i.e., 30 items). Twenty four correct answers at a level is the criterion for its mastery (N. Schmitt, personal communication, May 9, 2008). With 88 participants, Stæhr (2008) calculated the Cronbach’s alpha of this version of VLT at 0.96. Interestingly enough, in the current study, Cronbach’s alpha on VLT at the four 1,000-, 3,000-, 5,000-, and 10,000-word frequency levels was also calculated at 0.963. The following is an example: 1 2 3 4 5 6. business clock horse pencil shoe wall. —— part of a house —— animal with four legs —— something used for writing. 3.2.2. IELTS Reading Subtest Lynda Taylor, an authority in the field, recommended the use of published practice materials (L. Taylor, personal communication, November 6, 2006) since live versions of IELTS reading are not released for research purposes. Given that, past exam papers from the reading section of Test 1, Cambridge IELTS 5 (2006: 16 28), were used. In this study, Academic Reading module was used. This module consists of three sections containing passages (with a total of 2,000 to 2,750 words), taken from magazines, journals, books, and newspapers. At least one passage contains detailed logical argument. 3.2.3. TOEFL Reading Subtest Genuine running TOEFL is not released either. Official practice tests and TOEFL actual tests (administered in the past by ETS) have been published. Therefore, the (pBT) reading section of January 2004 version (TOEFL ACTUAL TESTS, 2005: 25 35) was used for the sake of reliability and the lack of technological facilities in our context for iBT versions.. 139.
(6) Porta Linguarum. Nº 20, junio 2013. TOEFL reading subtest includes several passages (here five) with multiple-choice questions, between 250 and 350 words long, taken from college-level textbooks used in introductions to a discipline or topic. It is worth noting here that the reference to IELTS and TOEFL reading subtests throughout the current study is to a sample of IELTS and TOEFL tests used in Iran, not the real IELTS and TOEFL test. 3.3. Procedures and data analyses Willing and generous to respond, and informed of the purpose of the tests for research purposes, the participants answered the tests in separate sessions in the following order: VLT (30 min), TOEFL reading subtest (55 min), and IELTS reading subtest (60 min). The tests were administered in non-class periods. As a result, out of the original pool of 296 participants answering VLT, not all of them were able to respond to all the above instruments; some did not turn up in the session on TOEFL or IELTS for personal problems while some were unwilling to continue after answering VLT. Still, some others were unable to answer all the items on TOEFL and IELTS in due time. Therefore, they were excluded from the analysis, too. VLT was regarded as the independent variable and IELTS and TOEFL were taken as the dependent variables in their respective analyses. Linear regression analysis was performed to investigate the predictive power of vocabulary knowledge on the reading subtest of IELTS and TOEFL. To delve into the issue further, a series of linear regression analyses were conducted on the data to report the predictive values of vocabulary knowledge in IELTS and TOEFL reading subtests with regard to the overall performance of the participants on VLT and their performance on the four levels of word frequency bands (i.e., across levels). At this stage, the grouping into vocabulary proficiency levels was done based on the participants’ percentile rank for the scores they obtained on VLT. The overall alpha significance level was preset at p < .05 for all the analyses.. 4. Results The research question aims to answer whether there is any significant difference between the predictive power of vocabulary breadth and the reading subtest of IELTS and TOEFL, in answer to which the participants are first considered as one group, irrespective of the difference in their level among them, and then divided into three groups. Moreover, since there is difference in the number of the participants on IELTS and TOEFL, the study separately presents the results in the order of IELTS, TOEFL, and the comparison between these two tests. With respect to the overall performance of the participants on VLT as one composite variable, the descriptive statistics in Table 2 and 3 provide a general profile of the participants’ performance.. 140.
(7) between the predictive power of vocabulary breadth and the reading subtest of IELTS and between predictive powerthe of participants vocabulary breadth the reading subtest of irrespective IELTS and TOEFL, the in answer to which are first and considered as one group, TOEFL, in answer which participants are first one group, of the difference in to their leveltheamong them, and then considered divided intoasthree groups.irrespective Moreover, of thethere difference in theirinlevel then divided into three since is difference the among numberthem, of theand participants on IELTS and groups. TOEFL,Moreover, the study since therepresents is difference in the in number of the participants on IELTS TOEFL, the study separately the results the order of IELTS, TOEFL, and theand comparison between separately presents the results in the order of IELTS, TOEFL, and the comparison between these two tests. these tworespect tests. to the overall performance of the participants on VLT as one composite With With respect to the overall performance as one composite variable, the descriptive statistics in Tableof2 the andparticipants 3 provide on a VLT general profile of the variable, the descriptive statistics in Table 2 and 3 provide a general profile of the participants’ performance. participants’ performance. Is`haaq Akbarian and Seyyed Mohammad Alavi Comparing the Contribution of Vocabulary... Table 2 Table 2 Descriptive Statistics for the Reading Subtest of IELTS and VLT Table Statistics 2. Descriptive Statistics forof the Reading Descriptive for the Reading Subtest IELTS and VLT Subtest of IELTS and VLT. MPS MPS 40 40 120 120. IELTS reading subtest IELTS reading subtest VLT VLT. Mean Mean 22.63 22.63 76.79 76.79. Std. Deviation Std. Deviation 6.19 6.19 16.54 16.54. N N 202 202 202 202. Note: MPS = Maximum Possible Score Note: MPS = Maximum Possible Score Table 3 3. Descriptive Statistics forofthe Reading Subtest of TOEFL and VLT. TableTable 3 Descriptive Statistics for the Reading Subtest TOEFL and VLT Descriptive Statistics for the Reading Subtest of TOEFL and VLT MPS MPS 50 50 120 120. TOEFL reading subtest TOEFL reading subtest VLT VLT. Mean Mean 30.58 30.58 76.68 76.68. Std. Deviation Std. Deviation 8.93 8.93 16.42 16.42. N N 223 223 223 223. Note: MPS = Maximum Possible Score Note: MPS = Maximum Possible Score. Simple analysis waswas conducted to determine the predictive power of Simple ororlinear linearregression regression analysis conducted to determine the predictive power vocabularyknowledge, knowledge, as as captured captured inin VLT, VLT,ononIELTS IELTSreading readingsubtest. subtest.The Theresults resultsillusof vocabulary a moderate positive correlation between twovariables, variables, VLT tratedillustrated in Tablein4Table show4ashow moderate positive correlation between thethetwo VLT and and the reading subtest of IELTS. In the table of model summary for VLT and IELTS the reading subtest of IELTS. In 2 the table of model summary for VLT and IELTS reading reading subtest, R = 0.524, R = 0.271. This suggests that VLT and the reading subtest of subtest R = 0.524, R2 = 0.271. This suggests that VLT and the reading subtest of IELTS IELTS actually overlap one another to some extent: VLT has 27% explained variance in the actually overlap one another to some extent: VLT has 27% explained variance in the reading reading subsection of IELTS. subsection of IELTS. Table 4 Model Summary and IELTS Readingfor Subtest Tablefor4.VLT Model Summary VLT and IELTS Reading Subtest.. Model. 1. R. 0.524a. R Square. Adjusted R Square. Std. Error of the Estimate. 0 .274. 0 .271. 5.28243. Change Statistics R Square Change. F Change. Df1. df2. Sig. F Change. 0 .274. 75.619. 1. 200. 0.000. a. Predictors: (Constant), VLT b. Dependent Variable: IELTS reading subtest. To percentage of increase in the in independent variable and the resultant change To illustrate illustratethethe percentage of increase the independent variable and the resultant in the dependent variable, Table 5 shows that we obtained a = 7.591 for the intercept and b change in the dependent variable, Table 5 shows that we obtained a = 7.591 for the intercept = .196 for the slope. So, given the data, for each percentage of increase in VLT scores, the and b = 0.196 for the slope. So, given the data, for each percentage of increase in VLT scores on the reading subsection of IELTS change b (.196) units.. scores, the scores on the reading subsection of IELTS change b (0.196) units. Table 5 Coefficients. Model. 1. Unstandardized Coefficients B. Std. Error. (Constant). 7.591. 1.769. VLT. .196. .023. Standardized Coefficients. t. Sig.. 4.290. .000. 8.696. .000. Beta. .524. 141. a. Predictors: (Constant), VLT b. Dependent Variable: IELTS reading subtest. Similarly, linear regression analysis was used to analyze the data collected on TOEFL.
(8) 1. .524. .274. .271. 5.28243. .274. 75.619. 1. 200. .000. a. Predictors: (Constant), VLT b. Dependent Variable: IELTS reading subtest. To illustrate the percentage of increase in the independent variable and the resultant change in the dependent variable, Table 5 shows that we obtained a = 7.591 for the intercept and b = .196 for the slope. So, given the data, for each percentage of increase in VLT scores, the scores on the reading subsection of IELTS change b (.196) units. Porta Linguarum Nº 20, junio 2013 Table 5 Coefficients. Table 5. Coefficients. Model. (Constant). 1. VLT. Unstandardized Coefficients B. Std. Error. 7.591. 1.769. 0 .196. 0 .023. Standardized Coefficients. t. Sig.. 4.290. 0.000. 8.696. 0 .000. Beta. 0 .524. a. Predictors: (Constant), VLT b. Dependent Variable: IELTS reading subtest. Similarly, linear linearregression regressionanalysis analysis was used analyze collected on TOEFL Similarly, was used to to analyze the the datadata collected on TOEFL reading subtest. Table 6 shows,a amoderate moderate positive between the two reading subtest. As As Table 6 shows, positivecorrelation correlationexists exists between the two variables of VLT readingsubtest subtest of is, is, R =R0.546. The index seems to variables of VLT andand thethereading ofTOEFL. TOEFL.That That = 0.546. The index seems slightly higher higher than that of of IELTS above. The corresponding coefficient of determination to bebeslightly than that IELTS above. The corresponding coefficient of determi(adjusted R2),Rresulting from from Pearson correlation coefficient, is considerable: R2 = 0.295.R 2 = 2 ), resulting Pearson correlation coefficient, is considerable: nation (adjusted Likewise, it suggests that VLT and the reading subtest of TOEFL actually overlap one 0.295. Likewise, it suggests that VLT and the reading subtest of TOEFL actually overlap another to some extent: VLT can explain approximately 30% of the variance in the reading one Table another extent: VLT can explain approximately 30% of the variance in the 6 toofsome subsection TOEFL. reading subsection ofVLT TOEFL. Model Summary for and TOEFL Reading Subtest Table 6 Model Summary and TOEFL Reading Tablefor6.VLT Model Summary forSubtest VLT and TOEFL Reading Subtest. Change Statistics Std. Error R Adjusted Model R of the Square R Square R Square F Change df1 Statistics Estimate df2 Std. Error Change Change R Adjusted Model R of the Square R Square R Square F Estimate df2 1 .546a .298 .295 7.50037 .298 93.856 df1 1 221 Change Change. Sig. F Change Sig. F .000 Change. 0 .298 VLT 0 .295 0 .298 0 .000 .546a (Constant), 7.50037 93.856 1 221 a. 1Predictors: b. Dependent Variable: TOEFL reading subtest a. Predictors: (Constant), VLT The explained variance of vocabulary knowledge is 0.274 in IELTS reading subtest and b. Dependent Variable: TOEFL reading subtest. 0.298 in TOEFL reading subtest. The latter is 0.024 higher. However, the results on both Theexplained explained variance of vocabulary knowledge is of 0.274 in reading IELTS reading subtest The of vocabulary is 0.274 in IELTS tests show thatvariance vocabulary breadth hasknowledge a good prediction reading in both subtest IELTS and and and 0.298 0.298ininTOEFL TOEFL reading subtest. is higher. 0.024 higher. However, reading subtest. The The latter latter is 0.024 However, the resultstheonresults both on TOEFL. bothtests testsshow show vocabulary breadth a prediction good prediction of reading in bothand IELTS thatthat vocabulary breadth has ahas good of reading in both IELTS and TOEFL. TOEFL. Table 7 Coefficients Table 7 Coefficients. Table 7. Coefficients. Model. 1. Model (Constant) VLT (Constant). Unstandardized Coefficients Unstandardized B Std. Error Coefficients 7.797 B 0 .297 7.797. Std.2.405 Error 0 .031 2.405. Standardized Coefficients Standardized Beta Coefficients Beta 0 .546. t. Sig.. t 3.243. Sig. .001. 9.688 .000 3.243 .001 1 VLT .297 .031 .546 9.688 .000 a. Predictors: (Constant), VLT b. Dependent Variable: TOEFL reading subtest a. Predictors: (Constant), VLT InDependent like manners we further to understand the percentage of increase in the independent b. Variable: TOEFLtried reading subtest. 142. variable and the resultant change in the dependent variable. Table 7 shows that we obtained In manners triedand to understand the percentage in the independent a like = 7.797 for we the further intercept b = .297 for the slope. of So,increase given the data, for each variable and of theincrease resultantinchange the dependent variable.ofTable 7 shows thatscores we obtained percentage VLT in scores, the percentage increase in the on the areading = 7.797 for the of intercept = .297byfor the slope. data, for ofeach subsection TOEFLand goesb higher b (.297) units.So, Thegiven higherthepercentage the unit of slope this equation that percentage VLT has more predictive power in TOEFL percentage of in increase in VLTindicates scores, the of increase in the scores on the reading subsection subtest in comparison of IELTS. reading of TOEFL with goes that higher by b (.297) units. The higher percentage of the unit We of slope in this equation the indicates thatdata VLTwith hasregard more to predictive power in TOEFL now turn to analyzing collected the overall performance of reading subtest inoncomparison with performance that of IELTS. the participants VLT and their on its four levels of word frequency bands..
(9) Is`haaq Akbarian and Seyyed Mohammad Alavi. Comparing the Contribution of Vocabulary.... In like manners we further tried to understand the percentage of increase in the independent variable and the resultant change in the dependent variable. Table 7 shows that we obtained a = 7.797 for the intercept and b = 0.297 for the slope. So, given the data, for each percentage of increase in VLT scores, the percentage of increase in the scores on the reading subsection of TOEFL goes higher by b (0.297) units. The higher percentage of the unit of slope in this equation indicates that VLT has more predictive power in TOEFL reading subtest in comparison with that of IELTS. We now turn to analyzing the collected data with regard to the overall performance of the participants on VLT and their performance on its four levels of word frequency bands. In order to investigate the performance of the participants with different levels of vocabulary proficiency on the reading subtests of IETLS and TOEFL, it was decided to group the participants into levels of vocabulary knowledge, taking into account the performance of the participants on the frequency bands of VLT. So grouping was done based on the participants’ obtained score 32obtained and the on maximum was 119. Table 8rank shows the how percentile rank for on the VLT scoreswas they VLT. Aone learner’s percentile shows percentiles and the scores falling in the interval between the respective lower and the upper well he or she performs on a test in comparison to the others. On that basis, it was decided percentiles: to have percentiles for six equal groups, but then we converted the six groups into three for the reason that will be discussed below Table 8. The minimum obtained score on VLT was 32 and the maximum one was 119. Table 8 shows the percentiles and the scores falling in the interval between the respective lower and the upper percentiles: Table 8 Percentiles and Scores in the Respective Intervalsinonthe VLTRespective Intervals on VLT. Table 8. Percentiles and Scores. Percentile. 16.67th. 33.33th. 50th. 66.67th. 83.33th. 100th. Score. 32 – 56. 57 – 67. 68 – 76. 77 – 84. 85 – 94. 95 – 119. The forfor passing any of the frequency words is 24. It means Thecut-off cut-offscore score passing anytheoffour thelevels four of levels of the frequency words is 24. It thatthat a learner scoring 24 at any haslevel almost most frequent 1,000 words of1,000 means a learner scoring 24 level at any hasmastered almost the mastered the most frequent thatofparticular level. This assertion implies that a respondent acquiring one level of one VLTlevel words that particular level. This assertion implies that a respondent acquiring has also mastered the other levels lying beneath it. of VLT has also mastered the other levels lying beneath it. is not reasonabletotoexpect expect aa language thethe firstfirst most frequent 1,0001,000 It isIt not reasonable languagelearner learnermastering mastering most frequent words to attempt readingsubtests subtests of TOEFL. As As a result, care was words to attempt thethereading ofIELTS IELTSand and TOEFL. a result, careexercised was exercito take the second and forth percentile rank as the cut point for grouping and thus we sed to take the second and forth percentile rank as the cut point for grouping and thus we divided the participants into three groups: divided the• participants into three groups: Group 1 (henceforth, low group) with the percentile rank of 33.33th includes obtained scores from 32 to 67, i.e., including the first and the third most frequent. – Group1,000 1 (henceforth, lowunder group) percentile rank of 33.33th includes obtained words of VLT onewith jointthe level. scores from 32 to 67, i.e., including the first the third most frequent 1,000 words • Group 2 (henceforth, middle group) withand the percentile rank of 66.67th includes of VLT under scores one joint obtained fromlevel. 68 to 84. – Group 2Group (henceforth, middlehigh group) with the percentile rankabove of 66.67 includes ob• 3 (henceforth, group) includes scores falling the thpercentile of 66.67 i.e. to the84. obtained score 85 and above. tainedrank scores fromth, 68 – Group 3 (henceforth, high group) includes scores falling above the percentile rank The of descriptive Table 9 score and 1085 provide a general profile of the data with respect 66.67th, statistics i.e. the in obtained and above.. to proficiency levels based on percentile ranking. A quick inspection of the tables indicates that mean on both IELTS TOEFL subtests across of low,the middle, Thethe descriptive statistics in and Table 9 andreading 10 provide a increases general profile data with and tohigh groups onlevels VLT. based The implication is that vocabulary knowledge mightofexplain respect proficiency on percentile ranking. A quick inspection the tables different amounts of shared variance for each of these three groups. To explain for the increase on the mean of the scores on IELTS, the predictive values of VLT in terms of these three groups in accounting for the variance in IELTS reading subtest were 143 investigated further in a series of linear regression analyses (Table 11 and 12). As Table 11 reports, a weak relationship exists between IELTS reading subtest and VLT for the low group and high group, R = 0.350, 0.361, respectively. The respective corresponding coefficients of determination (adjusted R2) are reported as 0.123 and 0.130. But no significant relationship is reported for the results of the middle group between these two variables..
(10) Porta Linguarum. Nº 20, junio 2013. indicates that the mean on both IELTS and TOEFL reading subtests increases across low, middle, and high groups on VLT. The implication is that vocabulary knowledge might explain different amounts of shared variance for each of these three groups. To explain for the increase on the mean of the scores on IELTS, the predictive values of VLT in terms of these three groups in accounting for the variance in IELTS reading subtest were investigated further in a series of linear regression analyses (Table 11 and 12). As Table 11 reports, a weak relationship exists between IELTS reading subtest and VLT for the low group and high group, R = 0.350, 0.361, respectively. The respective corresponding coefficients of determination (adjusted R 2) are reported as 0.123 and 0.130. But no significant relationship is reported for the results of the middle group between these two variables. Descriptive Statistics for the Reading Subtest of IELTS and Percentile Levels of VLT Descriptive Statistics for the Reading Subtest IELTS and Percentile Levels VLT TableStatistics 9. Descriptive Statistics for theand Reading of Descriptive Statistics forthe theReading Reading Subtestofof of IELTS and PercentileSubtest Levelsofof ofVLT VLTIELTS Descriptive for Subtest IELTS Percentile Levels. Percentile Levels of VLT.. MPS MPS MPS IELTS reading subtest 40 MPS IELTS reading subtest 40 IELTS reading subtest 40 VLT low group 67 IELTS reading subtest 40 VLT low group 67 VLT low group 67 IELTS reading subtest 40 VLT reading low group 67 IELTS subtest 40 IELTS reading subtest 40 VLT middle group 84 IELTS reading subtest 40 VLT middle group 84 VLT middle group 84 IELTS readinggroup subtest 40 VLT middle 84 IELTS reading subtest 40 IELTS reading subtest 40 VLT high group 119 IELTS reading subtest 40 VLT high group 119 VLT high group 119 Note: MPS = Maximum Possible Score VLT high group 119 Note: MPS Maximum Possible Score Note:MPS MPS== =Maximum MaximumPossible PossibleScore Score Note:. Mean Mean Mean 18.70 Mean 18.70 18.70 57.33 18.70 57.33 57.33 22.76 57.33 22.76 22.76 75.99 22.76 75.99 75.99 26.01 75.99 26.01 26.01 95.10 26.01 95.10 95.10 95.10. Std. Deviation Std. Deviation Std.Deviation Deviation 4.32 Std. 4.32 4.32 8.06 4.32 8.06 8.06 5.65 8.06 5.65 5.65 4.70 5.65 4.70 4.70 6.19 4.70 6.19 6.19 8.06 6.19 8.06 8.06 8.06. and N N N N60 60 60 60 60 60 75 60 75 75 75 75 75 67 75 67 67 67 67 67 67. Table 10 Table 10 10. Descriptive Statistics for the Subtest of TOEFL TableTable 10 Statistics Descriptive for the Reading Subtest of TOEFL andReading Percentile Levels of VLT Table 10 Descriptive Statistics for the Reading Subtest of TOEFL and Percentile Levels of VLT Descriptive Statistics for the Reading Subtest of TOEFL and Percentile Levels of VLT and Percentile Levels of VLT. Descriptive Statistics for the Reading Subtest of TOEFL and Percentile Levels of VLT MPS Mean Std. Deviation N MPS Mean Std. Deviation N MPS Mean Std.Deviation Deviation N TOEFL reading subtest 50 24.59 7.87 69 MPS Mean Std. N TOEFL reading subtest 50 24.59 7.87 69 TOEFL reading subtest 50 24.59 7.87 VLT low group 67 58.03 7.51 69 TOEFL reading subtest 50 24.59 7.87 69 VLT low group 67 58.03 7.51 69 VLTlow lowgroup group 67 58.03 7.51 69 TOEFL reading subtest 50 31.10 7.20 83 VLT 67 58.03 7.51 69 TOEFL reading subtest 50 31.10 7.20 83 TOEFL reading subtest 50 31.10 7.20 VLT middle group 84 76.17 4.83 83 TOEFL reading subtest 50 31.10 7.20 83 VLT middle group 84 76.17 4.83 83 VLTmiddle middle group 84 76.17 4.83 83 TOEFL reading subtest 50 35.79 8.30 71 VLT group 84 76.17 4.83 83 TOEFL reading subtest 50 35.79 8.30 71 TOEFL reading subtest 50 35.79 8.30 VLT high group 119 95.41 8.58 71 TOEFL reading subtest 50 35.79 8.30 71 VLT high group 119 95.41 8.58 71 VLT high group 119 95.41 8.58 71 VLT high group 119 95.41 8.58 71 Note: MPS = Maximum Possible Score Note: MPS Maximum Possible Score Note:MPS MPS== =Maximum MaximumPossible PossibleScore Score Note: Table 11 Table 11 Table11 11 Model Summary for IELTS and VLTfor Based on Percentile GroupsBased on Percentile Groups. Table 11. Model Summary IELTS and VLT Table Model Summary for IELTS and VLT Based on Percentile Groups ModelSummary Summaryfor forIELTS IELTSand andVLT VLTBased Basedon onPercentile PercentileGroups Groups Model. 144. Model Model Model Model. Std. Change Statistics Adjusted Std. Change Statistics Std. of ChangeStatistics Statistics R Error R Adjusted Std. Change Adjusted R F Sig. F R Error R Adjusted R Error of Square Square theofof R Df1 df2 R F Sig. R Error R Square R Sig.FF F Change Change Square the Df1 df2 Square R Square FF Sig. the Estimate Df1 df2 Square Change Square Change Change Square the Square Df1 df2 Square Change Change Estimate Change a Square Estimate Change Low 1 0.350a 0.123 0.108 4.08381 Change 0.123 Change 8.113 1 58 Change 0.006 Estimate Low 1 0.350 0.123 0.108 4.08381 0.123 8.113 1 58 0.006 Low 0.350a aa 0.123 0.123 0.108 4.08381 0.123 8.113 58 0.006 0.006 Middle 0.066 0.004 -0.009 5.67804 0.004 0.315 73 0.576 Low 111 0.350 0.108 4.08381 0.123 8.113 11 58 a Middle 0.066 0.004 -0.009 5.67804 0.004 0.315 1 73 0.576 Middle 1 0.066 0.004 -0.009 5.67804 0.004 0.315 1 73 0.576 High 0.361a aa 0.004 0.130 0.117 5.81651 0.130 9.752 65 0.576 0.003 Middle 1 0.066 -0.009 5.67804 0.004 0.315 1 73 a High 11 0.361 0.130 0.117 5.81651 0.130 9.752 1 65 0.003 High 0.361 0.130 0.117 5.81651 0.130 9.752 1 65 0.003 a High 1 0.361 0.130 0.117 5.81651 0.130 9.752 1 65 0.003 a. Predictors: (Constant), VLT at low, middle, and high levels a. Predictors: (Constant), VLT low, middle, and high levels a.Predictors: Predictors: (Constant), VLTatat at low,middle, middle, andhigh highlevels levels Dependent(Constant), Variable: IELTS reading subtestand a.b. VLT low, b. Dependent Variable: IELTS reading subtest DependentVariable: Variable:IELTS IELTSreading readingsubtest subtest b.b.Dependent VLT VLT VLT VLT. R R RR. Table 12 reports the intercepts and the slopes for the low, middle, and high group of the Table 12 reports the intercepts and the slopes for the low, middle, and high group of the Table12 12reports reports thestudy. intercepts and the slopes forthe theor low, middle, andhigh high groupat the participants in our Thus,and forthe each percentage point of increase in group VLT Table the intercepts slopes for low, middle, and ofofeach the participants in our study. Thus, for each percentage or point of increase in VLT at each participants in our study. Thus, for each percentage or point of increase in VLT at each level of these three groups, the percentage of scores on IELTS reading subtest increases by participants in our study. Thus, for each percentage or point of increase in VLT at each level ofaccordingly. these three three groups, groups, the the percentage percentage of of scores scores on on IELTS IELTS reading reading subtest subtest increases increases by by level of these b units level of these three groups, the percentage of scores on IELTS reading subtest increases by b units accordingly. b units accordingly. b units accordingly. Table 12 Table 12 Table12 12 Coefficients Table Coefficients Coefficients Coefficients. Is'haaq! 3/6/13 8:40 Is'haaq! 3/6/13 8:40 Is'haaq! 3/6/138:40 8:40 Con formato: Color de fuent Is'haaq! 3/6/13 Con formato: Color de fuent Con formato: Colorde defuente fuent Is'haaq! 3/6/13Color 8:40 Con formato: Is'haaq! 3/6/13 8:40 Is'haaq! 3/6/13 8:40 Con formato: Color de fuent Is'haaq! 3/6/13 8:40 Con formato: Color de fuent Conformato: formato:Color Colorde defuente fuent Con.
(11) Is`haaq Akbarian and Seyyed Mohammad Alavi. Comparing the Contribution of Vocabulary... Table 12 reports the intercepts and the slopes for the low, middle, and high group of the Table 12 reports intercepts for theorlow, middle, and high VLT groupatofeach the participants in ourthestudy. Thus,and for the eachslopes percentage point of increase Table 12 reports the intercepts slopes for the middle, in high group of participants our study. forand eachthe percentage pointlow, of increase inand VLT at each level of theseinthree groups,Thus, the percentage of scores onorIELTS reading subtest increases by the participants our groups, study. Thus, for eachofpercentage or point of increase in VLT at level theseinthree the percentage scores on IELTS reading subtest increases by each b unitsofaccordingly. levelbof these three groups, the percentage of scores on IELTS reading subtest increases by units accordingly.. b units accordingly. Table 12 Table 12 Coefficients Coefficients. Table 12. Coefficients. Model Model. 1 1 1 1 1 1. (Constant) (Constant) VLT low group VLT low group (Constant) (Constant) VLT middle group VLT middle group (Constant) (Constant) VLT high group VLT high group. Unstandardized Unstandardized Coefficients Coefficients B Std. Error B Std. Error 7.926 3.819 7.926 3.819 .188 .066 0 .188 0 .066 16.768 10.697 16.768 10.697 .079 .141 0 .079 0 .141 -.377 8.481 8.481 -0-.377 .278 .089 0 .278 0 .089. Standardized Standardized Coefficients Coefficients Beta Beta .350 0 .350 .066 0.066 .361 0 .361. t t. Sig. Sig.. 2.075 2.075 2.848 2.848 1.568 1.568 .561 0 .561 -.044 -0-.044 3.123 3.123. .042 0.042 .006 0 .006 .121 0 .121 .576 0 .576 .965 0 .965 .003 0 .003. a. Predictors: (Constant), VLT at low, middle, and high levels a. Predictors: VLT at low, middle, b. Dependent (Constant), Variable: IELTS reading subtest and high levels b. Dependent Variable: IELTS reading subtest. Likewise, the predictive values of VLT in terms of these three groups in explaining the Likewise, predictive values of VLT in also terms of these three groups explaining the variance inthe TOEFL reading subtest further in groups ainseries of explaining linear Likewise, the predictive values ofwere VLT in investigated terms of these three in variance in TOEFL reading subtest were also investigated further in a series of linear regressioninanalyses and 14). Asalso Table 13 reports,further there is significant the variance TOEFL (Table reading13subtest were investigated in no a series of linear regression analyses (Tableand13theand 14). subtest As Table 13 reports, is no significant relationship between VLT reading of13TOEFL for there thethere lowisand middle group relaregression analyses (Table 13 and 14). As Table reports, no significant relationship between VLT and the high reading subtest TOEFL forreported the low is andmoderate middle group of participants. However, forreading the group, theof relationship (R = of tionship between VLT and the subtest of TOEFL for the low and middle group of participants. However, for the group, relationship reported is moderate = 457, p < .01). Therefore, more thanhigh 20 per centthe of the shared variance (adjusted R22) in(Rthe participants. However, for the high group, the relationship reported moderateR (R =the 457, p 457, p <subtest .01). Therefore, more than 20 per the shared varianceis(adjusted ) inhigh reading of TOEFL is accounted forcent by of vocabulary knowledge alone 2for the < .01). Therefore, than 20 per cent offorthe variance (adjusted R for ) inthe thehigh reading reading subtest more of TOEFL is accounted by shared vocabulary knowledge alone group. subtest of TOEFL is accounted for by vocabulary knowledge alone for the high group. group.. VLT VLT. Model Model. Table 13 Table Model13 Summary VLT Basedfor on Groups Table for 13.TOEFL ModelandSummary TOEFL and VLT Based on Groups. Model Summary for TOEFL and VLT Based on Groups. R R. Low Low Middle Middle High High. 1 1 1 1 1 1. 0.104aa .104 0.163aa .163 0.457aa .457. R R Square Square. Adjusted Adjusted R R Square Square. 0.011 .011 0.027 .027 0.209 .209. -0-.004 -.004 0.015 .015 0.198 .198. Std. Std. of Error Error the of the Estimate Estimate 7.88432 7.88432 7.14893 7.14893 7.43879 7.43879. R R Square Square Change Change 0 .011 .011 0 .027 .027 0.209 .209. Change Statistics Change Statistics F Df1 df2 F Change Df1 df2 Change 1 67 0.736 .736 1 67 2.222 1 81 2.222 1 81 18.246 1 69 18.246 1 69. Sig. F Sig. F Change Change 0.394 .394 0.140 .140 0.000 .000. a. Predictors: (Constant), VLT at low, middle, and high levels a. Predictors: VLT atreading low, middle, b. Dependent (Constant), Variable: TOEFL subtestand high levels b. Dependent Variable: TOEFL reading subtest. 145.
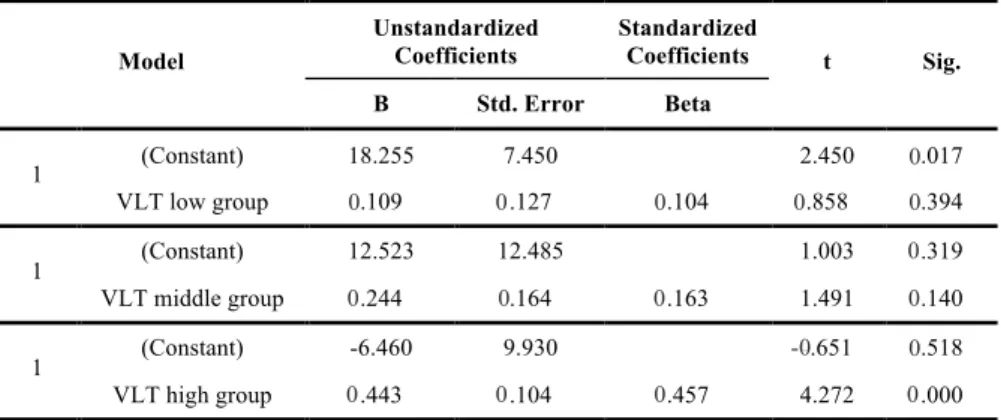
(12) Porta Linguarum. Nº 20, junio 2013. Similar to IELTS reading subtest, the percentage or point of scores on TOEFL reading Similarincreases to IELTS percentage or point of scores on TOEFL subtest byreading b units subtest, for each the percentage or point of increase in VLT for eachreading of subtest increases by bin units for each percentage point of levels increase in 14). VLT for each of these three groups proportion to their vocabularyor proficiency (Table. these three groups in proportion to their vocabulary proficiency levels (Table 14). Table 14 Coefficients. Table 14. Coefficients. Unstandardized Coefficients. Model. 1. 1. 1. Standardized Coefficients. B. Std. Error. (Constant). 18.255. 7.450. VLT low group. 0.109. 0 .127. (Constant). 12.523. 12.485. VLT middle group. 0 .244. 0.164. (Constant). -6.460. 9.930. VLT high group. 0 .443. 0 .104. t. Sig.. 2.450. 0.017. 0.858. 0.394. 1.003. 0 .319. 1.491. 0.140. -0-.651. 0.518. 4.272. 0 .000. Beta. 0.104. 0 .163. 0 .457. a. Predictors: (Constant), VLT at low, middle, and high levels b. Dependent Variable: TOEFL reading subtest. Overall, 202 participants answered IELTS reading subtest and 223 participants responded Overall, 202 participants answered IELTS reading subtest and 223 participants responded to TOEFL reading subtest. However, as Table 15 shows, only 188 of these participants to TOEFL reading subtest. Table 15 shows,subtests. only 188 of these participants were able to take both However, IELTS andasTOEFL reading Table 15 also shows thewere able descriptive to take both IELTS and TOEFL reading subtests. Table 15 also shows the descriptive statistics for VLT and the reading subtests of IELTS and TOEFL. With 188 statistics for VLT subtests of IELTS and TOEFL. With 188 participants forand the the tworeading tests, the respective correlations and effect sizes areparticipants 0.495 and for the two tests, the respective correlations effectand sizes areand 0.495 andbetween 0.245 between 0.245 between VLT and IELTS readingand subtest, 0.570 0.325 VLT and VLT TOEFL reading reading subtest, subtest (Table 16). The show VLT one more that reading VLT hassubtest a and IELTS and 0.570 andeffect 0.325sizes between and time TOEFL slightly moreeffect predictive in TOEFL reading i.e. has therea isslightly .08 permore cent higher (Table 16). The sizesrole show one more time subtest, that VLT predictive variance between VLT and subtest. role shared in TOEFL reading subtest, i.e. TOEFL there isreading 0.08 per cent higher shared variance between. VLT and TOEFL reading subtest. Table 15. Table 15. Descriptive Statistics for VLT andofReading Descriptive Statistics for VLT and Reading Subtests IELTS andSubtests TOEFL of IELTS and TOEFL. MPS Mean Std. Deviation Table 15 IELTS reading 40 22.90and TOEFL 6.17 Descriptive Statistics forsubtest VLT and Reading Subtests of IELTS TOEFL reading subtest 50 31.93 7.80 MPS Mean Std. Deviation IELTS reading subtest 40 22.90 6.17 VLT 120 77.12 16.04 TOEFL reading subtest 50 31.93 7.80 VLT 120 77.12 16.04 Note: MPS = Maximum Possible Score Note: MPS = Maximum Possible Score. N 188 188 N 188 188 188 188. Table 16 Table 16 Correlations and Effect Sizes for VLT and Reading Subtests of IELTS and TOEFL VLT. 146. R. R2. Sig.. IELTS. .495. .245. .000. TOEFL. .570. .325. .000. As to the performance on both IELTS and TOEFL reading subtests across groups, the descriptive statistics in Table 17 provide a general profile of the data and Table 18 shows the correlations and the effect sizes of the three groups with different vocabulary proficiency levels..
(13) Table Table 15 15 Descriptive Descriptive Statistics Statistics for for VLT VLT and and Reading Reading Subtests Subtests of of IELTS IELTS and and TOEFL TOEFL. IELTS IELTS reading reading subtest subtest TOEFL TOEFL reading reading subtest subtest VLT VLT. MPS MPS 40 40. Mean Mean 22.90 22.90. Std. Std. Deviation Deviation 6.17 6.17. N N 188 188. 50 50 120 120. 31.93 31.93 77.12 77.12. 7.80 7.80 16.04 16.04. 188 188 188 188. Is`haaq Akbarian and Seyyed Mohammad Alavi. Comparing the Contribution of Vocabulary.... Note: Note: MPS MPS = = Maximum Maximum Possible Possible Score Score. Table 16. Correlations and Effect Sizes for VLT and Reading. Table Table 16 16 Subtests of IELTS and of TOEFL.and TOEFL Correlations and Correlations and Effect Effect Sizes Sizes for for VLT VLT and and Reading Reading Subtests Subtests of IELTS IELTS and TOEFL VLT VLT 2 R R2. R R 0.495 .495. IELTS IELTS TOEFL TOEFL. Sig. Sig. 0 .000 .000. 0.245 .245 0.325 .325. 0 .570 .570. 0.000 .000. As As to to the the performance performance on on both both IELTS IELTS and and TOEFL TOEFL reading reading subtests subtests across across groups, groups, the the As to the performance on both IELTS and TOEFL reading subtests across descriptive statistics in Table 17 provide a general profile of the data and Table shows descriptive statistics in Table 17 provide a general profile of the data and Table 18 18groups, shows the descriptive statistics and in Table 17 provide a general profile of the and Table 18 shows the the sizes the groups with different vocabulary the correlations correlations and the effect effect sizes of of the three three groups withdata different vocabulary proficiency levels. the correlations and the effect sizes of the three groups with different vocabulary proficiency proficiency levels.. levels.. Table Table 17 17 Descriptive Descriptive Statistics Statistics for for VLT VLT and and Reading Reading Subtests Subtests of of IELTS IELTS and and TOEFL TOEFL. Table 17. Descriptive Statistics for VLT and Reading Subtests of IELTS and TOEFL.. IELTS IELTS reading reading subtest subtest TOEFL reading reading subtest subtest TOEFL. MPS MPS 40 40. Mean Mean 19.20 19.20. Std. Std. Deviation Deviation 4.05 4.05. 50 50 67 67. 26.41 26.41 58.06 58.06. 5.93 5.93 8.06 8.06. 40 40 50 50. 22.83 22.83 32.07 32.07. 5.76 5.76 6.50 6.50. 84 84 40 40. 76.10 76.10 26.21 26.21. 4.76 4.76 6.37 6.37. 50 50 119 119. 36.56 36.56 94.92 94.92. 7.62 7.62 8.23 8.23. VLT VLT low low group group IELTS reading reading subtest subtest IELTS TOEFL TOEFL reading reading subtest subtest VLT middle VLT middle group group IELTS IELTS reading reading subtest subtest TOEFL TOEFL reading reading subtest subtest VLT high group VLT high group. N N 54 54 54 54 54 54 72 72 72 72 72 72 62 62 62 62 62 62. Note: Note: MPS MPS = = Maximum Maximum Possible Possible Score Score. Table 18. Correlations and Effect Sizes for VLT and Reading. Table 18 of IELTS and TOEFL Groups. Correlations and EffectSubtests Sizes for VLT and Reading Subtests ofacross IELTS and TOEFL across Groups Low Group. Middle Group. VLT R. R2. IELTS. 0.240. TOEFL. 0.180. Reading Subtest. High Group. VLT Sig.. R. 0.058. 0.040. 0.060. 0.032. 0.096. 0.115. R2. VLT R2. Sig.. 0.378. 0.143. 0.001. 0.450. 0.203. 0.000. Sig.. R. 0.004. 0.309. 0.013. 0.169. Note: Sig. = Sig. (1-tailed), R = correlation, and R2 = effect size. Table 18 shows that there is a significant, but weak, correlation between VLT and IELTS reading subtest for low group, and there is a significant relationship between VLT and the reading section of IELTS and TOEFL for high group. The effect sizes reported for high group show more predictive role of VLT in TOEFL reading subtest, however. It seems that 147 the necessity of knowing 5,000 word families as the threshold for having an adequate understanding of the passage content is confirmed by the results in this investigation. 5. DISCUSSION This research focuses on whether vocabulary breadth provides more contribution to the reading subtest of IELTS or TOEFL. The first set of data analyses was reported on VLT and IELTS reading subtest above, showing a significant and moderate correlation between.
(14) Porta Linguarum. Nº 20, junio 2013. Table 18 shows that there is a significant, but weak, correlation between VLT and IELTS reading subtest for low group, and there is a significant relationship between VLT and the reading section of IELTS and TOEFL for high group. The effect sizes reported for high group show more predictive role of VLT in TOEFL reading subtest, however. It seems that the necessity of knowing 5,000 word families as the threshold for having an adequate understanding of the passage content is confirmed by the results in this investigation.. 5. Discussion This research focuses on whether vocabulary breadth provides more contribution to the reading subtest of IELTS or TOEFL. The first set of data analyses was reported on VLT and IELTS reading subtest above, showing a significant and moderate correlation between the two tests. This finding corroborates the result obtained by Milton, Wade, and Hopkins (2010) who found a strong relationship between a vocabulary breadth test and IELTS reading component. Our results also show that there is a significantly moderate relationship between VLT and TOEFL reading subtest, thus being in line with Qian (1999, 2002). Generally speaking, the results on both tests so far support the contention that vocabulary knowledge has a predictive role in reading comprehension (Qian, 1999, 2002; Zhang & Anual, 2008). The second set of data analyses concerns the results across groups that are worth noting. There is a significant correlation between VLT and IELTS reading subtest for low and high group whereas no significant relationship was observed between the two tests for middle group. How is it that there is a predictive relationship between vocabulary proficiency and the reading comprehension of IELTS for the participants in low group and high group, but not for the participants in middle group? The participants in middle group have passed the threshold of 3,000 most frequent words and even know more words than the participants in low group do. But it seems that they do not rely much on vocabulary knowledge in reading comprehension of IELTS. Apparently, the other knowledge sources are helpful to this group in comprehending IELTS reading subtest. Another interpretation might be that the participants in middle group have not developed a lot of vocabulary knowledge so as to perform well on reading comprehension. Inspecting the obtained scores (Table 8), lying in the interval between percentile scores, reveals some important points in relation to vocabulary growth and distribution of scores around the mean on VLT; the minimum obtained score and the maximum obtained score on VLT are 32 and 119, respectively and the mean on VLT is 77 (rounded). Logically, in normally distributed scores, the obtained scores will cluster around the mean. So the conclusion is that the range of obtained scores within an interval farther from the mean is larger than the range of the obtained scores in the intervals adjacent to the mean. Table 8 shows the range of obtained scores in the interval between the six percentile ranks as 24, 10, 8, 7, 9, and 34. Three percentile ranks were selected for dividing the participants into three groups with the following range of the scores falling in their intervals: 35, 16, and 34. The participants in middle group had a range of 16 points. If we remember that the lowest score was 68 and the highest 84, then it indicates that the participants falling within this interval of obtained scores might know around 4,000 most frequent words. If this is the case, then a low increase of the mean on IELTS reading subtest is justifiable. The participants at this level have not improved their vocabulary proficiency so much so as to perform better on reading comprehension.. 148.
(15) Is`haaq Akbarian and Seyyed Mohammad Alavi. Comparing the Contribution of Vocabulary.... Table 12 shows these issues very clearly. As displayed, for one standard deviation of change in the variable of vocabulary knowledge in middle group, there is a change of 0.066 of a standard deviation in the performance on IELTS reading subtest, i.e. vocabulary breadth contributes less to IELTS reading subtest. The change is much higher for low and high group. In these groups, for one standard deviation of change in the variable of vocabulary knowledge, there is respectively a change of 0.350 and 0.361 of a standard deviation in the performance on IELTS reading subtest. In other words, vocabulary breadth contributes more to IELTS reading subtest. The small increase on the predicted score in IELTS reading subtest for middle group is a good evidence for the important role of vocabulary knowledge in reading comprehension in general and IELTS reading subtest in particular. The results reported in the reading subtest of TOEFL (Table 13 and 14) indicate a different story. There is no significant relationship for low and middle groups. However, the participants in high group, correctly answering 80 per cent of the items at the 5,000 level of word frequency on VLT, seem to benefit more from vocabulary knowledge in answering reading comprehension items on TOEFL. There is a moderate relationship between the two variables of vocabulary breadth and reading comprehension, R = 0.457. If we square this correlation to see how much of the variance it accounts for, then one conclusion should be that vocabulary breadth alone accounts for about 0.209 of the factors involved in the reading comprehension of TOEFL. When we think of all the other factors that could be involved in reading comprehension grammatical knowledge, knowledge of discourse, background knowledge, an understanding of how texts are organized, skill in reading, writing, etc., and fluency then 20.9 per cent shared variance for vocabulary knowledge alone is very substantial. It is interesting to note that the accounted variance in TOEFL reading subtest is 0.079 higher than that of IELTS reading subtest for the participants in high group. One reason might be the existence of an item that measures guessing the meaning of vocabulary from contextual information in the edition of TOEFL reading subtest that was administered in our study. Or it might be due to the fact that IELTS reading is more task-based in comparison to TOEFL reading. In addition, our findings across groups indirectly support the first line of research that links a connection between the percentage of running words in a text and reading comprehension (Hu & Nation, 2006; Nation, 2006). That is, the more vocabulary the readers know, the more running words in a text will be familiar to them. This proficiency, in turn, leads to a better processing and comprehension of texts. Since the passages in IELTS and TOEFL reading cover a range of texts, some of which are more or less similar to those found in novels and newspapers, then here it might seem proper to link the outcome of our study to a number of the other findings by the recent study of Nation (2006), referred to in the review of literature. This authority on vocabulary research estimates that a vocabulary of 8,000 to 9,000 words is needed to read a novel, and even then, 1 word in 50 will be unfamiliar and that the 2,000 most frequent words in the BNC account for about 83% of the running words in newspapers. Also the most common 4,000 words plus proper nouns account for about 95% of the running words in a page of a newspaper. Thus, to gain an unassisted comprehension of newspapers, i.e. 98% coverage, a vocabulary of at least 8,000 words plus proper nouns is needed (Nation, 2006: 71). Consequently, only our high group might resort less to dictionaries and might encounter less frustration in trying to gain an unassisted comprehension in reading newspapers or novels.. 149.
(16) Porta Linguarum. Nº 20, junio 2013. Similarly, the results across groups also support what Nation and Waring (1997) stated over a decade ago. They argue that a small number of English words, such as the, occur very frequently and knowing them equals to knowing a very large proportion of the running words in a written or spoken text. Since most of such words are content words, therefore knowing enough of them leads to a good degree of comprehension of a text. A further confirmation of our results across groups comes from the finding by Golkar and Yamini (2007) who argue that vocabulary size is highly correlated with both proficiency level and reading comprehension ability. The final set of analyses conducted is concerned with comparing whether IELTS reading subtest or TOEFL reading subtest was more related to VLT. Remember that only 188 of all the participants had taken both IELTS and TOEFL reading subtests. Once the performance of these participants taking both tests is evaluated, once again it emerges that VLT has a more predictive relationship with the reading subtest of TOEFL in comparison with that of IELTS. This high predictive value in the case of TOEFL reading subtest might, as discussed earlier, be attributed to the point that the TOEFL reading subtest under study includes a number of reading comprehension items on guessing the meaning of unknown words from the information existing in the context and co-text. However, IELTS reading subtest that was administered in this study does not include any such items that are directly related to assessing the meaning of unknown vocabulary from the available information in the context. Therefore, vocabulary knowledge plays a different role in the reading subsection of either of the two tests. All this calls for putting vocabulary knowledge as the priority in language learning programs since Laufer and Yano (2001: 549) state that, in academic settings, second language learners and similarly EFL learners are expected to handle a vast amount of reading materials intended for native speakers. But their vocabulary knowledge does not amount to a quarter of the vocabulary known by their native speaking peers. Second language or EFL learners might be placed at a desperate position by not putting vocabulary knowledge as the priority.. 5. Conclusion In this study, it is shown that vocabulary breadth is more related to the reading subtest of TOEFL in comparison with that of IELTS. However, the results obtained suggest that it does not make much difference which test is more associated with vocabulary breadth. Rather, the evidence suggests that vocabulary breadth is crucially important in reading comprehension in general, and in the reading subtest of both IELTS and TOEFL in particular, for the participants in this research, studying in different Iranian universities. The findings of our study might be generalized to other EFL learners in case there is more replication of this investigation with similar results.. Acknowledgements Sincere thanks are due to all the participants for generously sitting long hours to answer our tests.. 150.
(17) Is`haaq Akbarian and Seyyed Mohammad Alavi. Comparing the Contribution of Vocabulary.... 6. References Akbarian, I. (2010). Review of the book Vocabulary and Writing in a First and Second Language: Processes and Development, in English for Specific Purposes, 29, 1: 215-217. Alavi, S. M., and Akbarian, I. (2012). The role of vocabulary size in predicting performance on TOEFL reading item types, in System, 40, 3: 376-385. Cambridge IELTS 5, Examination Papers from University of Cambridge ESOL Examinations: English for Speakers of Other Languages. (2006). Cambridge: Cambridge University Press. Golkar, M., and Yamini, M. (2007). Vocabulary, proficiency and reading comprehension, in The Reading Matrix, 7, 3: 88-112. Hu, M., and Nation, I. S. P. (2000). Unknown vocabulary density and reading comprehension, in Reading in a Foreign Language, 13, 2: 403-430. Laufer, B., and Yano, Y. (2001). Understanding unfamiliar words in a text: Do L2 learners understand how much they don’t understand?, in Reading in a Foreign Language 13, 2: 549-66. Meara, P., and Milton, J. (2003). X_Lex, The Swansea Levels Test. Newbury: Express. Milton, J. (2009). Measuring Second Language Vocabulary Acquisition. Bristol, England: Multilingual Matters. Milton, J., and Hopkins, N. (2005). Aural_Lex. Swansea: Center for Applied Language Studies. Milton, J., Daller, H., Malvern, D., Meara, P., Richards, B., and Treffers-Daller, J. (Eds.). (2008). Guest editorial, in Language Learning Journal, 36, 2: 135/138. Milton, J., Wade, J. and Hopkins, N. (2010). Aural word recognition and oral competence in English as a foreign language, in R. Chacón-Beltrán, C. Abello-Contesse and M.M. Torreblanca-López (eds.), Insights into Non-native Vocabulary Teaching and Learning. Bristol: Multilingual Matters, 83/98. Nation, I. S. P. (1983). Testing and teaching vocabulary, in Guidelines, 5, 1: l2-25. Nation, I. S. P. (1990). Teaching and Learning Vocabulary. New York: Newbury House. Nation, I. S. P. (2006). How large a vocabulary is needed for reading and listening?, in The Canadian Modern Language, 63, 1: 59-82. Nation, I. S. P. and Waring, R. (1997). Vocabulary size, text coverage, and word lists, in N. Schmitt and M. McCarthy (eds.), Vocabulary: Description, Acquisition, Pedagogy. New York: Cambridge University Press, 6-19. Qian, D. (1999). Assessing the roles of depth and breath of vocabulary knowledge in reading comprehension, in The Canadian Modern Language Review, 56, 2: 283-307. Qian, D. (2002). Investigating the relationship between vocabulary knowledge and academic reading performance: An assessment perspective, in Language Learning, 52, 3: 513-536. Schmitt, N., Schmitt, D. and Clapham, C. (2001). Developing and exploring the behaviour of two new versions of the Vocabulary Levels Test, in Language Testing, 18, 1: 55-88. Stæhr, L. S. (2008). Vocabulary size and the skills of listening, reading and writing, in Language Learning Journal, 36, 2: 139-152. TOEFL Actual Tests. (2005). Tehran: Ebteda Publications. Zhang, L. J. and Anual, S. B. (2008). The role of vocabulary in reading comprehension: The case of secondary school students learning English in Singapore, in RELC Journal, 39, 1: 51-76.. 151.
(18)
Figure

Documento similar
In the preparation of this report, the Venice Commission has relied on the comments of its rapporteurs; its recently adopted Report on Respect for Democracy, Human Rights and the Rule
The faculty may have uploaded some file with the complete timetable by subjects.. 7) Scroll down and click on the academic course. You will find all the classes grouped by
They exhibit VARIETY as a result of the different communicative situations, the degree of abstraction or specialization, the type of text (oral or written), the users, the various
Public archives are well-established through the work of the national archive services, local authority-run record offices, local studies libraries, universities and further
Keywords: iPSCs; induced pluripotent stem cells; clinics; clinical trial; drug screening; personalized medicine; regenerative medicine.. The Evolution of
Astrometric and photometric star cata- logues derived from the ESA HIPPARCOS Space Astrometry Mission.
The photometry of the 236 238 objects detected in the reference images was grouped into the reference catalog (Table 3) 5 , which contains the object identifier, the right
The exhibition and the catalogue provide a series of samples that exemplify a phase in the ongoing dialectic between local identities versus connected and communicative
