Study of an evacuation drill in northern Chile
71
0
0
Texto completo
(2) PONTIFICIA UNIVERSIDAD CATOLICA DE CHILE SCHOOL OF ENGINEERING. STUDY OF AN EVACUATION DRILL IN NORTHERN CHILE. FELIPE TOCORNAL KAST. Members of the Committee: JUAN CARLOS DE LA LLERA M. RODRIGO CIENFUEGOS C. JUDITH MITRANI-REISER JUAN DE DIOS ORTUZAR S. Thesis submitted to the Office of Research and Graduate Studies in partial fulfillment of the requirements for the degree of Master of Science in Engineering. Santiago de Chile, January 2015 c MMXV, F ELIPE T OCORNAL K AST.
(3) Gratefully to MTA.
(4) ACKNOWLEDGEMENTS. Firstly, I would like to thank Macarena, who has supported me unconditionally in every aspect of my life. Secondly, I want to express my gratitude to my family, especially to my parents and siblings, who have always been a great support to me. I am also very grateful to Alan Poulos, Juan Carlos de la Llera, and Judith MitraniReiser. Thank you for all your help with the research, and for making it a growing and enjoyable experience. Finally, thanks to all my friends for their advice and company all these years of study and research. In particular, I wish to thank Cristián Ch., Thomas B., Ángeles J., José Tomás K., and Andrés M.. iv.
(5) TABLE OF CONTENTS. ACKNOWLEDGEMENTS . . . . . . . . . . . . . . . . . . . . . . . . . . . . . .. iv. LIST OF FIGURES . . . . . . . . . . . . . . . . . . . . . . . . . . . . . . . . . .. vii. LIST OF TABLES . . . . . . . . . . . . . . . . . . . . . . . . . . . . . . . . . . .. ix. ABSTRACT . . . . . . . . . . . . . . . . . . . . . . . . . . . . . . . . . . . . . .. x. RESUMEN . . . . . . . . . . . . . . . . . . . . . . . . . . . . . . . . . . . . . .. xi. 1.. . . . . . . . . . . . . . . . . . . . . . . . . . . . . . . . .. 1. 1.1.. Background . . . . . . . . . . . . . . . . . . . . . . . . . . . . . . . . . .. 1. 1.2.. Motivation . . . . . . . . . . . . . . . . . . . . . . . . . . . . . . . . . .. 2. 1.3.. Literature Review . . . . . . . . . . . . . . . . . . . . . . . . . . . . . . .. 2. INTRODUCTION. 1.3.1.. Evacuation drills and real events . . . . . . . . . . . . . . . . . . . . .. 2. 1.3.2.. Agent based modeling . . . . . . . . . . . . . . . . . . . . . . . . . .. 3. 1.3.3.. Human behavior . . . . . . . . . . . . . . . . . . . . . . . . . . . . .. 6. 1.4.. Methodology . . . . . . . . . . . . . . . . . . . . . . . . . . . . . . . . .. 7. 1.5.. A brief introduction to the used ABM Evacuation Model . . . . . . . . . . .. 8. 1.5.1.. Steps 1 and 2: Personal attributes . . . . . . . . . . . . . . . . . . . .. 8. 1.5.2.. Step 3: Behavioral regimes . . . . . . . . . . . . . . . . . . . . . . . .. 11. 1.5.3.. Step 4: Social behaviors . . . . . . . . . . . . . . . . . . . . . . . . .. 12. 1.5.4.. Step 5: Global path finding. . . . . . . . . . . . . . . . . . . . . . . .. 13. 1.5.5.. Step 6: Local collision avoidance . . . . . . . . . . . . . . . . . . . .. 14. Thesis Structure . . . . . . . . . . . . . . . . . . . . . . . . . . . . . . . .. 15. EVACUATION DRILL . . . . . . . . . . . . . . . . . . . . . . . . . . . . . .. 17. 1.6. 2.. 2.1.. Coordination in the Regional Drill . . . . . . . . . . . . . . . . . . . . . .. 17. 2.2.. Selection of a Specific Place . . . . . . . . . . . . . . . . . . . . . . . . .. 18. 2.3.. Experiment Design . . . . . . . . . . . . . . . . . . . . . . . . . . . . . .. 19 v.
(6) 3.. 4.. DATA MEASURING AND RESULTS . . . . . . . . . . . . . . . . . . . . . .. 21. 3.1.. Data Measuring . . . . . . . . . . . . . . . . . . . . . . . . . . . . . . . .. 21. 3.2.. Data Processing and Results . . . . . . . . . . . . . . . . . . . . . . . . .. 22. 3.3.. Comparison with the Evacuation Model . . . . . . . . . . . . . . . . . . .. 27. 3.4.. Sensitivity Analysis . . . . . . . . . . . . . . . . . . . . . . . . . . . . . .. 30. CONCLUSIONS AND RECOMMENDATIONS . . . . . . . . . . . . . . . . .. 34. 4.1.. Conclusions . . . . . . . . . . . . . . . . . . . . . . . . . . . . . . . . . .. 34. 4.2.. Recommendations . . . . . . . . . . . . . . . . . . . . . . . . . . . . . .. 35. 4.3.. Future work . . . . . . . . . . . . . . . . . . . . . . . . . . . . . . . . . .. 36. REFERENCES . . . . . . . . . . . . . . . . . . . . . . . . . . . . . . . . . . . .. 37. APPENDIX A.. VIDEO RECORDS . . . . . . . . . . . . . . . . . . . . . . . . .. 44. APPENDIX B.. PEOPLE COUNTER . . . . . . . . . . . . . . . . . . . . . . . .. 46. B.1.. MATLAB Routine to count people . . . . . . . . . . . . . . . . . . . . . .. 46. B.2.. Results . . . . . . . . . . . . . . . . . . . . . . . . . . . . . . . . . . . .. 48. APPENDIX C.. PRE-EVACUATION TIMES . . . . . . . . . . . . . . . . . . . .. 57. APPENDIX D.. SENSITIVITY ANALYSIS . . . . . . . . . . . . . . . . . . . . .. 60. vi.
(7) LIST OF FIGURES. 1.1 Flowchart of the human evacuation model. . . . . . . . . . . . . . . . . . . . . 1.2 Example floor plan and transformation into a graph. 2.1 Colegio Inglés.. 9. . . . . . . . . . . . . . . .. 14. . . . . . . . . . . . . . . . . . . . . . . . . . . . . . . . . . .. 19. 2.2 School overview and camera layout.. . . . . . . . . . . . . . . . . . . . . . . .. 20. 3.1 3D model of Humberstone building.. . . . . . . . . . . . . . . . . . . . . . . .. 21. . . . . . . . . . . . . . . . . . . . . . . . .. 22. 3.3 User interface of the People Counter routine to count people. . . . . . . . . . . .. 23. 3.4 Picture of Exit E1, during the evacuation drill.. . . . . . . . . . . . . . . . . . .. 24. 3.5 Pre-evacuation times. . . . . . . . . . . . . . . . . . . . . . . . . . . . . . . .. 25. 3.2 3D model of Kingswood building.. 3.6 Picture of the upper part of the staircase located at the east side of the Humberstone building (i.e., H1P2a3). . . . . . . . . . . . . . . . . . . . . . . . . . . . . . .. 26. 3.7 Preferred speed. . . . . . . . . . . . . . . . . . . . . . . . . . . . . . . . . . .. 26. 3.8 Fundamental diagram. . . . . . . . . . . . . . . . . . . . . . . . . . . . . . . .. 27. 3.9 Overview of the 2D model . . . . . . . . . . . . . . . . . . . . . . . . . . . . .. 28. 3.10Comparison between model and drill I. . . . . . . . . . . . . . . . . . . . . . .. 30. 3.11Comparison between model and drill II. . . . . . . . . . . . . . . . . . . . . . .. 31. 3.12Sensitivity analysis I. . . . . . . . . . . . . . . . . . . . . . . . . . . . . . . .. 32. 3.13Sensitivity analysis II. . . . . . . . . . . . . . . . . . . . . . . . . . . . . . . .. 33. B.1Graphical user interface of the People Counter routine to load videos.. . . . . . .. 46. B.2Buttons of the People Counter routine.. . . . . . . . . . . . . . . . . . . . . . .. 47. B.3Results of the People Counter routine.. . . . . . . . . . . . . . . . . . . . . . .. 48. C.1Location of the classrooms in the Alianza building. . . . . . . . . . . . . . . . .. 58 vii.
(8) C.2Location of the classrooms in the Humberstone building. . . . . . . . . . . . . .. 58. C.3Location of the classrooms in the Kingswood building. . . . . . . . . . . . . . .. 59. C.4Location of the classrooms in the Victoria building.. 59. . . . . . . . . . . . . . . .. viii.
(9) LIST OF TABLES. 1.1 Summary of drill and real evacuations.. . . . . . . . . . . . . . . . . . . . . . .. 1.2 Parameters from the distribution of random variables.. 4. . . . . . . . . . . . . . .. 10. . . . . . . . . . . . . . . . .. 24. 3.2 Geometrical and evacuation data of each of the school buildings. . . . . . . . . .. 29. A.1Records of the 41 cameras used during the evacuation drill.. . . . . . . . . . . .. 44. A.2Records of interesting behaviors during the evacuation. . . . . . . . . . . . . . .. 45. B.1Results of the People Counter routine.. . . . . . . . . . . . . . . . . . . . . . .. 49. C.1Pre-evacuation time of each class. . . . . . . . . . . . . . . . . . . . . . . . . .. 57. D.1Results of the sensitivity analysis. . . . . . . . . . . . . . . . . . . . . . . . . .. 60. 3.1 Data obtained from each staircase and school exit.. ix.
(10) ABSTRACT. This research addresses the study and modeling of an evacuation drill of a K-12 school located along the shoreline in Iquique and populated with 1,600 students between ages 4 and 18. The velocity of people and their evacuation flow rates were computed numerically and compared with measured results for each building. The model also considers the social behavior of the people during the evacuation. The evacuation model was developed using an Agent-Based Model (ABM), that was programmed in Netlogo, a multi-agent programming environment. The model is able to consider physical variables, such as velocity and diameter of the human agents, the geometry of the facilities and escape routes, and social behaviors, such as the tendency to herd, group, and transfer knowledge. The measured evacuation flow rates were used to compare the real data obtained during the drill with the results of simulations. By using this comparison the proposed model was validated and, afther that, used to perform parametric analyses. Parametric analyses were performed using the preferred velocity, the diameter of agents, and the social variables that control herding and grouping behavior. Results indicate that a local optimum can be found for the two physical variables, and that detailed modeling of the social behaviors in this particular case does not influence the quality of results.. Keywords: Evacuation Drill, Evacuation Model, Agent Based Modeling, Netlogo, Human Behaviors x.
(11) RESUMEN. Esta investigación aborda el estudio y modelamiento de un simulacro de evacuación en un colegio situado a lo largo de la costa en Iquique, el cual cuenta con 1.600 estudiantes de entre 4 y 18 años. La velocidad de las personas y sus tasas de evacuación se calcularon numéricamente y luego se compararon con los resultados medidos en cada edificio. El modelo de evacuación fue desarrollado utilizando un Modelo en Base a Agentes (ABM), programado en Netlogo, un entorno de programación multi-agente. El modelo es capaz de considerar variables fı́sicas, tales como la velocidad y el diámetro de los agentes humanos, la geometrı́a de las instalaciones y de las vı́as de evacuación, y algunos comportamientos sociales de las personas, tales como la tendencia a seguir a la masa, a formar grupos, y a transferir el conocimiento. Las tasas de evacuación medidas se utilizaron para comparar los datos reales obtenidos durante el simulacro con los resultados de las simulaciones. Mediante esta comparación el modelo propuesto fue validado y, posteriormente, utilizado para realizar análisis de sensibilidad. Se realizaron análisis de sensibilidad con la velocidad preferida, el diámetro de los agentes, y las variables sociales que controlan el comportamiento de masa y de grupo. Los resultados indican que es posible encontrar un óptimo local para las dos variables fı́sicas, y que el modelamiento detallado de los comportamientos sociales, en este caso particular, no influye en la calidad de los resultados.. Palabras Claves: Simulacro de Evacuación, Modelo de Evacuación, Modelación en Base a Agentes, Netlogo, Comportamientos Humanos xi.
(12) 1. INTRODUCTION. 1.1. Background The 20th and 21st centuries have been particularly active in terms of natural threats. Consequently, different societies have gone through many natural and anthropocentric disasters, such as hurricanes, flash floods, mega-earthquakes, volcano eruptions, landslides tsunamis, fires, and terrorist attacks. Because of this, governments in many countries have been spending increasing amounts of money to mitigate the effects of these disasters and minimize the expected human and economic losses. In this context the study of evacuation processes from different critical structures such as schools, hospitals, subway stations, and public buildings in general, is of great important to provide complete information to emergency authorities and decision makers. Some typical examples of required decision variables are the evacuation time from a structure, the amount and state of injured people, and the magnitude of economic losses. Because of this interest, very thorough and intensive studies have been performed to study evacuation processes, which lead to many evacuation models [e.g., Kuligowski et al. (2005)]. These models have been supplying important information as required by decision makers through the use of the limited available information before and during the first minutes and hours of the event. Although, the magnitude of the ABM simulations is large, the constant evolution of computational capacity and the progress in modeling techniques make it possible to build ABM models even more sophisticated and realistic. Therefore, our societies can be better prepared for a future disaster.. 1.
(13) 1.2. Motivation This study has been motivated by the imminent occurrence of a large earthquake in northern Chile, where the largest seismic gap of the pacific Rim is located, and the devastating consequences that such an earthquake may have on the population of cities such as Antofagasta, Mejillones, Iquique, and Arica, just to mention some. It is now possible to develop an ABM evacuation model able to estimate, through simulation, the results of the evacuation of a system of buildings, based just on the geometry of the system and the expected distribution of people. This research capacity implies that through information collected before an event, it is possible to generate different scenarios, such as the occurrence of a large earthquake in the seismic gap recently described, and to estimate human and economic losses. By means of these techniques it is also possible to consider the last minute information (using the earthquake example, an information that could be interesting to consider in the model is the precise moment of the event and its consequences over the distribution of people in the city: this piece of information could be considered in the model by modifying the people’s distribution and running new simulations). This tool will help politicians to develop a better understanding of the phenomena and its consequences; it is also a tool for architects who want to simulate if the building design is safe for future evacuations; it allows insurance companies to evaluate their economic exposure and risk in certain events; it helps in preparing emergency managers of a system, like a school, to develop the best possible evacuation plan. As it becomes apparent, modeling an evacuation process has a myriad of practical applications.. 1.3. Literature Review 1.3.1. Evacuation drills and real events Many evacuation drills have been done in order to better understand and precondition the behavior of people during catastrophic events. Some authors like Kholshchevnikov et 2.
(14) al. (2012), have studied the velocity of the evacuation of 0 to 5 year old children; Gwynne & Boswell (2009), investigated the evacuation of a middle sized office building; Hostikka, Paloposki, et al. (2007), did the same with three different drills of a public library, a large office building, and a medium sized office building; Fang et al. (2010) analyzed the behavior of people at the exit of an educational building; and Rinne et al. (2010), studied the 12 different drills presented in more detail in Table 1.1. Researchers have also investigated real events and looked for valuable data. Among them, Helbing et al. (2007) analyzed the recorded videos of the disaster of Mina/Makkah (Saudi Arabia) during Hajj in 1462H on the 12th of January, 2006; a false fire alarm was studied by Hostikka, Paloposki, et al. (2007); and the four cases of real events presented in Table 1.1 were investigated by Rinne et al. (2010). Furthermore, Rinne et al. (2010) studied normal situations using videos from security cameras in order to obtain relevant data. Video data is interesting since it es available in large amounts. Studies focused on the three sources just described -real events, evacuation drills, and normal situations-, are used to obtain similar information: pre-evacuation times, average velocity of evacuees, evacuation rates of different types of buildings. Based on this, fundamental diagrams are used to model this phenomenon in terms of velocity vs. density, flow vs. density, and/or flow vs. velocity.. 1.3.2. Agent based modeling Agent-based models (ABM) are a powerful simulation technique in which a system is conceived as a collection of autonomous decision-making entities called agents, which may be physical or not. At each instant of time, each agent individually assesses its situation and makes decisions on the basis of a set of rules [Bonabeau (2002)]. ABM has been used in several applications, including the social sciences [Axelrod (1997); Epstein & Axtell (1996)], population [Caplat et al. (2008)], economics [Arthur (2006)], and evacuation [Chen et al. 3.
(15) TABLE 1.1. Summary of drill and real evacuations (after Rinne et al. (2010)).. (2006)]. It has also been linked to geographical settings by combining them with geographical information systems (GIS) [Crooks et al. (2011)]. Agent-based modeling is proposed herein to simulate the interaction between people and their physical surroundings during an evacuation due to an emergency. This idea has been applied earlier in several studies including a chemical attack [Mysore et al. (2006)], flood incidents [Dawson et al. (2011)], fires [Massaguer et al. (2006)], and seismic events [Liu et al. (2012)]. The human and social behaviors of the agents during emergencies are very important, since the overall dynamic of the system emerges from them. However, this data are rare or nonexistent, so the model normally relies on strong assumptions which are not taken from empirical evidence. Work has been done in developing multi-agent based frameworks in this area [Pan et al. (2007); Zarboutis & Marmaras (2005)]. For instance, Mysore et al. (2006) describes an ABM simulation and analysis of a potential Sarin gas attack at the Port Authority Bus Terminal in Manhattan. The model has 4.
(16) two types of agents, people and medical facilities. The physical space was constructed using a GIS street map and the pictorial subway map and converted into a graph with 104,730 nodes. The model was implemented in the Java version of RePast 3.1. The amount of Sarin inhaled by a person is estimated based on diffusion effects, air-currents, number of people, temperature, time of day, rate of breathing, and the lapse of time exposed to Sarin gas. Upon exposure and illness, agents choose to head to one of the hospitals they know. The main output of the model studied is the number of fatalities. Sensitivity analysis is done to determine the relevance of hospital resources, obedience level, alert time, and the ability to communicate between agents. Another ABM model [Dawson et al. (2011)] couples a hydrodynamic simulation with the human response to a flood incident. The hydrodynamic simulation uses simple continuity and momentum equations to represent a 2-D dynamic flow field. This approach is ultimately not that accurate to the more sophisticated and computationally expensive existing codes. An ABM is developed by Dawson et al. (2011) using the NetLogo ABM development platform [Wilensky (1999)], and the real topography of the site. Agent behavior, including their location and response to the flood event was characterized using empirical data. The ABM was also used to simulate the traffic on roads using the Nagel and Schreckenberg (N-S) cellular automata pulse model [Dawson et al. (2011)]. A scenario manager, developed in Python [Sanner (1999)] programming language, facilitates batch running of multiple simulations and setting up the model to test different conditions. The case study site is centered on Towyn, North Wales, and parts of the town are built on areas of coastal lowland that were reclaimed to the sea during the eighteenth century. The results used to estimate the vulnerability of the system are the expected number of agents exposed to water depths higher than 25cm of flooding. This is calculated using fragility functions describing the probability of a breach in flood defenses. Another example simulates a fire evacuation in a building of the University of California, Irvine, using a simulation environment called DrillSim [Massaguer et al. (2006)]. It studies the impact of Information Technology (IT) in response to the disaster. In particular,. 5.
(17) it analyzes the effect of the number of floor wardens relative to the evacuation time of the building occupants. A closer example to this research deals with the response of buildings subjected to ground motion using finite element simulations [Liu et al. (2012)]. The model includes ABM to consider the evacuation of building occupants in the study area immediately following a seismic event. The study building is a three-story tall steel-frame building, which was subjected to the 1994 Northridge Earthquake [Liu et al. (2012)]. Response parameters are used directly to estimate structural damage, and indirectly, using fragility curves, to estimate non-structural damage. The ABM was implemented in Netlogo [Wilensky (1999)], and each agent is created at the start of the simulation. The health status of agents is determined using probabilities and is based on historical data. Moreover, the health of agents defines its moving speed. The motion of human agents resembles the flow of a fluid, where the ground gradient is defined as a static field that describes the distance to the exits. The main output studied is the evacuation time of the building occupants. Agent-based models have also expanded in the last twenty years into the interaction with geographical settings [Johnston (2013); Benenson & Torrens (2004)]. However, more recent progress [Benenson & Torrens (2004)] incorporates open-source code like Agent Analyst [Johnston (2013)]; this application allows modeling in time-spatial dimensions. In a geographical context, the spatial dimension implies not only the location of an element within that space, but also the relationship with its context, physical or geographical, and the scale [Brown et al. (2005)]. 1.3.3. Human behavior It is largely agreed that a realistic model of a human evacuation process cannot rely only on physical or geometrical factors, but must include the key aspects of human behavior [Burstedde et al. (2001); Gwynne et al. (2001); Helbing et al. (2002); Pan (2006)]. Some of the ways that human behavior have been modeled in evacuation situations are: using a force model based on fluid dynamics for rational people, and a granular dynamic model for people in panic [Helbing et al. (2002)]; or using a stress variable to set the mood of each person 6.
(18) (happy or unhappy), which defines the interaction between them in bottlenecks [Burstedde et al. (2001)].. 1.4. Methodology The methodology followed here analyzes the problem from two different approaches: (i) an experimental approach as used in this thesis, where data of an evacuation drill is implemented, recorded, and analyzed; and (ii) a theoretical approach as presented in Poulos (2014), where a conceptual framework for an evacuation model is developed. After the compilation of the data of the drill and the development of the evacuation model in Netlogo, many simulations were run in order to validate the model with the data. This thesis performs a sensitivity analysis on several agent parameters to draw several important conclusions. In order to better understand the final section of this research, it is necessary to summarize in some detail the work done by Poulos (2014). Therefore, there are two subsections related to that: (i) One dedicated to summarize the components of an ABM framework, considering the entire physical surroundings and the navigation algorithms -a rational movement following a gradient that leads to the shortest way to the exit. (ii) The other refers to improving the human response through the implementation of various behavioral regimes and social behaviors. This component will be explained in greater depth because it is a key topic to implement the conceptual model proposed by Poulos (2014). Additionally, the key research areas of this thesis are: (i) Coordination of the different stakeholders who participated in the regional drill that took place in Iquique August 8th, 2013. (ii) Selection of a testbed to obtain valuable data, i.e. the selection of Colegio Inglés in Iquique. (iii) Design of the experiment, i.e. the definition of interventions in the schoolyard, interventions in the classrooms, location of the cameras, and so forth. 7.
(19) (iv) Data gathering during the drill. (v) Data processing and response parameters from drill data. (vi) Comparison of measured data and results of the evacuation model; it also includes sensitivity analyses. (vii) Suggestions to improve data survey for future work.. 1.5. A brief introduction to the used ABM Evacuation Model The model proposed by Poulos (2014) of human behavior during an emergency evacuation process is summarized graphically in Figure 1.1. Each agent has attributes that affect the selection of a behavioral regime -normal, rational or panicked- and that govern its social behavior -grouping, herding, and knowledge transmission. While displacing agents are modeled at two different scales defined as global path finding and local collision avoidance. Global path finding consists of computing the preferred velocity of the agents by taking into account their attributes, behavioral regimes, and social behaviors. When all the preferred velocities of agents are selected, local collision avoidance is used to compute new velocities to ensure no-collisions with static obstacles and among agents. The results are used together with information of the social behaviors to update some of the attributes of the agents (e.g., stress, position, and velocity). The rest of attributes do not change during evacuation. 1.5.1. Steps 1 and 2: Personal attributes Agents are assigned personal properties in the model to include realistic behaviors of heterogeneous populations such as age, gender, normal speed, knowledge level, social networks, stress, organizational role, position, and velocity. Age and gender are important variables to properly estimate the speed of an agent [Helbing et al. (2002)], sensitivity to stressful stimuli [Bateman & Edwards (2002)], and preevacuation time [Bateman & Edwards (2002)]. To enable simulation of these effects the proposed model takes into account gender and separates young children of ages 4-6 from the rest of the population. 8.
(20) Start. Step 1. Input age, gender, knowledge, and social network. Step 2. Initialize position, velocity, stress, and normal speed. Step 3. Select behavioral regimes. no Step 8. Step 4. Assess social behaviors. Step 5. Find global path. Have all agents evacuated?. yes. Output flow rates and evacuation time Stop. Step 6. Avoid local collisions. Update position, velocity, stress, and knowledge. Step 7. F IGURE 1.1. Flowchart of the human evacuation model (after Poulos et al. (2014)).. The normal speed is defined as the unimpeded walking speed on a horizontal surface, and is selected from a Weibull distribution [Weibull (1951)]: fX (x) =. α α−1 −(x/β)α x e , x≥0 βα. (1.1). where α and β are the shape and scale parameters, respectively. The parameters of the distributions that were used in this study are shown in Table 1.2. For adults the mean of the distribution is 1.34 m/s [Rinne et al. (2010)], which is consistent with the values presented in other sources [Fujiyama & Tyler (2004); Proulx (2002); Meister (2007)]. The average speed of the distribution used for young children is 0.85 m/s, which was the mean speed 9.
(21) observed in Larusdottir & Dederichs (2011). In this model, gender will not be considered in the selection of normal speeds because they are quite similar. The projected speed of agents using a stairway is reduced by 51% according to previous data [Fujiyama & Tyler (2004); Meister (2007)]. TABLE 1.2. Parameters from the distribution of random variables.. Random variable. α. β. Mean. an adult’s normal speed 10.14 1.41 1.34 m/s a child’s normal speed 3.80 0.94 0.85 m/s It is also well known that the familiarity (knowledge) that people have of the building affects their evacuation behavior [Gwynne et al. (2001); Pan (2006)]. For example, agents select their evacuation routes based on their knowledge level [Gwynne et al. (2001, 2006); Jones & Hewitt (1986); Pelechano & Badler (2006)]. Thus, agents will not necessarily head to the nearest exit, but rather to the exits that they know better. In the model, exits that agents are most familiar with are initially assigned. Nevertheless, during evacuation, agents will consider exits that they can see, even if they are less familiar with them before evacuation starts. This knowledge can be transmitted by talking with other agents as described later in section 1.5.3. Social networks represent the relationships between individuals existing prior to the evacuation (e.g., friends, family, and co-workers). These social networks have a considerable impact on the evacuation response because people tend to evacuate in groups with other people that they know [Hostikka, Korhonen, et al. (2007); Jones & Hewitt (1986); Parikh et al. (2013)], as explained later in section 1.5.3. To take this phenomenon into account, each agent is grouped at the beginning of the simulation with a set of known agents. In the school case study these sets represent friendships between students, and between students and teachers. During evacuation, people may find themselves in frightening situations or under conditions that make them impatient to evacuate. These situations increase the stress of agents in the model. Stress has been incorporated in previous models by: (i) the incapacity of agents to 10.
(22) do what they want to do [Burstedde et al. (2001)], (ii) the proximity between agents [Helbing et al. (2002)], and (iii) the perception that the agent has on the hazard intensity [Pan (2006)]. The stress of agents is assigned to zero at the beginning of the simulation, and it increases if an agent is blocked by other agents. 1.5.2. Step 3: Behavioral regimes To capture the differences in individual behaviors during an evacuation process, various behavioral regimes (states) can be considered, each with different rules of movement and impact on the social behaviors. For example, Pan (2006) defines three conventions that impact the decision-making mechanisms of each person: experience, bounded rationality, and instinct. Gwynne et al. (2001) has two different regimes, normal and extreme, that are set for each agent at the beginning of the simulation and do not change during the evacuation. The proposed model has three behavioral regimes: normal, rational, and panicked, that are similar to the general behaviors considered by Ohta & Omote (1977). Unlike the model in Gwynne et al. (2001), each agent can change its regime during the evacuation depending on its stress level [Helbing et al. (2002); Pan (2006); Burstedde et al. (2001)]. The optimum rational response of each individual occurs for different levels of stress [Pan (2006)], so the limits of stress between regimes will be assigned stochastically. At the beginning of the simulation people do not sense a threat, but still start to evacuate the building. This is modeled by assigning a normal behavior to all agents, which consists in evacuating the building through the closest exit that they know, without using emergency exits [Gwynne et al. (2001); Pelechano & Malkawi (2008)]. This regime is similar to the “happy” mood suggested by Burstedde et al. (2001), and to the “normal” regime suggested by Gwynne et al. (2001). As the stress level of the agents grows they will probably change their regime to rational. Agents in the rational regime try to evacuate a building as fast as possible, considering all the exits that they know (normal and emergency exits) [Gwynne et al. (2001)], and following the most efficient path to evacuate the building [Fang et al. (2010); Helbing et al. (2002)]. This is achieved by considering congestion in order to represent the relation between the shortest and the fastest path, as explained in section 1.5.4. 11.
(23) Finally, if their stress level gets high enough, the agents will enter the panicked behavioral regime, in which they behave according to some “irrational” or nonadaptive principles that can lead to non-constructive consequences [Pan (2006)]: choosing the shortest path without considering that due to congestion it is not the fastest path [Helbing et al. (2002)], not talking with other agents to increase their knowledge of the building [Pan (2006)], use exits only they knew before the evacuation started [Helbing et al. (2002); Hostikka, Korhonen, et al. (2007)], and increase their preferred speed [Helbing et al. (2002)]. 1.5.3. Step 4: Social behaviors The proposed model takes into account three social behaviors: herding, grouping, and knowledge transmission. These behaviors affect the agents with different intensities depending on their personal attributes and according to their current behavioral regime. The grouping behavior, also called kin behavior, consists in the joint evacuation of people who know each other (social networks), and has been considered in numerous human evacuation models [Gwynne et al. (2006); Jones & Hewitt (1986); Pan (2006); Parikh et al. (2013); Yang et al. (2005)]. Groups can also be formed by people who are felt as peers (e.g., same age or gender) [Pan (2006)], and the people who form them share the knowledge of the building and start evacuating at the same time [Gwynne et al. (2006)]. The behavior of the group is seriously affected by the leader’s decisions [Jones & Hewitt (1986); Parikh et al. (2013)] and by the slowest agent in the group [Gwynne et al. (2006); Yang et al. (2005)]. Herding behavior has been defined as “to do what other people do” [Helbing et al. (2002)]. People increase their tendency to incur in herding depending on their knowledge level [Pan (2006)] and their behavioral regime [Helbing et al. (2002)]. It is normally implemented by modifying the gradient that agents use to find the shortest path [Burstedde et al. (2001)], by logical orders as “between two possible exits, follow the most crowded” [Pan (2006)], or by attraction forces between agents in a force model [Helbing et al. (2002); Hostikka, Korhonen, et al. (2007)]. In the model employed in this study an agent that is subjected to herding selects heir route as the one that is more frequently used by the agents that are close by and that he/she can see. Herding only applies to agents who are not in a 12.
(24) group, and are in the panicked behavior mode or in a lesser extent in the rational behavior mode. During evacuation, knowledge of the escape routes can be transferred between people by conversation [Gwynne et al. (2001, 2006); Mysore et al. (2006)]. The effectiveness of the transmission depends on the behavioral regime of the people involved. This behavior is modeled in this study by assigning a probability of starting a conversation to each agent. The agents with rational behavioral regime have the highest probability of starting a conversation, then those with normal behavior, and finally those in panic. The probability of the event that two agents will share information of the exit routes that they know is computed as the average of their probability of speaking. Knowledge transmission is not mutually exclusive with the other social behaviors. 1.5.4. Step 5: Global path finding The building environment is first transformed into a visibility graph (roadmap), which is used to navigate around static polygonal obstacles (e.g., walls), as shown in the simple example of Figure 1.2. Each exit, stair and convex corner of an obstacle is a vertex of the graph. Edges (arcs) exist between vertices that are visible to each other, i.e., in which a straight line joining the vertices does not intersect the interior of any obstacle. It can be shown that the shortest path between two points among a set of disjoint polygonal obstacles is a polygonal path whose inner vertices are convex vertices of the obstacles [De Berg et al. (2000)]. The building can have multiple floors, and this result is valid for the shortest path in each floor. The weight of each edge is initially set as the distance between the two end vertices of the edge, but it is dynamically reassigned to represent changes in the route of agents due to congestion. Edges with slow moving agents are penalized in their weights, while edges with no congestion remain with the original distance. This is done so that each agent minimizes the time to get out of the building instead of the distance traveled. The quickest route from each vertex to the exits is then computed using Dijkstra’s Algorithm [Dijkstra (1959)]. The global path of each agent is found by calculating, at every time step, the preferred velocity vpi , which is a vector pointing to the vertex that minimizes the time 13.
(25) to get to an exit. The magnitude of this velocity is the regular speed of the agent, which is adjusted depending on the agent’s regime and location (e.g., hallway or stairway).. F IGURE 1.2. Example floor plan and transformation into a graph.. Almost all people present in the school when the evacuation took place had a very good knowledge of the physical environment, because they attended the school regularly. Thus, the assumption that every person chooses the shortest path to the exits is not far from reality. This is not the case in other buildings that have less informed occupants (e.g., shopping centers and stadiums), where agents only have partial information of the geometry of the building (e.g., they probably know just the way they came in). A simplified way to model this case, is to find the shortest path from each of the exits to all the vertices of the graph, and assign agents to the routes that get them exits that they know (which are assigned before the simulation starts).. 1.5.5. Step 6: Local collision avoidance Local collision avoidance consists in computing the new velocities vni of the agents at each time step, ensuring no collision with other agents or static obstacles (e.g., walls) occurs. This is accomplished by using the optimal reciprocal collision avoidance principle (ORCA) [Van Den Berg et al. (2011)], which consists of each agent selecting independently, and simultaneously, a new velocity that is as close as possible to its preferred velocity, but avoids collisions with stationary obstacles and other agents 14.
(26) vni = arg min kv − vpi k. , ∀i ∈ N. v∈Viτ. (1.2). where N is the set of all the agents, and Viτ is the set of all possible velocities that ensure that agent i will not collide with the other agents and obstacles for at least a length time, τ . Set Viτ is explained in detail in Van Den Berg et al. (2011), and is calculated with each agent observing the current position and velocity of the other agents around it, and assuming that they also use the same strategy to select their new velocity. Finally the new position of the agents rni is calculated using the calculated velocities. rni = ri + vni ∆t. , ∀i ∈ N. (1.3). where ri is the position of agent i in the previous instant and ∆t is the time step of the model (chosen as 0.05 s for this work).. 1.6. Thesis Structure This document is divided into four chapters, including the literature review, the definition of the research objectives, the analysis of results, and the conclusions. Chapter 1 is the introduction of this thesis, where the scientific problem is presented with a brief presentation of the theory required. A review of the state of the art and the methodology used to fulfill the objectives established are also presented in this chapter. Chapter 2 describes in detail the setup of the experiment (i.e. the evacuation drill) performed in a K-12 school in Iquique, Chile, 2013. Chapter 3 presents the results obtained from the analysis of the data gathered during the evacuation drill, the sensitivity analysis done, and the recommendations for future experiments of this kind. Moreover, some sources of error are mentioned in order to identify some assumptions that could lead to uncertainties in the results. 15.
(27) Finally, in Chapter 4, the conclusions of this work and some ideas concerning future work are presented.. 16.
(28) 2. EVACUATION DRILL IN A K-12 SCHOOL IN IQUIQUE, CHILE Evacuating people from potential tsunami inundation zones as a result of large earthquakes in cities and towns along the shoreline, is a critical and complex social activity that needs to be executed in a very short time by emergency offices. Logistical aspects play a very important role in that process, which are usually trained regularly by specific drills that though indispensable, never represent the exact environment and human conditions faced with a true emergency. Moreover, several other unforeseen conditions, such as the presence of foreigners who are not familiar with the evacuation routes and drills, may lead to fatal consequences. Such was the case with the Mw 8.8 Chile earthquake in 2010 [Fritz et al. (2011)]. Consequently, the study of people evacuation processes under different types of threats have been studied recently by a number of researchers (e.g., Chen et al. (2006); Dawson et al. (2011); Gwynne et al. (2001); Mas et al. (2012); Parikh et al. (2013); Liu et al. (2012); Helbing et al. (2007); Olsson & Regan (2001)). Tsunami inundations, fires, volcano eruptions, landslides, and several anthropogenic sources of a hazard field have been used in evaluating the response of people faced with these threats. The study of this problem can be approached analytically (numerically) or experimentally by means of the usual drill exercises. Apart from its positive training effect, drills are a very good source to calibrate our analytical models, which indeed is the approach used herein. From now on, this chapter will describe the entire setup of the evacuation drill performed at a K-12 school in Iquique, Chile, and coordinated with the office in charge of the entire regional evacuation drill. 2.1. Coordination in the Regional Drill The evacuation drill took place August 8th , 2013, as part of an earthquake and tsunami drill in the coastline of the four northern regions of Chile. It was organized by the National Office of Emergency (ONEMI) of the Ministry of Interior and Public Security and involved more than 267,000 people in the evacuation, of which 76,000 were from the city of Iquique 17.
(29) and evacuated from the coastline to the safety zone shown in Figure 2.1c. The expected outcomes from the drill were to promote a culture of prevention in the population, prepare them for a future event, and to evaluate the evacuation times to reach the safety zones [Walker (2013)]. The tsunami sirens of the city went off at approximately 11:28 AM. The staff and students of the school knew that a tsunami drill was going to take place that day in the city, but they did not know the exact time it was going to start. This drill was carried out prior to the earthquake of April 1st , 2014 in Pisagua, 94 km northwest out of the coast of Iquique. The earthquake liberated about 20% of the energy stored in the seismic gap defined between latitude 18◦ S in southern Peru and latitude 23◦ S in northern Chile [Lay et al. (2014)], which had not been active since the last 1877 earthquake [Chlieh et al. (2004)]. In this region the Nazca Plate goes under the South American continental plate at a rate of about 68 mm/year. Because of the geometry of the subducting plate dipping at 18◦ , large megathrust earthquakes in this region are normally followed by a tsunami. Because of this, ONEMI has a target time of 20 minutes to make the people involved to arrive to the nearest safe zones after the occurrence of an earthquake [Walker (2013)].. 2.2. Selection of a Specific Place A K-12 school of Iquique (Colegio Inglés), in northern Chile, was chosen because of several factors that were relevant to our research. The school has approximately 1,600 students of ages ranging between 4 and 18, and it is located at about 70 meters from the coast line, as shown in Figure 2.1c, which makes it extremely vulnerable to a tsunami. Another relevant feature is that by selecting a school as a testbed, the attributes of the agents (e.g., their age, gender, and position at the beginning of the evacuation drill) are known for most occupants, which reduce the uncertainty. Having this information enables us to compare the results between the model and the drill in a more realistic way. 18.
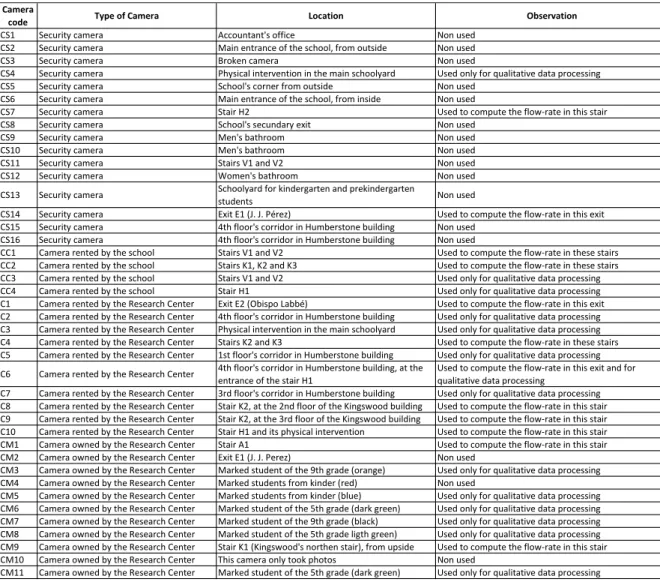
(30) 70°10'0"W. 70°9'0"W. 70°8'0"W. 70°7'0"W. 20°12'0"S. 20°12'0"S. IQUIQUE. PE PE. PE PEPE PE. PE. PE. PE. PE. PE PE. PE PE. PE. 20°13'0"S. 20°13'0"S. PE PE. PE PE PE PE PEPE PE PE PE PE PE PE. School C. Í. F. PEPE PEPE PEPEPEPE. O I C. PE. PE PE PE. A. PE PE. 20°14'0"S. 20°14'0"S. P. O. PE. A. N. PE. É. PE. C. PE. O. PE PE PE PE PE. ( A ) View of the Victoria building.. PE PE PE. PE. 20°15'0"S. 20°15'0"S. PE. PE PE PE PE PE PE. PE. 20°16'0"S. 20°16'0"S. PE. 20°17'0"S. 20°17'0"S. PE. 0. 1. 2 km. 70°10'0"W. ( B ) View of the Kingswood building.. PE. 70°9'0"W. 70°8'0"W. 70°7'0"W. ( C ) Inundation map of the city of Iquique.. F IGURE 2.1. Colegio Inglés.. 2.3. Experiment Design In order to maximize the data collected some physical interventions were purposely deployed in the corridors, stairs, exits, and schoolyard. Additionally, some individuals were asked to simulate a panic attack during the drill, in order to create some heterogeneous behaviors. A total of 41 video cameras were used to record the information of the evacuation. It was necessary to strategically place these cameras in a way to capture all evacuees. The 41 cameras used included 16 security cameras, 4 cameras rented by the school, 10 cameras 19.
(31) rented by the National Research Center for Integrated Natural Disaster Management (CIGIDEN), and 11 cameras owned by CIGIDEN. The location of each camera and corresponding sight lines and intended use are given in Table A.1. In spite of this, several records turned out not to be used because they were pointing to areas of the school where there was no movement during the evacuation drill, or because the resolution of the camera was not good enough. These cameras were used to measure experimentally the amount of people that evacuated through each staircase, the four buildings, and the complete school. The layout of the more important cameras and their sight lines are shown in Figure 2.2.. F IGURE 2.2. School overview and camera layout.. 20.
(32) 3. DATA OBTAINED FROM THE EVACUATION DRILL OF THE K-12 SCHOOL AND RESULTS OF THE DATA PROCESSING 3.1. Data Measuring Some of the variables of interest that were measured by video cameras in this school were the flow-rates of people on stairs and exits, and the evacuation times of each building and for the entire school. From the information obtained, other variables, like the velocity of people, were computed. There was also interest in observing more qualitative data, such as the existence of other agent behaviors. Data were used for a better comprehension and modeling of the herding, grouping, and altruistic behavior. More information about the video records and their use can be found in Appendix A. The floor plans of the four buildings of the school were obtained from 3D models constructed using laser scanning technology, two of which are shown in Figures 3.1 and 3.2. This complete scanning of the structure was done because there were no architectural or structural plans available.. F IGURE 3.1. 3D model of Humberstone building.. 21.
(33) F IGURE 3.2. 3D model of Kingswood building.. The scanning of the structure was done by two employees of GEOCOM S.A. (web site: www.geocom.cl) who used a TRIMBLE Laser Scanner, model TX5, to get geo-referenced points of each building. To accomplish this, the two professionals went to Iquique for a week and worked after classes (around 4 p.m.) to minimize the problems with the scanning results. The outputs of GEOCOM were used by GEPUC (web site: www.gepuc.cl) to build a 3D BIM model on Revit [Demchak et al. (2009)] of the K-12 school. From this model the required building layouts were created.. 3.2. Data Processing and Results A MATLAB [Moler (1980)] routine was developed to process the quantitative data recorded on videos. This routine has a user interface shown in Figure 3.3, which allows the user to manually identify people passing through a control zone in order to compute the flow-rates in that area. More information about this routine is found in Appendix B. Eight stairways and the two school exits shown in Figure 2.2 were used to study the history of the evacuation drill. Table 3.1 presents the total amount of people that passed through these points. It also presents a flow rate, which was calculated as the slope of a straight line obtained using a linear regression to fit the real flow. Finally the estimated flow rate is divided by the width of stairways or exits in order to obtain normalized flow 22.
(34) F IGURE 3.3. User interface of the People Counter routine to count people.. rates. Exit E1 (Figure 3.4) had high congestion and was probably at its maximum capacity with a normalized flow rate of 3.24 P/s/m, which is close to the average values of 3.2 P/s/m obtained experimentally by Daamen & Hoogendoorn (2012) with the population of a school. This same study found schools to be the facilities with the greatest flow rate, because their occupants are mostly children which are smaller in size than adults and hence more of them can cross an exit at the same time [Daamen & Hoogendoorn (2012)]. Exit E2 (showed in Figure 3.3) had the smallest normalized flow rate because it had almost no congestion. Please note that we purposely blocked this exit (with a soccer goal) to interrupt the normal flow of people emulating a fallen division wall. However, since the flow of students is low, such perturbation did not affect the normal flow rates, though the effect is clear in the picture. For each classroom the time between the start of the drill and the start of their evacuation (pre-evacuation time) was measured, and is presented in Figure 3.5 (the exact values of the pre-evacuation times and the location of each classroom can be found in Appendix C). The figure also shows the cumulative distribution function (CDF) and probability density 23.
(35) TABLE 3.1. Data obtained from each staircase and school exit.. Flow rate [P/s] Width [m] Stair H1 Stair H2 Stair A1 Stair K1 Stair K2 Stair K3 Stair V1 Stair V2 Exit E1 Exit E2. 3.04 2.49 2.15 2.27 1.63 2.38 2.12 1.92 6.80 6.38. 1.40 1.30 1.45 1.25 1.25 1.25 1.40 1.40 2.10 4.40. Norm. rate [P/s/m]. N◦ of people. Drill. Model. Drill Model. 2.17 1.92 1.49 1.82 1.30 1.91 1.51 1.37 3.24 1.45. 2.22 2.06 1.70 1.57 1.72 2.06 2.05 1.60 3.35 1.42. 145 91 167 207 115 218 82 85 536 1009. 145 91 167 172 163 205 97 70 534 1011. F IGURE 3.4. Picture of Exit E1, during the evacuation drill.. function (PDF) of a fitted Weibull distribution of pre-evacuation time, which was calculated using the maximum likelihood method. Moreover, a Pearson’s χ2 test was applied to the adjusted distribution and a p-value of 0.39 was found, meaning that the distribution is accepted because the p-value is greater than typical values of the significance level (0.05 - 0.1). 24.
(36) 1.0. 0.025. Measured Data CDF PDF. 0.8. 0.020. 0.015. 0.4. 0.010. 0.2. 0.005. PDF. CDF. 0.6. 0.0. 0. 20. 40. 60. 80. 100. 120. 0.000 140. Time [s]. F IGURE 3.5. Pre-evacuation times of the different classes of the school, and the CDF and PDF of the fitted Weibull distribution with shape parameter α = 1.634 and scale parameter β = 49.96.. With the geometry of the structure and the flow-rates at certain points (i.e. people per second), the density (i.e. people per square meter) could be computed at every instant. For example, considering the staircase that goes from the 2nd floor to the 3rd floor at the east side of the Humberstone building (i.e., H1P2a3) in Figure 3.6, with the flow-rate at the beginning and at the end of a stair (i.e. control zones A an B; flow rates that can be found in Table B.1, columns H1P3 - top and H1P2 - bot), the total amount of people on the stair at every instant can be computed, and if that parameter is divided by the surface area of the stair (i.e. divided by w and L parameters shown in Figure 3.6), the density at every instant could be obtained. Note that this procedure considers the horizontal component of people an stairs to compute √ density (that is why the amount of people is divided by L and not by L2 + h2 ). Thus, the maximum density computed was 3.95 persons per square meter. On the other hand, assuming that in narrow routes (like some stairs) the First In First Out (FIFO) assumption is true, the flow-rates at the beginning and at the end of these routes can be used to compute the time needed by each person to cross that route. Using these data and 25.
(37) F IGURE 3.6. Picture of the upper part of the staircase located at the east side of the Humberstone building (i.e., H1P2a3).. the length of the route, the average speed of each person is obtained, and the average speed of all the people along that route at a certain moment could also be obtained. The result of doing this in each corridor (without considering the stairs), and a Weibull distribution fitted to measured data using the least squares approximation, are presented in Figure 3.7. 1,0. 2,5 Measured data. 0,9. Weibull CDF. 0,8. 2,0. Weibull PDF. 0,7 1,5. PDF. CDF. 0,6 0,5 0,4. 1,0. 0,3 0,2. 0,5. 0,1 -. -. -. 0,5. 1,0. 1,5. 2,0. Speed [m/s] F IGURE 3.7. Preferred speed of people who walk along corridors. The mean of the measured speed is µ = 1.45m/s, and the α and β parameters of the fitted Weibull distribution are 7.45 and 1.53, respectively. These values are consistent with the researched literature [Rinne et al. (2010); Hostikka, Korhonen, et al. (2007); Finnis & Walton (2007) ]. Once having gathered all this information, i.e. the average velocity, the density, and the flow-rate, it becomes possible to build any of the fundamental diagrams of the system. In Figure 3.8 the density versus the standard flow-rate of each stair is shown. The dots are 26.
(38) obtained from stairs and moments where the two variables were quite stable in order to avoid boundary effects.. Standard Flow-Rate [N/m/s]. 2,50. 2,00. 1,50. 1,00. 0,50. -. 0,50. 1,00. 1,50. 2,00. 2,50. 3,00. 3,50. 4,00. 4,50. Density [N/m/m]. F IGURE 3.8. Fundamental diagram of the system that shows the density versus the standard flow-rate. The average curve is defined by f = 1.09d − 0.17d2 and has a R2 = 0.69; this result is consistent with Pauls (1987) who obtained a curve characterized by f = 1.26d − 0.33d2 .. 3.3. Comparison with the Evacuation Model Some of the pre-drill survey data were used to calibrate the evacuation model generated in this research; this is the case of the school geometry, and the amount of people and their location at the beginning of the evacuation drill. The rest of the information was used to validate the same model through the comparison between the results of the evacuation drill and the simulations done in Netlogo. Such is the case of the mean speed of agents, the evacuation rate of each building, and the global evacuation rate of the school. The school buildings were transformed into a group of two dimensional grids with grid spacing of 10 cm, similar to Figure 1.2. Each cell (patch) represents either a wall, a stair, an exit or a floor. Stair patches are used to connect nonadjacent points of the grid by transporting 27.
(39) agents between them to emulate the real 3D environment. The actual stair space is modeled in the same two dimensional grid. For example, the Kingswood building shown in Figure 2.1b was measured to build the 3D model shown in Figures 3.1 and 3.2 from which the plans were obtained to build the 2D model shown in Figure 3.9.. F IGURE 3.9. Overview of the 2D model done in Netlogo. These plans represent the 2nd, 3rd, and 4th floors of the Kingswood building.. The geometrical properties of each of the four buildings of the school are shown in Table 3.2, together with the number of people who evacuated and the time between the start of the evacuation and the instant in which the first and last person left the building (ti and tf , respectively). Each building consists of the sum of all its stairways that leads to the schoolyard. Table 3.2 also shows the total amount of people that evacuated the school, which considers: all the stairways, the first floors of the four buildings (consisting mainly of offices for the staff), and people who were in the schoolyard when the evacuation started. 28.
(40) TABLE 3.2. Geometrical and evacuation data of each of the school buildings.. ti. tf. N◦ of floors Area/floor [m2 ] N◦ of people Drill Model Drill Model Humberstone Alianza Kingswood Victoria Complete School. 3 3 4 3 -. 754 331 766 210 -. 236 167 540 167 1545. 0:39 1:00 0:31 0:27 0:06. 0:39 1:04 0:32 0:30 0:20. 1:58 2:22 2:39 1:31 3:51. 2:06 2:18 2:34 1:20 3:49. To compare the model and drill results, curves of evacuated people with respect to time were used. Figure 3.10 compares 25 simulations of the model with the drill in each of the four buildings. These simulations do not consider the social behaviors described in section 1.5.3, since they will be evaluated in the following section using a sensitivity analysis. Figure 3.11 shows the same comparison for the two exits of the school, which considers the people who came out from the buildings plus students who were in the schoolyard when the evacuation started. Both exits were then added up to obtain the total evacuation curve of the school. The simulations are also compared with the drill using the normalized flow rates in stairs and exits as shown in Table 3.1. The model results are fairly close to the ones obtained during the drill, with an average error of 13.6%. However, the stairways with the largest errors are the ones where the model does not predict correctly the number of people that use them (Kingswood and Victoria buildings). This error of prediction occurs when there are classrooms that have two or more routes with similar distances to the exits. The model chooses the fastest route for each agent in the classroom, while in reality people are not capable to sense small differences in distance and tend to choose the route they are more familiarized with. If the stairways of these two buildings are not considered in the model, the average error is only 5.8%. The differences between the drill and the ABM simulations are greatly reduced at the building level, as seen in Figure 3.10 and in the total evacuation time tf (Table 3.2), where the average error of the four buildings is 5.9%, and just 1.0% for the complete school. 29.
(41) 250. 180. Simulations Measured data. 160 140 Number of evacuated people. Number of evacuated people. 200. Simulations Measured data. 150 100 50. 120 100 80 60 40 20. 0 0. 50. 100. Time [s]. 150. 200. 0 0. 250. 50. ( A ) Humberstone 600. 150. 200. 250. ( B ) Alianza 160 140 Number of evacuated people. Number of evacuated people. Time [s]. 180. Simulations Measured data. 500. 100. 400 300 200 100. 120 100 80 60 40. Simulations Measured data. 20. 0 0. 50. 100. Time [s]. 150. 200. 250. 0 0. 50. ( C ) Kingswood. 100. Time [s]. 150. 200. 250. ( D ) Victoria. F IGURE 3.10. Comparison of the evacuation history of the drill and the model for each building.. 3.4. Sensitivity Analysis The sensitivity of two physical parameters of the model were studied: the normal speed and the diameter of the agents. The effect of these parameters of the simulations is analyzed using the error measure D(θ), which is defined as the absolute difference between the history of the evacuated people in the model and drill Z. tf. |pm (t, θ) − pd (t)| dt. D(θ) =. (3.1). 0. 30.
(42) 1600. Number of evacuated people. 1400 1200 1000. Total Sim. Total Exp. East exit Sim. East exit Exp. North exit Sim. North exit Exp.. 800 600 400 200 0 0. 50. 100. 150 Time [s]. 200. 250. 300. F IGURE 3.11. Comparison of the evacuation history of the drill (dashed lines) and the simulations of the model (solid lines) for both exits and the complete school.. where θ is the value of the parameter, pd (t) is the number of evacuated people in the drill, pm (t, θ) is the predicted number of evacuated people by the model (average of all the simulations), and tf is the time of the last evacuee. The impact of a parameter on the prediction that the model has on the real evacuation drill will be quantified by the normalized error E(θ), obtained by dividing D(θ) by the error of the model corresponding to the initial value of the parameter θ0 , i.e.. E(θ) =. D(θ) D(θ0 ). (3.2). The normalized error of the simulations in each building and the complete school for different values of normal speed and diameter of the agents are presented in Figure 3.12. It is apparent that the initial values of 1.34 m/s for the normal speed and 45 cm for the agent diameter that were used for the simulations are close to the speeds and diameters that produce minimum error. The agent speed that minimizes the error for the complete school is a bit 31.
(43) higher than the agent speed in the buildings, which suggests that the model should be set with higher speeds in open spaces than inside buildings. 20. 14. Humberstone Alianza Kingswood Victoria School. 12. 15. Normalized error. Normalized error. 10. 8. 6. 4. Humberstone Alianza Kingswood Victoria School. 10. 5. 2. 0 0.8. 1.0. 1.2. 1.4. 1.6 1.8 Normal speed [m/s]. 2.0. 2.2. 2.4. 2.6. 0 20. 25. 30. 35 40 Agent Diameter [cm]. 45. 50. 55. F IGURE 3.12. Normalized error of the simulations for different values of the normal speed and agents diameter.. Grouping and herding were also subjected to the same sensitivity analysis, where the parameter that varies is the percentage of agents that have these behaviors. Figure 3.13 shows the normalized error in each of the buildings and the complete school for various percentages. The original simulations (base scenario), which are shown in Figures 3.10 and 3.11, correspond to 0%, with no social behaviors occurring. Both social behaviors have a much smaller impact on the results than the physical parameter shown in Figure 3.12, and there is also no clear percentage with a smaller error than the base case scenario, since the tendencies of the error curves of each building vary significantly. The only clear tendency in all the buildings is that a large percentage of agents having grouping behavior results in a greater error than the base case scenario. Tables with the complete results of the simulations on which the sensitivity analysis is based can be found in Appendix D.. 32.
(44) 2.4. 2.0. Humberstone Alianza Kingswood Victoria School. 2.2. 1.8. 1.6. 1.8. Normalized error. Normalized error. 2.0. Humberstone Alianza Kingswood Victoria School. 1.6 1.4. 1.4. 1.2. 1.2 1.0. 1.0 0.8. 0. 20. 40. 60 Grouping [%]. 80. 100. 0.8. 0. 20. 40. 60. 80. 100. Herding [%]. F IGURE 3.13. Normalized error of the simulations as a function of the percentage of agents that develop social behaviors.. 33.
(45) 4. CONCLUSIONS AND RECOMMENDATIONS. 4.1. Conclusions An agent based model was developed to simulate the human evacuation process during a real evacuation drill of a K-12 school. The differences between the simulations and the measured data during the drill are small, with an average error in the evacuation time of 5.9% and 1.0% for the four buildings and the complete school, respectively. The average error of the flow rates through stairs and exits is 13.6%. These results suggest that the model is good at predicting the evacuation in this case and could be used to: asses the vulnerability of building occupants to various hazards leading to evacuations such as earthquakes, tsunamis, and fires; optimize evacuation plans for buildings and all sort of structures; scale this model to full cities and interact with other means of evacuation; and even be considered at the design process of physical infrastructure. Measured data in the evacuation drill are the pre-evacuation times of students in a K-12 school, their flow-rates through doors (with a measured mean of 1.92 [people/second/meter]) and stairs (with a measured mean of 3.24 [people/second/meter]). The nominal velocity used to numerically model this evacuation drill was obtained from the literature, but it was validated by the measured data during this evacuation drill. The exact values used for the preferred velocities of agents were presented herein, while the measured values have a mean of µ = 1.45m/s, and the α and β parameters of the fitted Weibull distribution are 7.45 and 1.53, respectively. All these propositions support the idea that these models could be a complementary tool to evacuation drills in order to estimate evacuation times or other relevant data. The simulations are cheaper and more convenient to do sensitivity analysis on the critical evacuation variables. Moreover, the results show that a model like this could predict realistic evacuation patterns when the initial conditions and data from the literature are correctly selected. Nevertheless, simulations will never replace the pedagogical function that evacuation drills have on the behavior of people, i.e. what to do automatically, during an emergency.. 34.
(46) Some behavioral regimes and some social behaviors were modeled and studied by varying different model parameters. The results of the simulations show that evacuation response during a tsunami drill does not seem to be very affected due to these regimes and behaviors, and hence, in this particular case it does not seem to be important to be included in the model to obtain good results. Indeed, results not only do not improve but set even worse than the base case if the calibration of the regimes and behaviors is not done carefully. A parametric analysis was also performed on the preferred velocity and the plan view diameter of agents. Both variables show local optima in Figure 3.12, and both variables appear to be quite relevant for good modeling of the evacuation process. However, the preferred velocity seems to be more relevant than the diameter of agents in the case modeled. It was also observed that variations in the diameter of agents affected the results more as it increases and leads to an evacuation controlled by bottlenecks in the interaction with exits. Instead, as the agent’s diameter decreases evacuation is controlled by the maximum velocity of the people.. 4.2. Recommendations Some advice derived from this research experience and that could be of use to future research is summarized next: • It is of considerable importance to work with buildings that have all geometrical information available; otherwise the models will be sensitive to geometric errors. • To make it possible to measure average velocities and densities of agents, cameras should be located at the beginning and end of each stair, corridor, and exit. • The best camera position for tracing and counting, and building flow-rates is from the ceiling aiming to the floor. • During the field survey, a key piece of information is the width and length (i.e., the distance between the 2 cameras that record that specific space) of the corridors/stairs/exits. The first one is important to compute the standard flow-rate, and the second one to compute the velocity of people. 35.
(47) • Even though it is convenient for people who will be part of an evacuation drill to not know the exact moment of the drill, or even not know that an evacuation will take place, it is critical for the field researchers to have that information in order to be ready to turn on the cameras at the precise moment, locate them at the best possible place, and be at the right place during the drill. 4.3. Future work In future work, the agent based model developed should be extended in order to consider the interactive effects of an earthquake on the physical stock and the human agents; new social behaviors and agent states such as altruism should also be included, and economic losses due to the earthquake should also be estimated. A more statistical approach should be adopted in order to compute the Cumulative Distribution Function (CDF) of the relevant decision variables such as economic losses, evacuation times, injured people, and so forth. Another possible line of future research would be to extend the model to bigger scales, enabling it to consider evacuation of cities and work with networks like the educational, health, and public transportation network.. 36.
(48) REFERENCES. Arthur, W. B. (2006). Out-of-equilibrium economics and agent-based modeling. Handbook of computational economics, 2, 1551–1564. Axelrod, R. M. (1997). The complexity of cooperation: Agent-based models of competition and collaboration. Princeton University Press. Bateman, J. M., & Edwards, B. (2002). Gender and evacuation: A closer look at why women are more likely to evacuate for hurricanes. Natural Hazards Review, 3(3), 107–117. Benenson, I., & Torrens, P. M. (2004). Geosimulation: object-based modeling of urban phenomena. Computers, Environment and Urban Systems, 28(1), 1–8. Bonabeau, E. (2002). Agent-based modeling: Methods and techniques for simulating human systems. Proceedings of the National Academy of Sciences of the United States of America, 99(Suppl 3), 7280–7287. Brown, D. G., Riolo, R., Robinson, D. T., North, M., & Rand, W. (2005). Spatial process and data models: Toward integration of agent-based models and gis. Journal of Geographical Systems, 7(1), 25–47. Burstedde, C., Klauck, K., Schadschneider, A., & Zittartz, J. (2001). Simulation of pedestrian dynamics using a two-dimensional cellular automaton. Physica A: Statistical Mechanics and its Applications, 295(34), 507–525. Caplat, P., Anand, M., & Bauch, C. (2008). Symmetric competition causes population oscillations in an individual-based model of forest dynamics. Ecological Modelling, 211(3), 491–500. Chen, X., Meaker, J. W., & Zhan, F. B. (2006). Agent-based modeling and analysis of hurricane evacuation procedures for the Florida Keys. Natural Hazards, 38(3), 321–338. Chenney, S. (2004). Flow tiles. In Proceedings of the 2004 acm siggraph/eurographics symposium on computer animation (pp. 233–242). Chlieh, M., De Chabalier, J., Ruegg, J., Armijo, R., Dmowska, R., Campos, J., & Feigl, K. (2004). Crustal deformation and fault slip during the seismic cycle in the North Chile subduction zone, from GPS and inSAR observations. Geophysical Journal International, 158(2), 695–711. Crooks, A. T., Hudson-Smith, A., & Patel, A. (2011). Advances and techniques for building 3d agent-based models for urban systems. Advanced Geo-Simulation Models, 49. 37.
(49) Daamen, W., & Hoogendoorn, S. (2012). Emergency door capacity: influence of door width, population composition and stress level. Fire technology, 48(1), 55–71. Dawson, R. J., Peppe, R., & Wang, M. (2011). An agent-based model for risk-based flood incident management. Natural hazards, 59(1), 167–189. De Berg, M., Van Kreveld, M., Overmars, M., & Schwarzkopf, O. C. (2000). Computational geometry. Springer. Demchak, G., Dzambazova, T., & Krygiel, E. (2009). Introducing revit architecture 2009: Bim for beginners. John Wiley and Sons. Dijkstra, E. W. (1959). A note on two problems in connexion with graphs. Numerische mathematik, 1(1), 269–271. Epstein, J. M. (2002). Modeling civil violence: An agent-based computational approach. Proceedings of the National Academy of Sciences of the United States of America, 99(Suppl 3), 7243–7250. Epstein, J. M., & Axtell, R. (1996). Growing artificial societies: social science from the bottom up. The MIT Press. Fang, Z., Song, W., Zhang, J., & Wu, H. (2010). Experiment and modeling of exit-selecting behaviors during a building evacuation. Physica A: Statistical Mechanics and its Applications, 389(4), 815–824. Finnis, K., & Walton, D. (2007). Field observations of factors influencing walking speeds. In Proceedings of the 2 nd international conference on sustainability engineering and science, auckland (pp. 21–23). Fritz, H. M., Petroff, C. M., Catalán, P. A., Cienfuegos, R., Winckler, P., Kalligeris, N., . . . Synolakis, C. E. (2011). Field survey of the 27 February 2010 Chile tsunami. Pure and Applied Geophysics, 168(11), 1989–2010. Fujiyama, T., & Tyler, N. (2004). Pedestrian speeds on stairs: an initial step for a simulation model. In Proceedings of 36th universities transport studies group conference. Gardner, M. (1970). Mathematical games: The fantastic combinations of John Conway’s new solitaire game “life”. Scientific American, 223(4), 120–123. Gwynne, S., & Boswell, D. (2009). Pre-evacuation data collected from a mid-rise evacuation exercise. Journal of Fire Protection Engineering, 19(1), 5–29. Gwynne, S., Galea, E. R., & Lawrence, P. J. (2006). The introduction of social adaptation within evacuation modelling. Fire and Materials, 30(4), 285–309. 38.
(50) Gwynne, S., Galea, E. R., Lawrence, P. J., & Filippidis, L. (2001). Modelling occupant interaction with fire conditions using the buildingEXODUS evacuation model. Fire Safety Journal, 36(4), 327–357. Helbing, D. (1992). A fluid-dynamic model for the movement of pedestrians. Complex Systems, 6, 391–415. Helbing, D., Farkas, I., & Vicsek, T. (2000). Simulating dynamical features of escape panic. Nature, 407(6803), 487–490. Helbing, D., Farkas, I. J., Molnar, P., & Vicsek, T. (2002). Simulation of pedestrian crowds in normal and evacuation situations. Pedestrian and evacuation dynamics, 21, 21–58. Helbing, D., Johansson, A., & Al-Abideen, H. Z. (2007). Dynamics of crowd disasters: An empirical study. Physical review E, 75(4), 046109. Helbing, D., & Molnar, P. (1995). Social force model for pedestrian dynamics. Physical review E, 51(5), 4282. Henderson, L. (1971). The statistics of crowd fluids. Nature, 229, 381–383. Hostikka, S., Korhonen, T., Paloposki, T., Rinne, T., Matikainen, K., & Heliövaara, S. (2007). Development and validation of FDS+Evac for evacuation simulations. VTT RESEARCH. Hostikka, S., Paloposki, T., Rine, T., Saari, J., Horhonen, R., & Hellovaara, S. (2007). Evacuation experiments in offices and public buildings. VTT Technical Research entre of Finland, Espoo, Finland. Jain, S. K., & Pathak, S. (2012). Intensity based casualty models: Case study of bhuj and latur earthquake in india. In 15th World Conference on Earthquake Engineering, Lisbon, Portugal. Johnston, K. M. (2013). Agent analyst: agent-based modeling in arcgis. Redlands, CA: Esri Press. Jones, B. K., & Hewitt, J. A. (1986). Leadership and group formation in high-rise building evacuations. In Fire safety science - proceedings of the first international symposium (pp. 513–522). Hemisphere Publishing Corp. Kahneman, D. (2011). Thinking, fast and slow. Macmillan. Khazai, B., Daniell, J., Franchin, P., Cavalieri, F., Vangelsten, B., Iervolino, I., & Esposito, S. (2012). A new approach to modeling post-earthquake shelter demand: Integrating social vulnerability in systemic seismic vulnerability analysis. In 15th World Conference on 39.
Figure
Documento similar