Small mammals as indicators of cryptic plant species diversity in the central Chilean plant endemicity hotspot
12
0
0
Texto completo
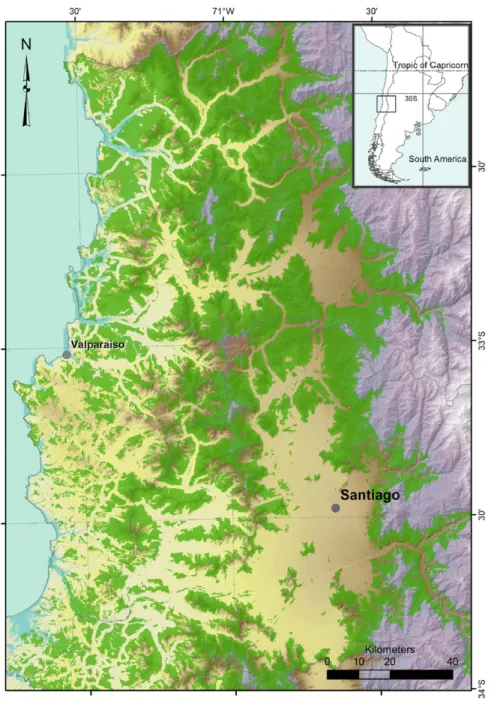
(2) 278. M. Root-Bernstein et al. / Global Ecology and Conservation 2 (2014) 277–288. heterogeneity in meadows (Jones et al., 2008). Small mammal activities such as grazing, trampling, and digging can alter herbaceous plant community composition (Davidson et al., 2012; Root-Bernstein and Ebensperger, 2013) via reduction in plant–plant competition (e.g. by opening colonizable space) and decrease in abiotic limitations (e.g. via nutrient input, water retention) (Kerley et al., 2004; Olff and Ritchie, 1998; Root-Bernstein, 2013; Wright and Jones, 2004). Whether these effects are net positive or negative is currently difficult to predict due to interactions between multiple variables (Root-Bernstein and Ebensperger, 2013). Thus, though some small mammals may be associated with high herbaceous plant diversity, this must be assessed individually for each mammal species, in each community in its range, and under the range of relevant abiotic conditions (Bakker et al., 2009, 2006; Root-Bernstein and Ebensperger, 2013). Where small mammals that make disturbances are associated with positive effects on plant diversity, they and their disturbances (burrows, mounds or runways) could make easily detectible indicators of diverse plant communities. The distributions of vertebrates are better known in Chile than those of plants (e.g. Tognelli et al., 2008), and would be feasible to monitor as indicators either through scientific surveys or collection of local ecological knowledge. However, the use of vertebrate species as compositional indicators of biodiversity has been critiqued (Carignan and Villard, 2002; Landres et al., 1988). Landres et al. (1988) recommend seven criteria that should be met in order to use vertebrates as indicator species. They recommend that vertebrate species be developed as indicators only when (1) goals are clear, (2) direct measurement of management variables is not possible, (3) selection criteria are explicit, (4) all selected species are used, (5) biology of the indicator is known in detail, with research carried out to determine how it affects or is affected by the environment, (6) subjectivity is recognized, and (7) the selection process is reviewed. Selecting indicators that detect diversity at appropriate management scales is also important (Carignan and Villard, 2002). Here, we address Landres et al.’s (1988) criterion (5), that the ecological interactions of the potential indicator species with its environment be well characterized and understood. We do so by investigating the relationship of native herbaceous plant diversity to the degu (Octodon degus), an endemic, non-threatened social rodent of central Chile (Patterson et al., 2007) known to favor certain plant populations and to have ecosystem engineering effects (Madrigal et al., 2011; Olivares and Gastó, 1971; Root-Bernstein et al., 2013). The relationship between degu disturbance activities and the herbaceous community composition and diversity in central Chile has not been studied previously. We address this gap in order to assess the degu’s suitability as an indicator of hard to recognize and little known, thus ‘‘cryptic’’ communities (sensu Pitt et al., 2012), of high plant diversity and high rates of endemicity to central Chile. 2. Material and methods 2.1. Study site and species The study took place at the Estación Experimental Rinconada de Maipú (33°23′ S, 70°31′ W, altitude 495 m), an agronomical field station owned by the Universidad de Chile, Santiago, Chile. Our study site encompassed a mosaic of espinal (Acacia caven savanna), open grasslands, and matorral (evergreen shrubland). This area is stocked at 0.92 sheep equivalents per ha over 898 ha. Dominant woody species in shrublands are Lithrea caustica, Baccharis marginales (evergreens) and Acacia caven and Proustia pungens (drought resistant, deciduous species). Degus (Octodon degus) live in burrows forming colonies >10000 m2 that can last for at least a decade (Ebensperger et al., 2011). Burrows used by different social groups are connected aboveground by well-marked runways forming a network between all burrow openings across the landscape. We take advantage of natural variation in degu disturbance densities to draw logical conclusions about degu effects on the plant community (Cleland, 2001; Rothman and Greenland, 2005). It is unlikely that degus selectively associate with factors that are themselves the direct or principal causes of significant changes in plant diversity. A recent multiple year study did not find any variables, including adjacent herbaceous cover or quality, that predicted burrow occupancy (Ebensperger et al., 2011). New burrows are formed primarily at the edges of the colony as it expands, with new runways forming only to connect new burrows or to reconnect burrows that have been abandoned for several years. Degus are generalist herbivores and forage along or near runways (Root-Bernstein and Ebensperger, accepted). Distinct plant community patches are sometimes clearly confined to the area within a runway (see Fig. 1). Inductively, this set of evidence strongly suggests that runway creation and uses cause changes in plant communities. Comparatively, degu colony patterns and dynamics appear to be very similar to those of prairie dogs, a species with a functionally equivalent niche (Davidson et al., 2012; Whicker and Detling, 1988). Changes in vegetation on prairie dog colonies are due to prairie dog herbivory and disturbance activities (Archer et al., 1987; Garrett et al., 1982). 2.1.1. Plot selection and characteristics Twenty plots of 10 m × 10 m were set up in June 2010 along the south facing slopes and adjacent plain of an extension of the coastal range (495 masl). We selected plots according to the degu runway and burrow densities, spaced at least 100 m from one another, using stratified random sampling (see Table 1). While our stratification with the lowest level of degu activity has zero burrows, we were not able to find a set of comparable habitat sites with no degu runways at all, due to the high abundance of degus and large extent of the colony..
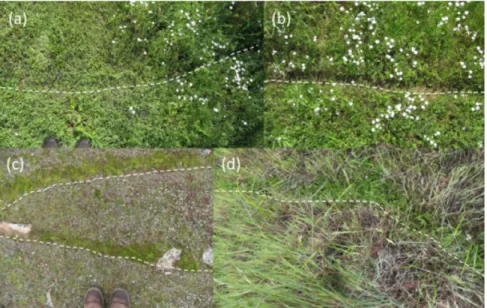
(3) M. Root-Bernstein et al. / Global Ecology and Conservation 2 (2014) 277–288. 279. Fig. 1. Four images of degu runways. Runways are marked with a dashed white line on the lower edge. (a) New runway, with plants trampled or pushed aside. (b) Established runway with bare earth in the runway. (c) Winter moss growing along established runways. (d) Early spring in a grassland, herbs growing along a runway which was likely formed during the previous year. Photos (c) MR-B. Table 1 Stratification was organized on the basis of burrow entrances per plot and subdivided according to runway abundance. The smaller extent of the core colony area with higher densities of disturbances meant that we could find fewer plots that were at least 100 m apart for stratifications 5 and 6. Mean runway abundance per plot: 8.95 SD 10.0. Mean burrow entrances per plot: 10.2 SD 8.6. As runways connect burrow entrances, their densities in plots were correlated (rS = 0.91, Spearman’s correlation). Stratification. Number of burrow entrances per plot. Mean number of runways per plot. Number of plots in stratification. 1 2 3 4 5 6. 0 (Null) <10 (Low) <10 (Low) 10–20 (Medium) 10–20 (Medium) 21–30 (High). 3 6.25 10.5 14 23 27. 4 4 4 4 1 3. 2.2. Independent variable selection We reviewed the existing literature on degus, small mammal effects on herb diversity, semi-arid and mediterraneanclimate shrub and savanna habitats in order to select independent variables that might explain herbaceous plant diversity. These included measures of degu soil disturbances, small herbivore presence, soil fertility parameters, and vegetation structure, all of which have been shown to be important factors in some systems for determining herbaceous community composition (Bakker et al., 2009, 2006; Holmgren et al., 2000; Root-Bernstein and Ebensperger, 2013; Wesche et al., 2007). Six sets of variables to explain herb species richness patterns were selected: (1) measures of degu disturbance intensity, including the number of degu runways per plot, mean runway spacing, measured as the mean of the distances between ten random points (the randomly placed plant samples) and the nearest degu runway to each point, the number of degu burrow entrances per plot, and degu feces counts. These measures were chosen to measure the intensity and distribution of various disturbance activities, which are more direct measures of degu impact on plant communities than the degu population size (Davidson et al., 2012; Whitford and Kay, 1999; Wilby et al., 2001). (2) Indirect measures of activity levels of other herbivorous and/or granivorous species present at the sites, as species interactions can have significant, and sometimes opposite, effects on plant communities (Olff and Ritchie, 1998). European rabbits and livestock are important herbivores in this ecosystem, which may have different effects on plant richness compared to degus due to their body size differences and different foraging strategies (Bakker et al., 2006). Rabbits live in warrens and make some runways, but much fewer than degus. Rabbits forage on woody seedlings and herbs over greater areas, farther from cover, than degus (Fuentes et al., 1983). The cururo, Spalacopus cyanus, is a fossorial non-social species that makes mounds as it moves across the landscape under the soil, foraging on bulbs (Contreras and Gutiérrez, 1991). These mounds are relatively ephemeral, disappearing after 1–2 years. Birds are also important granivores, as avian seed dispersal can affect shrub and possibly forb reproduction and distribution (Reid and Armesto, 2011). We measured these factors with feces counts of lagomorphs (primarily European rabbits, but possibly some hares Lepus europaeus), birds, cattle, and sheep. Feces also return nutrients to the soil, and thus all feces may directly affect soil parameters. To assess cururo presence we counted their mounds (Contreras and Gutiérrez,.
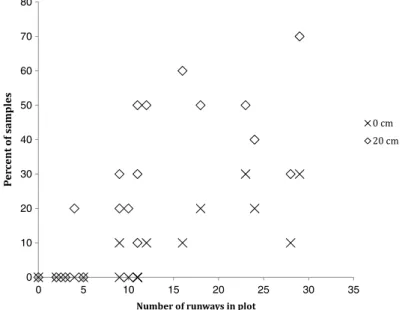
(4) 280. M. Root-Bernstein et al. / Global Ecology and Conservation 2 (2014) 277–288. Table 2 Independent variables collected in each plot. Variables with absolute values of correlation coefficients r > 0.400 were retained for general linear modeling. These are shown in bold. 7 variables were used for the August data, and 8 for the October data. Variable. Description. Pearson correlation to herb diversity (r) August data. Pearson correlation to herb diversity (r) October data. Runway spacing. Distance from each randomly placed sampling frame (N = 10) to the nearest runway, with mean taken at the plot scale Slope of the site in degrees Percent canopy cover of shrubs and trees at 2 m above the ground Number of trees Number of cururo mounds (Spalacopus cyanus) Number of cow and sheep feces combined Concentration of available nitrogen in the soil % organic material in the soil Concentration of NO3 in the soil Carbon/nitrogen ratio in the soil Percent canopy cover of shrubs and trees at 1 m above the ground Concentration of NH4 in the soil Number of shrubs Direction of the slope faces in degrees Number of lagomorph feces Number of degu entrances Concentration of phosphorous in the soil Number of degu feces Number of degu runways Number of bird feces. −0.746. −0.570. −0.410 −0.313 −0.274 −0.206 −0.202 −0.139 −0.131. −0.292 −0.525 −0.419 −0.161 −0.326 −0.149 −0.119. 0.105 0.226 0.294 0.299 0.334 0.340 0.346 0.455 0.537 0.542 0.630 0.636. 0.106 0.162 0.267 −0.240 0.428 0.493 0.381 0.331 0.358 0.459 0.536 0.604. Slope 2 m canopy Trees Mounds Livestock feces N-Disp MO N-NO3 C/N 1 m canopy N-NH4 Shrubs Aspect Lagomorph feces Entrances P Degu feces Runways Bird feces. 1991); (3) The number of individuals and cover of shrubs and trees (Gutiérrez and Squeo, 2004); (4) Variables related to soil fertility, including percent organic matter in the soil, concentration of available nitrogen, NO3 , NH4 , and phosphorous, and the soil carbon/nitrogen ratio (Chesworth, 2008); (5) Local landscape factors including the slope and aspect of each plot (Armesto and Martínez, 1978). Because of the uncertainty surrounding the relative importance of these variables in different habitat types and climates, we initially overselected variables and then reduced the number through pairwise correlations before model building (see below). All initially considered variables are summarized in Table 2. 2.3. Data collection Plots were sampled for independent variables once (spring 2010), and for the dependent variable (herbaceous plant diversity) twice, in order to assess whether the plant community showed significant turnover during a single growing season, including early spring 2010 (31 August–1 September = ‘‘August’’) and late spring 2010 (4–6 October = ‘‘October’’). 2.3.1. Herbaceous vegetation Sampling consisted of placing a 20 cm × 20 cm plastic frame at 10 random locations within each plot. The samples were recorded by taking photographs with a digital camera in autofocus mode from 1 m above the ground. We did not sample under shrub and tree canopies since there is a strong microclimate effect on plant composition directly below canopies, and also due to the spiny branches reaching nearly to ground level, making the under-canopies inaccessible. Fig. 2 shows the percent of randomly placed vegetation samples 0 and 20 cm from degu runways as a function of runway abundance per plot. 2.3.2. Degu runways and burrow entrances, S. cyanus burrow entrances Degu runways and burrow entrances, and cururo (S. cyanus) burrow entrances were counted on each 10 m × 10 m plot in June 2010. Degu runways are discrete linear features 8 to 10 cm wide and between approximately 0.5 to 30 m long, beginning and almost always ending at burrow entrances. A single runway was thus defined as a linear feature connecting two burrow entrances, or beginning at a burrow entrance and fading away. Plots were checked in August and October for changes in these variables. The only changes in plots observed between August and October were in the number of cururo burrows, which increased slightly in two plots due to cururo foraging movements. We calculated the mean runway spacing using the data on distances from each random vegetation sample to the nearest runway (see Fig. 2). Thus, the estimates of runway spacing differed slightly, but non-significantly, between the August and October datasets (r = 0.869, p < 0.0001, Pearson correlation). 2.3.3. Feces of degus, lagomorphs, birds and ungulates In October 2010 fresh feces were counted along three transects in each plot. Two-meter wide transects were set up centered at 2.5, 5, and 7.5 m from one side, selected arbitrarily, of the 10 m × 10 m plots. Fresh feces of degus, lagomorphs, birds, cattle and sheep were counted along transects. Counts of each type of feces were totaled across the three transects in.
(5) M. Root-Bernstein et al. / Global Ecology and Conservation 2 (2014) 277–288. 281. 80 70 60 50 40 30 20 10 0 0. 5. 10. 15. 20. 25. 30. 35. Fig. 2. Coverage of areas near to degu runways by random sampling in August 2010. Coverage for October is not shown. Open diamonds represent the percent of samples in a given plot within 20 cm of a degu runway. Black points show the percent of samples in a given plot touching or including a runway. Note that the black points are the subset of the data shown by open diamonds. As one might expect, as the number of runways per plot increases, the number of random samples on or near a runway increases, although clumping of runways means that it is not perfectly linear.. each plot to yield an estimate of species’ cumulative activity in each plot over a time period of up to a year (Palomares, 2001; Jaksic et al., 1979). We sampled feces only once because (1) feces decay over long, but difficult to estimate time frames; the single sample thus covers the whole period of the study, while two samples could be pseudoreplicated; and (2) because habitat structure, conspecific density and predator density, the main determinants of small mammal foraging patterns over space, are unlikely to have changed significantly during the course of the study (Jensen et al., 2003; Lagos et al., 1995). This is likely to be the case for birds as well (S. Reid pers. comm.). 2.3.4. Woody cover, shrub and tree abundance, and slopes In June 2010 shrub and tree abundances in each plot were counted. In February 2011, these values were checked (with no observed changes) and woody plant canopy cover at 1 and 2 m above the ground was estimated in each plot. Additionally the slope and aspect (direction the slope faces) of the terrain were measured. 2.3.5. Soil fertility To measure soil fertility, soil samples (first 10 cm depth) weighing approximately 100 g each were taken from two random points within each 10 m × 10 m plot, for a total of 40 samples. We did not sample under shrub canopies. Feces, fresh plant material, litter and stones were excluded from the samples. Soil samples were stored in plastic bags at 5–8 °C for two days and then transported to the Laboratory of Soils at the Universidad de Concepción for further analysis. The samples were assayed for percent organic matter, total and available nitrogen concentration, total phosphorous concentration, and carbon-to-nitrogen ratio. For details of the methods employed, see Sadzawka et al. (2006). A mean for each variable was calculated for each 10 m × 10 m plot. Due to the cost of soil analysis, we limited the number of soil samples that could be processed, and we were concerned that we might have undersampled soil heterogeneity. We examined the data for evidence of undersampling. If there were soil nutrient upper and lower ranges that we did not sample systematically, these should appear as outliers. Additionally, we compared the ranges of our dataset to published ranges in similar semi-arid habitats (Evans and Ehleringer, 1994; Lechmere-Oertel et al., 2005; Schlesinger et al., 1996; Schlesinger and Pilmanis, 1998; Sneva, 1977). Although nitrate, ammonium and available nitrogen data had one outlier each, their ranges of values appeared to be similar to published studies where range was reported. This suggests that these were true outliers. P concentration had no outliers, but the range was broader than reports from other semi-arid shrublands. Although the difference between samples in each plot varied, there were greater differences between plots than within plots. This suggests that P concentration varied more between plots at the 100 m2 scale than within plots. We are therefore reasonably confident that we did not undersample soil fertility variables. 2.4. Calculating plant diversity Plant identification relied on Hoffmann (1998), Navas Bustamante (1979), and the websites www.chileflora.com and www.florachilena.cl. Plants were identified to species level (see Table 3). We were not reliably able to distinguish between.
(6) 282. M. Root-Bernstein et al. / Global Ecology and Conservation 2 (2014) 277–288 Table 3 Results of the general linear model of herbaceous plant diversity in August. Residual standard error: 0.4259 on 16 degrees of freedom. Note that runway spacing has a negative t value because as runway spacing declines (= runway density increases), herbaceous diversity increases. Estimate Intercept Runway spacing Bird feces P × slope. 1.0563013. −0.1237590 0.0180276 0.0008082. Standard error 0.2511762 0.0370738 0.0085860 0.0005817. t value 4.205. −3.338 2.100 1.389. p value 0.000671 0.004170 0.051975 0.183779. the endemic forbs Conanthera campanulata, Conanthera bifolia,and Leucocoryne ixioides since the study occurred before they flower and their leaves are similar. These three endemic forbs were thus counted as one group. We were also not able to reliably identify grass species, as the seedheads had not been formed at the time of the study. The two most common species appeared to be annual grasses Bromus berterianus (native) and Vulpia bromides (non-native). The four grass taxa present were counted in one category. R Plants were identified in SamplePoint⃝ , which records the classification into user-defined categories of pixels in digital photographs at crosshairs arranged in a regular grid over the digital photograph (Booth and Cox, 2011). We set our grid to 100 crosshairs per photo, the equivalent of one pin per 4 cm2 in a pin-point sampling protocol (Jonasson, 1983). Dead plants were not counted. When plants overlapped, we counted the top (visible) species only. Overlap occurred only rarely (estimated < 10% of all crosshairs) due to the absolute low density of plant species in this habitat. This gives a relative, not absolute, measure of abundances. 20 cm × 20 cm frame data was pooled (added) for each plot. Adding rather than taking the mean allowed rare species to be counted, and all counts to be integer numbers. Species richness was calculated as the total number of species recorded per 10 m × 10 m plot. Shannon’s diversity index was calculated in R version 2.15.2 using the diversity function in the vegan library, and based on calculated species abundances and total frequencies per plot. 2.5. Model testing All data was considered at the 10 m × 10 m plot scale. Each floral sampling period was analyzed independently to deal with temporal pseudoreplication when a time series would not be appropriate (i.e. only two time periods) (Crawley, 2005). Prior to statistical model-building, we used pair-wise correlations between the dependent variable (herb diversity) and the independent variables to exclude over half of the potential independent variables (Table 2). We thus used up to 8 variables to construct models. Next, we ran general linear models in R version 2.15.2 using the lm function. We fitted fixed effects models, as our independent variables did not vary in time. We did not examine all possible factor interactions but selectively considered ecologically plausible ones. We first selected the models with the most significant variables. We then selected the model with the highest F statistic value, meaning that this model explains the largest amount of change in our measure of herb diversity (F is a measure of effect size (Rosenberg et al., 2000)). We used this criterion because the goal of this study is to provide information that can be used to identify areas of highest diversity. To estimate how herb diversity would change if we could identify the very abundant grass taxa, we examined what would happen if we assumed that each grass taxon’s abundance was one-fourth the total abundance for grasses in each plot, i.e. that grasses were as diverse as possible in each plot. This represents the maximal possible difference in calculated diversity. 2.6. Mapping predicted areas of potential high native and endemic floral diversity We used data from CONAF and CIREN (2013) to map areas of similar habitat structure and climate to the study site. We excluded canopy forest, agricultural and urban land, where degus are unlikely to be found and the plant community is different. We also excluded from the mapped area a buffer of 500 m around all roads, whose locations were obtained from MOP (2006), because in this buffer area, invasive plants are likely to have the highest abundances or richnesses due to human disturbance (pers. comm. G. Montenegro; Arroyo et al., 2000; Figueroa et al., 2011). Also, we included only those areas below 2000 masl, according to the degu’s distribution from Redford and Eisenberg (1992), from Shuttle Radar Topographic Mission (SRTM) at a resolution of 90 m (Rabus et al., 2003) within the degu’s range in the administrative regions of Valparaiso and Metropolitana. 3. Results 3.1. Explaining plant species diversity We first compared plant diversity to degu disturbance densities across the plot stratifications (Table 1; F = 8.107, df = 1, 18, p = 0.011, ANOVA). Highest herb diversity was observed for high density of runways (>19/100 m2 ) but medium.
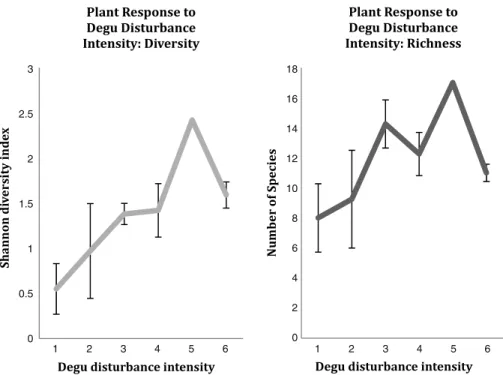
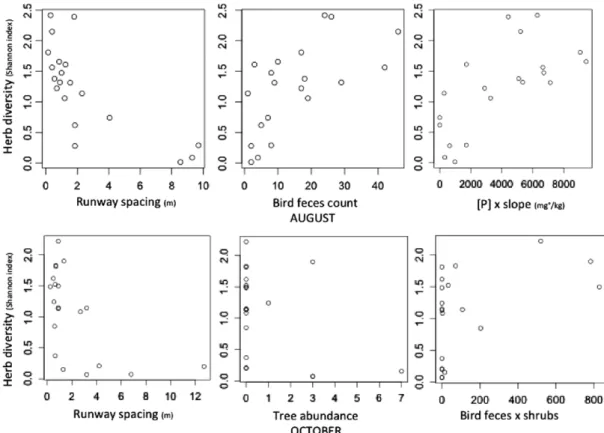
(7) M. Root-Bernstein et al. / Global Ecology and Conservation 2 (2014) 277–288. 3. 283. 18 16. 2.5 14 12. 2. 10 1.5 8 6. 1. 4 0.5 2 0. 0 1. 2. 3. 4. 5. 6. 1. 2. 3. 4. 5. 6. Fig. 3. Plant taxa diversity and richness as a function of degu disturbance intensity, measured as plot stratification (means ± SE). The lower stratifications have lower levels of degu disturbances (burrows and runways; see Table 1). Table 4 Results of the general linear model of herbaceous plant diversity in October. Residual standard error: 0.4592 on 16 degrees of freedom. Note that runway spacing has a negative t value because as runway spacing declines (= runway density increases), herbaceous diversity increases. Estimate Intercept Runway spacing Trees Bird feces × shrubs. 1.3101043. −0.1085500 −0.1508668 0.0010309. Standard Error. t value. 0.1510762 0.0362444 0.0582385 0.0004107. −2.995 −2.591. 8.672. 2.510. p value 1.92e−07 0.00857 0.01972 0.02319. density of entrances (10–19/100 m2 ). See Fig. 3. The range of sampled species richness per plot was between 1 and 17 species. The mean sampled abundance of grasses per plot was 322.65 ± 72 (SE) individuals, while the mean sampled abundance for all forbs together was 8.9 ± 4.7 (SE) individuals. The mean percent bare ground sampled per plot was 11.6 ± 2.6% (SE). We then applied a general linear model to assess how much of plant diversity was explained by degu disturbances vs. other variables. We report overall model statistics; statistics for individual variables are summarized in Tables 3 and 4. In August, the best model for plant diversity included the following variables: mean runway spacing, bird feces, and the interaction of phosphorous concentration with slope (overall model p = 0.0001, F = 12.48, df = 3, 16, r 2 = 0.70; see Table 3). Diversity was higher on lower slopes with higher phosphorous concentration. In October, the best model included mean runway spacing, woody canopy cover at 2 m, and the interaction between bird feces and shrub abundance (overall model, p = 0.0012, F = 8.731, df = 3, 16, r 2 = 0.71; see Table 4). Woody canopy at 2 m above the ground corresponds to tree canopy cover, and was negatively related to herb diversity. Herb diversity increased along with bird feces and shrub abundance. See Fig. 4. 3.2. Herbaceous plant community For a list of identified plant species, see Table 5. There was no evidence of the existence of more than one herbaceous community type, as less-rich plot communities were subsets of richer plot communities. In total, we observed four times as many endemic and native forb species (N = 16) as non-native forb species (N = 4). Native refers to species that have native distributions in central Chile, but are not endemics of central Chile. The mean abundances of non-native forbs across all plots were not greater than the mean abundances of native and endemic forbs (t = −1.002, df = 3.115, p = 0.39, Welch Two Sample t-test). Grasses represented a mean of 67% of herb abundance across plots. When we considered grasses as four taxa evenly distributed (maximally diversified) across the total grass population in each plot, diversity increased across plots (t = −5.82, df = 19, p < 0.0001, paired t-test), but remained correlated to our estimate of diversity incorporating grasses.
(8) 284. M. Root-Bernstein et al. / Global Ecology and Conservation 2 (2014) 277–288. Fig. 4. Individual correlations between the significant variables explaining herb diversity.. Table 5 A list of non-grass herbaceous species observed at the research site. N = native to South America, E = endemic to Central Chile, I = non-native or invasive. Calceolaria hypericina, Urtica magellanicus, and Zoellnerallium andinum were infrequent and not counted in any of the frame samples. There were four grass taxa present, which were not identified to species level. Species. Distribution. Amsinckia hispida Boranginaceae sp. Calceolaria hypericina Clarkia tenella Conanthera campanulata Conanthera bifolia Dioscorea sp. Epilobium sp. Erodium circutarium Erodium moschatum Fumaria capreolata Godetia cavanillesi Haplopappus scorbiculatus Leuceria cerberoana Leucocoryne ixiodes Madia chilensis Marrubium vulgare Oxalis micrantha Oxalis rosea Pastithaea coerulea Senecio adenotrichius Urtica magellanicus Zoellnerallium andinum. N E E E E E E E I I I E E E E E I E E E E E E. as a single taxon (r = 0.74, p = 0.0001, Pearson correlation). However, we were more interested in the share of forb diversity, since grasses declined and forbs increased with degu activity. Consequently we retained the estimate of diversity counting grass as a single taxon throughout the rest of the analyses..
(9) M. Root-Bernstein et al. / Global Ecology and Conservation 2 (2014) 277–288. 285. Fig. 5. In green, the predicted areas of potential degu habitat within the degu’s range, and within the similar climate zone to the study site, in the Metropolitana and Valparaiso administrative regions. We predict that within the green area, there will be areas of high diversity of endemic herbaceous plants, which could be targeted for conservation. (For interpretation of the references to color in this figure legend, the reader is referred to the web version of this article.). Herb species diversity did not deviate significantly from normality (K–S tests: August, p = 0.79; October, p = 0.25). Herb species richness was higher in August, with a mean of 2.7 more species present in each plot (p = 0.0011, t = 3.84, df = 19, paired t test). We did not see evidence of species replacement between August and October, so the difference may be due to species die-off. 3.3. Mapping potential areas of native and endemic plant diversity Fig. 5 illustrates the predicted area obtained for potential native and endemic plant distribution in the Metropolitana and Valparaiso administrative regions. A final area of 11 476.41 km2 of grassland and matorral land-use category was identified. Three main land cover classes were found inside this area, Grassland Scrubland: Very open Scrubland (1869 km2 ), Grassland Scrubland: Semidense Scrubland (1941 km2 ) and Grassland Scrubland: Open Scrubland (2946 km2 )..
(10) 286. M. Root-Bernstein et al. / Global Ecology and Conservation 2 (2014) 277–288. As can be seen in the map, the potential distribution of native and endemic plant distribution is larger and less fragmented to the north of the study area. To the south of the area we consider, we observe more urbanization and agricultural lands, while the largest amount of forest was observed in the southwest of the considered area. 4. Discussion This study provides information supporting the process of selecting indicator species for herbaceous plant diversity in central Chile by providing background on the ecological interactions between the plant community and possible indicator species (Landres et al., 1988). While degu disturbances showed the highest effect sizes, our results highlight the additional importance of shrubs and birds as positive indicators of endemic herb diversity. Bird species whose feces was detected included Passeriforms, such as Formicariidae, Rhinocryptidae, Tyrannidae, Mimidae, and Thraupidae (see a list of bird species observed at the same site in Root-Bernstein et al., 2013). Birds preferentially forage in degu colonies and contribute to shrub seed dispersal (Root-Bernstein et al., 2013). Thus, these potential indicators are linked ecologically. We found a large majority of endemic herbaceous plants at our site. Espinal and matorral sites, the typical habitat of degus, were both the richest in native vascular species in a recent study in central Chile, although the abundances and cover of non-native species were higher (Figueroa et al., 2011). However, that study considered woody species as well as forbs and grasses, and did not report on the presence or absence of degus at the studied sites. In this study, native/endemic and nonnative forbs had similar abundances on average. Native plants are likely to have co-evolved with the native soil-disturbing and grazing small mammals (Hobbs and Huenneke, 1992). By contrast non-native herbs may be favored by non-native herbivores, including rabbits and livestock, both of which were present but at low densities on our site (Holmgren et al., 2000; Simonetti, 1983). Degus appear to favor the spread of non-native plants only when those are released from abiotic constraints. In a study in a more arid region, Madrigal et al. (2011) show that degu activities facilitate the spread of invasive herbs in wet years, but that in dry years invasive cover always returns to less than 5%. Our study does not capture this temporal fluctuation, but as it occurred in a dry La Niña year (2010), these data can be taken as describing the baseline interaction between degus, shrubs, bird activity and floral diversity in the less-arid mediterranean zone. Degu colonies, shrubs, and to some extent birds, are easy for members of the public to identify and count, and could thus be incorporated into collaborative public monitoring programs (Jordan et al., 2012). The espinal/matorral habitats studied here are popularly regarded as ‘‘empty’’ of biodiversity and lacking conservation value. In the Chilean context, one way to conserve habitats with remnants of endemic flora, and to manage them to mitigate potentially negative factors (e.g. rabbits), is through private protected area creation (Ladle et al., 2013; Pauchard and Villarroel, 2002). However, the low cultural valuation of these habitats means that they are likely to be ignored for private protected area development, despite evidence of high endemic vascular plant communities (Figueroa et al., 2011), unless their biodiversity value can be seen and appreciated by landowners themselves (Kabii and Horwitz, 2006; Root-Bernstein and Armesto, 2013). The degu is also relatively locally charismatic (Root-Bernstein and Armesto, 2013) and in addition to having an indicator function, could take on a role as an ambassador for private protected area uptake. Our map (Fig. 3) shows a larger area of potential distribution of endemic herbs to the north of Santiago (which is immediately east of the study site). This appears to be mainly related not only to the lack of forest and urbanization in that area, but also to the bioclimatic conditions of this zone. As there is no fine-scale database on the actual distribution of degu colonies, some small mapped fragments in the south of the potential distribution may not have any degu colonies, while the continuous area to the north may in fact be more fragmented than it appears. We map only the potential distribution of endemic herbs associated with degus, and not other endemic herbs. We do not have a full list of all herbaceous plants associated with degu colonies, so it is unclear what proportion of the endemic non-woody floral community this represents. Low overlap (∼5 spp, mainly invasives) between the species list for our site and other sites for which full species lists of herbaceous plants have been reported (e.g. Diel et al., 2007, Figueroa et al., 2004, Holmgren et al., 2000) suggests high species turnover, mainly of native and endemic species, across central Chile. For this reason it is difficult to say what percent of the native herbaceous flora may be associated with degu colonies at different sites. Mapping of degu colonies and surveys of their flora across the area predicted in Fig. 3 would address this data shortfall. The surprisingly large area of the potential deguassociated endemic herb distribution shows that it may not be too late to conserve plant communities of global significance, despite ongoing expansion of agriculture in the region (Schulz et al., 2010). The outcomes of this study are (1) the proposal that colonies of degu Octodon degus should be considered for adoption as an indicator of diverse native and endemic plant communities, and (2) the identification of geographical areas where the suitability of the degu as an indicator can be tested, and where potential private conservation actions should be encouraged. Developing easily recognizable indicators of ‘‘cryptic’’ but globally significant endemic biodiversity should be prioritized to facilitate local participation by landowners and other stakeholders in identifying key areas for conservation in drylands and other under-appreciated landscapes (Jordan et al., 2012; Pitt et al., 2012). Acknowledgments Many thanks to the following people who gave helpful advice and assistance: several anonymous reviewers, P. Jepson, J. Firn, M. Stewart, C. Muñoz, C. León, M. Carmona, A. Gaxiola, M. Bustamante, S. Reid, L. Galvez Bravo, P. Bozinovic, and F..
(11) M. Root-Bernstein et al. / Global Ecology and Conservation 2 (2014) 277–288. 287. Jaksic. Funding for soil analysis was obtained from FONDAP through CASEB (Program 1). M.R.-B. was supported by a doctoral fellowship from CONICYT (No. 63105446). References Archer, S., Garrett, M.G., Detling, J.K., 1987. Rates of vegetation change associated with prairie dog (Cynomys ludovicianus) grazing in North American mixed-grass prairie. Vegetatio 72, 159–166. Armesto, J.J., Martínez, J.A., 1978. Relations between vegetation structure and slope aspect in the mediterranean region of Chile. J. Ecol. 66, 881–889. Arroyo, M.T.K., Maricorena, C., Matthei, O., Cavieres, L.A., 2000. Plant invasions in Chile: present patterns and future predictions. In: Mooney, H.A., Hobbs, R.J. (Eds.), Invasive Species in a Changing World. Island, Washington, pp. 395–421. Bagchi, S., Namgail, T., Ritchie, M.E., 2006. Small mammalian herbivores as mediators of plant community dynamics in the high-altitude arid rangelands of Trans-Himalaya. Biol. Cons. 127, 438–442. Bakker, E.S., Olff, H., 2003. Impact of different-sized herbivores on recruitment opportunities for subordinate herbs in grasslands. J. Veg. Sci. 14, 465–474. Bakker, E.S., Olff, H., Gleichman, J.M., 2009. Contrasting effects of large herbivore grazing on smaller herbivores. Basic Appl. Ecol. 10, 141–150. Bakker, E.S., Ritchie, M.E., Olff, H., Milchunas, D.G., Knops, J.M.H., 2006. Herbivore impact on grassland plant diversity depends on habitat productivity and herbivore size. Ecol. Lett. 9, 780–788. Booth, D.T., Cox, S.E., 2011. Art to science: tools for greater objectivity in resource monitoring. Rangelands 33 (4), 27–34. Carignan, V., Villard, M.-A., 2002. Selecting indicator species to monitor ecological integrity: A review. Environ. Monit. Assess. 78, 45–61. Chesworth, W. (Ed.), 2008. Encyclopedia of Soil Science. Springer, The Netherlands. Cleland, C.E., 2001. Historical science, experimental science, and the scientific method. Geology 29, 987–990. CONAF & CIREN 2013, Monitoreo de cambios, corrección cartográfica y actualización Catastro de Bosque Nativo en regiones Metropolitana, Valparaíso, Libertador Bernardo O’Higgins. Centro de Información de Recursos Naturales and Departamento de Monitoreo de Ecosistemas Forestales Corporación Nacional Forestal, Chile. Contreras, L.C., Gutiérrez, J.R., 1991. Effects of the subterranean herbivorous rodent Spalacopus cyanus on herbaceous vegetation in arid coastal Chile. Oecologia 87, 106–109. Crawley, M.J., 2005. Statistics: An Introduction Using R. John Wiley and Sons, Ltd, New York. Davidson, A.D., Detling, J.K., Brown, J.H., 2012. Ecological roles and conservation challenges of social, burrowing, herbivorous mammals in the world’s grasslands. Front. Ecol. Environ. 10 (9), 477–486. Diel, U., Álvarez, M., Paulini, I., 2007. Native and non-native species in annual grassland vegetation in Mediterranean. Chile Phytocoenol. 37 (3–4), 769–784. Ebensperger, L.A., Chesh, A.S., Castro, R.A., Ortiz Tolhuysen, L., Quirici, V., Burger, J.R., Sobrero, R., Hayes, L.D., 2011. Burrow limitations and group living in the communally rearing rodent, Octodon degus. J. Mammal. 92, 21–30. Evans, R.D., Ehleringer, J.R., 1994. Water and nitrogen dynamics in an arid woodland. Oecologia 99, 233–242. Figueroa, J.A., Castro, S.A., Marquet, P.A., Jaksic, F.M., 2004. Exotic plant invasions to the mediterranean region of Chile: causes, history and impacts. Rev. Chil. Hist. Nat. 77, 465–483. Figueroa, J.A., Teillier, S., Castro, S.A., 2011. Diversity patterns and composition of native and exotic floras in Central Chile. Acta Oecol. 37 (2), 103–109. Fuentes, E.R., Jaksic, F.M., Simonetti, J.A., 1983. European rabbits versus native rodents in central Chile: Effects on shrub seedlings. Oecologia 58 (3), 411–414. Garrett, M.G., Hoogland, J.L, Franklin, W.L., 1982. Demographic differences between an old and a new colony of black-tailed prairie dogs (Cynomys ludovicianus). Am. Midland Natur. 108 (1), 51–59. Gutiérrez, J.R., Squeo, F.A., 2004. Importancia de los arbustos en los ecosistemas sermiáridos de Chile. Ecosistemas 13 (1), 36–45. Hobbs, R.J., Huenneke, L.F., 1992. Disturbance, diversity, and invasion: Implications for conservation. Cons. Biol. 6 (3), 324–337. Hoffmann, A., 1998. Flora Silvestre de Chile: Zona Central. Fundación Claudio Gay, Santiago, Chile. Holmgren, M., Avilés, R., Sierralta, L., Segura, A.M., Fuentes, E.R., 2000. Why have European herbs so successfully invaded the Chilean matorral? Effects of herbivory, soil nutrients, and fire. J. Arid Environ. 44, 197–211. Jaksic, F.M., Fuentes, E.R., Yañez, J.L., 1979. Spatial distribution of the old world rabbit (Oryctolagus cuniculus) in central Chile. J. Mammal. 60 (1), 207–209. Jensen, S.P., Gray, S.J., Hurst, J.L., 2003. How does habitat structure affect activity and use of space among house mice? Anim. Behav. 66, 239–250. Jonasson, S., 1983. The point intercept method for non-destructive estimation of biomass. Phytocoenologia 11, 385–388. Jones, C.C., Halpern, C.B., Niederer, J., 2008. Plant succession on gopher mounds in western Cascade meadows: consequences for species diversity and heterogeneity. Am. Midland Natur. 159, 275–286. Jordan, R.C., Ballard, H.L., Phillips, T.B., 2012. Key issues and new approaches for evaluating citizen-science learning outcomes. Front. Ecol. Environ. 10 (6), 307–309. Kabii, T., Horwitz, P., 2006. A review of landholder motivations and determinants for participation in conservation covenanting programmes. Environ. Cons. 33 (1), 11–20. Kerley, G.I.H., Whitford, W.G., Kay, F.R., 2004. Effects of pocket gophers on desert soils and vegetation. J. Arid Environ. 58, 155–166. Ladle, R.J., Bragagnolo, C., Gama, G.M., Malhado, A.C.M., Root-Bernstein, M., Jepson, P., 2013. Private protected areas: Three key challenges. Environ. Cons. 1–2. FirstView. Lagos, V.O., Contreras, L.C., Meserve, P.L., Gutiérrez, J.R., Jaksic, F.M., 1995. Effects of predation risk on space use by small mammals, a field experiment with a Neotropical rodent. Oikos 74, 259–264. Landres, P.B., Verner, J., Thomas, J.W., 1988. Ecological uses of vertebrate indicator species: a critique. Cons. Biol. 2 (4), 316–328. Lechmere-Oertel, R.G., Cowling, R.M., Kerley, G.I.H., 2005. Landscape dysfunction and reduced spatial heterogeneity in soil resources and fertility in semiarid succulent thicket, South Africa. Austral Ecol. 30, 615–624. Madrigal, J., Kelt, D.A., Meserve, P.L., Gutiérrez, J.R., Squeo, F.A., 2011. Bottom-up control of consumers leads to top-down indirect facilitation of invasive annual herbs in semiarid Chile. Ecology 92 (2), 282–288. MOP, 2006. Cartografía Caminera Regiones de Valparaíso, Metropolitana. Ministerio de Obras Públicas, Chile. Myers, N., Mittermeier, R.A., Mittermeier, C.G., da Fonseca, G.A.B., Kent, J., 2000. Biodiversity hotspots for conservation priorities. Nature 403, 853–859. Navas Bustamante, L.E., 1979. Flora de la cuenca de Santiago de Chile, Tomo III. Ediciones de la Universidad de Chile, Santiago. Olff, H., Ritchie, M.E., 1998. Effects of herbivores on grass land plant diversity. Tree 13, 261–265. Olivares, A., Gastó, J., 1971. Comunidades de terofitas en subseres postaradura y en exclusión en la estepa de Acacia caven. Philos. Bol. Tec. Est. Exper. Agron. Univ. Chile Fac. Agron. 34, 3–24. Palomares, F., 2001. Comparison of 3 methods to estimate rabbit abundance in a mediterranean environment. Wildlife Soc. Bull. 29 (2), 578–585. Patterson, B.D., Ceballos, G., Sechrest, W., Tognelli, M.F., Brooks, T., Luna, L., Ortega, P., Salazar, I., Young, B.E., 2007. Digital Distribution Maps of the Mammals of the Western Hemisphere, Version 3.0. NatureServe, Arlington, Virginia, USA. Pauchard, A., Villarroel, P., 2002. Protected areas in Chile: History, current status, and challenges. Nat. Areas J. 22, 318–330. Pitt, A.L., Baldwin, R.F., Lipscomb, D.J., Brown, B.L, Hawley, J.E., Allard-Keese, C.M., Leonard, P.B., 2012. The missing wetlands: using local ecological knowledge to find cryptic ecosystems. Biodiversity Cons. 21, 51–63. Rabus, B., Eineder, M., Roth, A., Bamler, R., 2003. The shuttle radar topography mission – a new class of digital elevation models acquired by spaceborne radar. ISPRS J. Photogramm. Remote Sens. 57, 241–262. Redford, K., Eisenberg, J.F., 1992. Mammals of the Neotropics, Volume 2: The Southern Cone: Chile, Argentina, Uruguay, Paraguay. University of Chicago Press, Chicago, USA. Reid, S., Armesto, J.J., 2011. Avian gut-passage effects on seed germination of shrubland species in Mediterranean central Chile. Plant Ecol. 212, 1–10..
(12) 288. M. Root-Bernstein et al. / Global Ecology and Conservation 2 (2014) 277–288. Root-Bernstein, M., 2013. Predicting the direction and magnitude of small mammal disturbance effects on plant diversity across scales. Front. Biogeography 5 (2), 113–121. Root-Bernstein, M., Armesto, J., 2013. A flagship fleet for central Chile: Proposal and implementation. Ambio 42 (6), 776–787. Root-Bernstein, M., Ebensperger, L.A., 2013. Meta-analysis of the effects of small mammal disturbances on species diversity, richness and plant biomass. Austral Ecol. 38, 289–299. Root-Bernstein, M., Ebensperger, L.A., 2014. What are degu (Octodon degus) runways for? PLoS One (accepted). Root-Bernstein, M., Fierro, A., Armesto, J., Ebensperger, L.A., 2013. Avian ecosystem functions are influenced by small mammal ecosystem engineering. BMC Res. Notes 6, 549. Root-Bernstein, M., Jaksic, F., 2013. The Chilean espinal: Restoration for a sustainable silvopastoral system. Rest. Ecol. 21 (4), 409–414. Rosenberg, M.S., Adams, D.C., Gurevich, J., 2000. MetaWin, Statistical Software for Meta-Analysis. Version 2. Sinauer Associates, Sunderland, Massachusetts. Rothman, K.J., Greenland, S., 2005. Causation and causal inference in epidemiology. Am. J. Public Health 95 (S1), S144–S150. Rovito, S.M., Arroyo, M.T.K., Pliscoff, P., 2004. Distributional modelling and parsimony analysis of endemicity of Senecio in the mediterranean-type climate area of Central Chile. J. Biogeography 31, 1623–1636. Sadzawka, R., A., Carrasco, R., M.A., Grez, Z., R., Mora, G., M., de la, L., Flores, P., H., Neaman, A., 2006. Metodos recomendados para los suelos de Chile. Serie Actas INIA 34, 1–164. Revision. Schlesinger, W.H., Pilmanis, A.M., 1998. Plant—Soil interactions in deserts. Biogeochemistry 42, 169–187. Schlesinger, W.H., Raikes, J.A., Hartley, A.E., Cross, A.F., 1996. On the spatial pattern of soil nutrients in desert ecosystems. Ecology 77 (2), 364–374. Schulz, J.L., Cayuela, L., Echeverria, C., Salas, J., Rey Benayas, J.M., 2010. Monitoring land cover change of the dryland forest landscape of Central Chile (1975–2008). Appl. Geogr. 30 (3), 436–447. Simonetti, J.A., 1983. Effect of goats upon native rodents and european lagomorphs in the Chilean matorral. Rev. Chil. Hist. Nat. 56, 27–30. Sneva, F.A., 1977. Soil nitrogen levels in a semiarid climate following long-term nitrogen fertilization. J. Range Manage. 30 (5), 328–330. Tognelli, M.F., de Arellano, P.I.R., Marquet, P.A., 2008. How well do the existing and proposed reserve networks represent vertebrate species in Chile? Div. Distrib. 14 (1), 148–158. Wesche, K., Nadrowski, K., Retzer, V., 2007. Habitat engineering under dry conditions: The impact of pika (Ochotona pallasi) on vegetation and site conditions in southern Mongolian steppes. J. Veg. Sci. 18, 665–674. Whicker, A.D., Detling, J.K., 1988. Ecological consequences of prairie dog disturbances. BioSciences 38 (11), 778–785. Whitford, W.G., Kay, F.R., 1999. Biopedturbation by mammals, a review. J. Arid Environ. 41, 203–230. Wilby, A., Shachak, M., Boeken, B., 2001. Integration of ecosystem engineering and trophic effects of herbivores. Oikos 92, 436–444. Wright, J.P., Jones, C.G., 2004. Predicting effects of ecosystem engineers on patch-scale species richness from primary productivity. Ecology 85, 2071–2081..
(13)
Figure
+2
Documento similar
This paper aims to present Airbnb as an example of the sharing economy and analyze how its growth has been affecting the hotel industry and the rental housing market.. In order
halimus remains a vital plant species in low-rainfall regions (Walker et al., 2014). halimus should not be considered for phytostabilization, and has the potential to be
The kinetics of chalcocite dissolution in sea water and in reject brine from a desalination plant are compared, and the effect of MnO 2 and sulfuric acid on the percentage of
No obstante, como esta enfermedad afecta a cada persona de manera diferente, no todas las opciones de cuidado y tratamiento pueden ser apropiadas para cada individuo.. La forma
Locality: I1 páramo de Mucuchies, Mérida; I2 páramo de Mucuchies, Mérida; I3 páramo de Mucuchies, Mérida; I4 páramo de Mucuchies, Mérida; I5 páramo de Piedras Blancas, Mérida;
The importance of the study of plant-pathogen interactions is widely recognized. The objectives of this thesis were focused in the identification of regions in the PPV
The database contains binary information (presence/absence data) on plant-use records for all accepted vascular plant genera described in the 4 th Edition of Mabberley’s
No effects of Cu on Hg influx were observed for any of the two plant species, suggesting a different transport system for Hg and Cu in roots of oilseed rape and
