Tailoring the magnetic properties of cobalt antidot arrays by varying the pore size and degree of disorder
9
0
0
Texto completo
(2) Journal of Physics D: Applied Physics J. Phys. D: Appl. Phys. 47 (2014) 335001 (8pp). doi:10.1088/0022-3727/47/33/335001. Tailoring the magnetic properties of cobalt antidot arrays by varying the pore size and degree of disorder S Michea1 , J L Palma2 , R Lavı́n 3 , J Briones2,4 , J Escrig2,4 , J C Denardin2,4 and R L Rodrı́guez-Suárez1 1. Facultad de Fı́sica, Pontificia Universidad Católica de Chile, Casilla 306, Santiago, Chile Departamento de Fı́sica, Universidad de Santiago de Chile (USACH), Av. Ecuador 3493, 9170124 Santiago, Chile 3 Facultad de Ingenierı́a, Universidad Diego Portales, Ejército 441, Santiago, Chile 4 Center for the Development of Nanoscience and Nanotechnology (CEDENNA), Av. Ecuador 3493, 9170124 Santiago, Chile 2. E-mail: [email protected] Received 18 March 2014, revised 17 June 2014 Accepted for publication 25 June 2014 Published 24 July 2014 Abstract. Magnetic properties of Co antidot arrays with different hole sizes fabricated by a template-assisted method have been studied by means of first-order reversal curves (FORCs) and micromagnetic simulations. Hysteresis curves show a significant increase of the coercivity of the antidot arrays, as compared with their parent continuous film, which depends on the hole size introduced in the Co thin film. This effect is related to the reversibility of the magnetic domains during magnetization reversal, since due to the appearance of pores, domains may become trapped between them. On the other hand, micromagnetic simulations performed on a perfect hexagonal lattice, when compared with those made on our disordered system taken from the scanning microscope images, reveal that the presence of defects in the antidot lattice affects its magnetic properties. Finally, FORCs show that there is greater interaction attributed to domain–domain interaction. Keywords: Co antidots, micromagnetic simulations, FORCs, magnetic domains (Some figures may appear in colour only in the online journal). (i.e. magnetic thin films with periodic arrays of holes). Magnetic antidots are currently a topic intensively investigated because they are promising candidates for a new generation of electronic devices such as transistors and magnetic field-effect transistor (MAGFET) chipsets [9–11]. Besides, the absence of the superparamagnetic limit in nanostructured antidots makes them strong candidates for ultra-high density recording media [12] and may play a major role in the emerging field of magnonics [13]. The presence of the ordered non-magnetic holes induces a demagnetization field distribution that allow the nucleation and movement of domain walls. Besides, it has been observed that the presence of holes affects the magnetoresistance, magnetization reversal, permeability, coercivity and the intrinsic magnetic anisotropy of the film [14–21]. In these. 1. Introduction. Nanostructured magnetic elements have received much attention from the scientific community in the last two decades due to their potential applications, ranging from sensors for the electronic and electromechanical industry, to the storage media for the magnetic recording industry [1–3]. Such magnetic nanostructures are possible due to the recent advances in both lithographic techniques [4] (top-down approach) and the processes of self-organization [5–8] (bottom-up approach). These technologies allow scientists and engineers to control the size and geometry of the magnetic materials, thus obtaining a broad spectrum of magnetic properties. One of the magnetic systems which is obtainable by a process of self-organization is called magnetic antidots 0022-3727/14/335001+08$33.00. 1. © 2014 IOP Publishing Ltd Printed in the UK.
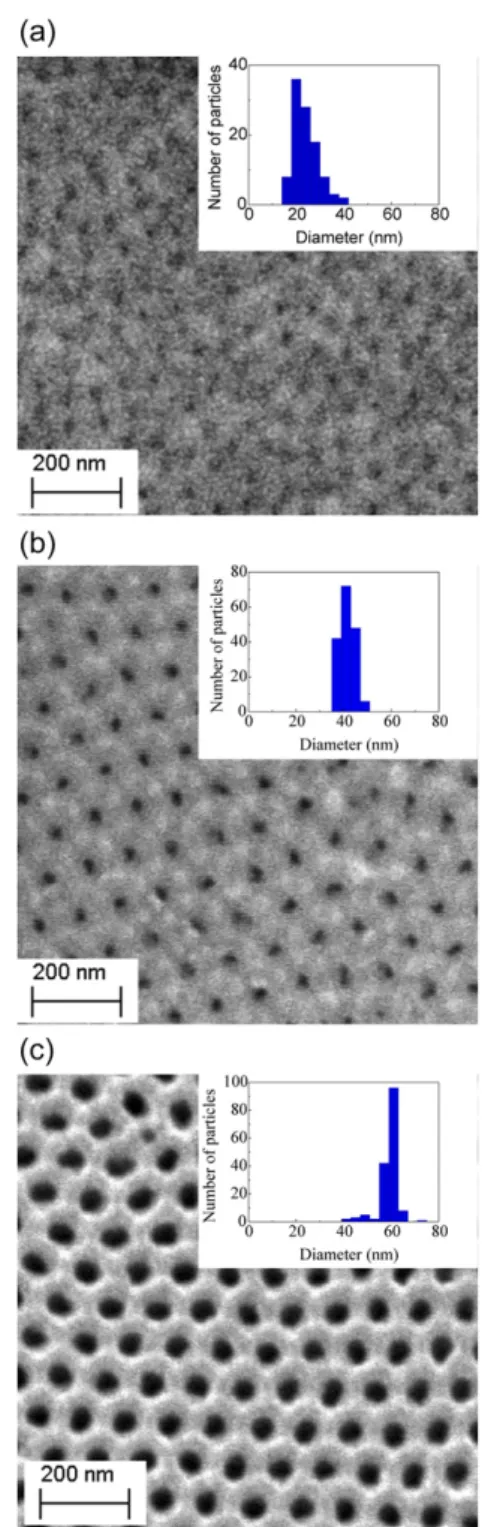
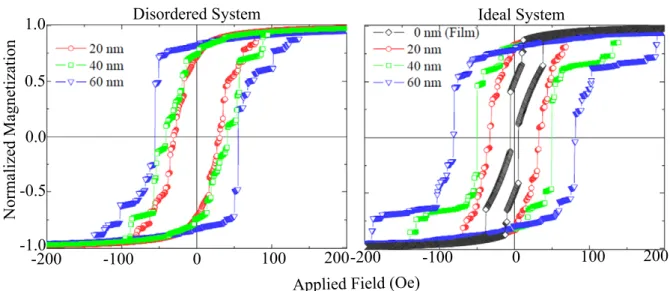
(3) J. Phys. D: Appl. Phys. 47 (2014) 335001. S Michea et al. magnetic nanostructures, the magnetization reversal occurs by the passage of domain walls through the structure, and their pinning at the antidots leads to an enhanced coercivity compared to that of the continuous film [22–25]. In fact, it has been observed the presence of ferromagnetic resonance modes whose frequencies can be tuned by varying the holes dimensions, symmetry of the lattice and external magnetic field [13, 21, 26–30]. While permalloy antidot arrays have been exhaustively investigated [28, 31–33], Co antidot arrays form a particularly interesting system as it is a hard magnetic material which strong magnetic properties. In this work we use micromagnetic simulations and first-order reversal curves (FORCs) in order to investigate the magnetic properties of cobalt nanometric antidot arrays with hole diameters of 20, 40 and 60 nm fabricated using porous anodic aluminum oxide (AAO) membrane as template. It is shown that by controlling the hole diameter, the coercivity can be systematically engineered. For completeness we have also performed numerical simulations to investigate the magnetization reversal process in these antidot arrays. Micromagnetic simulations were performed on a perfect lattice of antidot (ideal system) were compared with simulations made on a real image extracted from a scanning electron microscope (SEM) image (disordered system) [25]. Finally, FORCs performed on antidots add information on the interactions between the magnetic domains that appear during the process of magnetization reversal in these systems.. temperature. The base pressure in the chamber was 5 × 10⁻⁷ Torr, and the Ar pressure during deposition was maintained at 3 mTorr using 20 sccm Ar flow and 50 W dc gun. Under this condition the deposition rate was 3.5 nm min−1 . For comparison, the same magnetic structure was deposited on a glass substrate. In order to avoid the cobalt oxidation a 2 nm Ta layer was deposited over the film. The morphology of the samples was investigated by scanning electron microscopy (SEM). A Carl Zeiss EVO MA 10 apparatus was used for SEM measurements. All magnetic measurements were performed in an alternating-gradient force magnetometer (AGFM). Measurements were done at room temperature and the magnetization loops were measured with the applied field parallel to the plane of the antidot arrays. 3. Micromagnetic simulations. In order to interpret the experimental results we performed micromagnetic simulations in a perfect hexagonal lattice with perfectly circular holes (ideal system), and compared these with the simulations made on a SEM image (disordered system) that, previously treated [25], can be read by the 3D OOMMF package [34]. It is noteworthy that simulated samples do not correspond to the real sample. This is because the real sample has a size close to 2 × 2 mm2 , including about 2 × 10⁸ holes, and the simulated systems considered simply a size of 1 × 1 µm2 without periodic boundary conditions and a film thickness of 28 nm. Thus, numerical simulations are intended to give a qualitative explanation of the effect of disorder on the magnetic properties of antidot arrays, and do not try in any way to reproduce the experimental results. For the simulations the systems were divided in a mesh of cubic cells of 4 nm3 . The parameters used for cobalt were: saturation magnetization MS = 1.4 × 10⁶ A m−1 and exchange stiffness constant A = 30 × 10−12 J m−1 . Since we are interested in polycrystalline samples, anisotropy is very small and can be safely neglected. In all the cases the damping constant is 0.5.. 2. Experimental details. The fabrication procedure of the antidot arrays includes (i) the preparation of the AAO membranes with different pore diameters and (ii) the subsequent deposition of cobalt (Co) on the AAO templates. First, 0.32 mm thickness aluminum foils (Good-Fellow, 99.999%) were cleaned with acetone, isopropanol and distilled water, and then electropolished for 5–10 min at a constant voltage of 25 V in a CH3 CH2 OH : HClO4 (3 : 1) solution at 4 ◦ C. After this procedure, a two-step anodization process [7] was used to fabricate the ordered antidot arrays. In the first step the samples were anodized at a constant voltage of 40 V (pore diameter obtained of 40 nm) and 45 V (pore diameter obtained of 60 nm) in a 0.3M H2 C2 O4 (oxalic acid) solution, and at constant voltage of 20 V (pore diameter obtained of 20 nm) in a 0.3M H2 SO4 (sulfuric acid) solution, both at 20 ◦ C for 8 h. These anodized layers were etched at room temperature for 12 h in a solution of 7 g of H3 PO4 (phosphoric acid), 1.8 g of CrO3 (chromic acid) and adding H2 O up to complete 1000 ml. The second anodization step was carried out for 6 h in the same conditions as the first anodization step. The obtained membranes present highly ordered pores of lattice constant of 100 nm for oxalic acid and 50 nm for the case of sulfuric acid. Besides, the membranes show a hexagonal order and good uniformity in both, the pore diameter and the distance between pores. The magnetic antidot arrays were obtained by deposition of Co films with 28 nm thicknesses onto the above-mentioned AAO porous templates by dc magnetron sputtering at room. 4. Results and discussion. Figure 1 shows the SEM images of the Co antidot arrays with average hole size of 20, 40 and 60 nm. The dark areas of the SEM images correspond to the pores, and the bright areas correspond to the magnetic layer supported by the pore walls. As observed, the images reveal a quite regular hexagonal arrangement of the pores. Furthermore, it can be seen that the sputtered cobalt film adopts the topology imposed by the substrate (in this case, the porous alumina membrane). Thus no magnetic inclusions arise transforming the thin film on a patterned medium. Insert bars in figure 1 show the distribution of diameters of the antidots, from which one can see a good uniformity and pore distribution, mainly due to high quality anodizing process performed. 4.1. Hysteresis curves and magnetization reversal. Figure 2 shows the simulated hysteresis curves for disordered (left) and ideal (right) samples for a magnetic field applied 2.
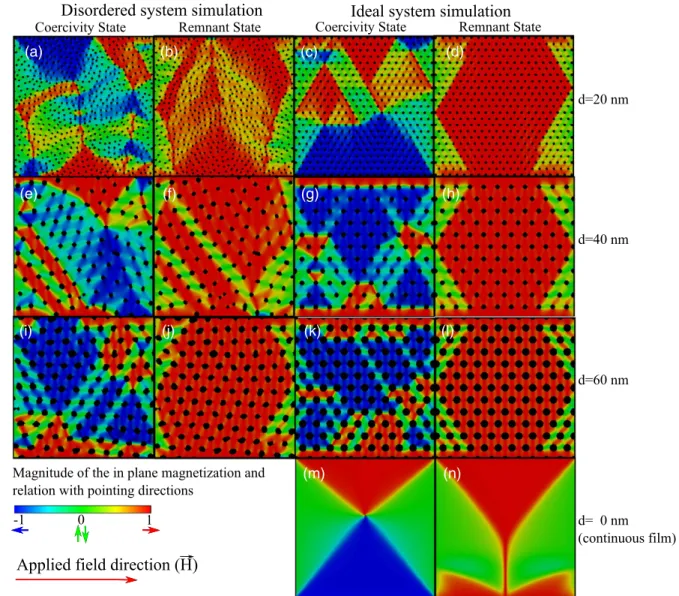
(4) J. Phys. D: Appl. Phys. 47 (2014) 335001. S Michea et al. magnetization mR (mR = MR /MS ) is given by 0.75, 0.72 and 0.85 for the samples with pore size of 20, 40 and 60 nm, respectively. It is worth remembering that the sample with pore size of 20 nm has a interpore distance of 50 nm, much smaller than the 100 nm distance between the pores having the other samples. Figure 3 summarizes the results showing the variation of coercive field as a function of the hole diameter. It is observed that the coercive field of the antidots is higher than the value for the continuous film. The coercivity increases as we move from the continuous film to the antidot array with larger pore size (in this case, 60 nm). Besides, we observe that the behaviour of the coercive field of the disordered system is closer to the behaviour of the experimental data than the behaviour of the ideal system. It is important to remember that the simulated sample is much smaller than the experimentally measured sample, which may account for differences in the coercivities. In addition, simulations were performed for 0 K, while the magnetic properties of the samples were measured at room temperature. From these curves we can conclude that the magnetic properties of Co antidot arrays are strongly influenced by the hole diameter of the samples. To better understand this behaviour, figure 4 shows snapshots of the simulated remanence and coercivity states for ideal and disordered systems when the external field is applied parallel to the thin film (antidots plane). In these images, the colour code corresponds to the component of magnetization along the applied field (in this case, the x direction). The snapshots of the second column ((b), (f ) and (j )) correspond to the magnetic configurations of the samples in the remanent state (H = 0). According to the colour code, green zones do not have a magnetization component along the applied field. Thus, according to the simulations, the first stages of the magnetization reversal takes place through the edges of the structures. In addition, as we noted above, for the disordered sample remanence increases as we increase the pore size. This is because the holes do not allow the formation of a single vortex (as seen in snapshot (m)), which hinders the start of the reversal of magnetization in systems with large pores (see snapshot (j )). We will now analyse the magnetic configurations on coercivity. Starting from snapshot (i), corresponding to a pore diameter of 60 nm, it is observed that the magnetic configuration exhibits a well-defined regularity, where the domains are shown as diamonds. Such structure is consistent with the presence of a six-folded anisotropy. Wang et al showed that a six-fold shape anisotropy arises in permalloy antidot structures where the pores are arranged in a honeycomb structure [19]. In these hexagonally ordered pore geometries, each of the directions linking one defined pore with its first neighbours corresponds to an easy anisotropy axis, whereas the directions linking the pore with its second neighbours will be associated to a hard anisotropy axis. Since green stripes in the snapshot (i) are regions with no magnetization component along the applied field, we can conclude that in such zones the magnetization points along the easy axis. On the other hand, yellow stripes, which mostly go from a pore to its first. Figure 1. SEM images of the Co antidot arrays with average pore diameter d of (a) 20 nm, (b) 40 nm and (c) 60 nm. Inset graphs show the size distribution of the diameters for each sample.. parallel to the sample. From these figures we can see that there are differences in the hysteresis curves when comparing the simulations of ideal versus disordered antidot systems. For example, we observe that the remanent magnetization of the ideal sample decreases as we increase the size of the pores. This behaviour is completely opposite to that observed for the disordered sample, where the remanence increases with increasing pore size, realizing that the imperfections of the sample disturb the process of reversing the magnetization of the sample. This latter behaviour is similar to that observed experimentally, where the reduced (or normalized) remanent 3.
(5) J. Phys. D: Appl. Phys. 47 (2014) 335001. S Michea et al. Figure 2. Hysteresis loops for simulated systems. The figure shows the results for disordered (left) and ideal (right) systems for the samples. considered.. walls. Taking account the defect-free arrangement simulated is possible to relate this fact due to the hexagonal arrangement, where six first neighbours and six second neighbours surround each hole. In this way, every hole configures six constrictions with its first neighbours. Domain walls can be trapped or pinned by these constrictions. Each of these domain walls will experience a spatially variant dipolar interaction along the whole structure and thus it will be subjected to a landscape of pinning potentials [35]. A domain wall trapped in a pinning potential can adopt several stable configurations and can become unpinned through a complex process where a depinning field distribution arises [36, 37]. From third column at figure 4 it can be seen that as the pore diameter increase, the domain wall density can be interpreted as a decreasing in the pinning potential experienced by the domain wall. This should be reflected in a increase on the coercivity as the pore diameter grows. Such an increase can be observed from the M(H ) curves obtained via micromagnetic simulations and showed in figure 2 where the coercive field is directly proportional to the pore diameter. As can be seen in figure 3, the coercivity of the disordered system is less than the obtained for the ideal sample. This difference may arise due to two reasons: the arrangement and the exact geometry of the hole. In a real arrangement defects appear resulting in a breaking of the hexagonal symmetry, changing thus the number of neighbours, typically lowering this value from 6 to 5, and changing therefore the number of domain walls trapped around a hole. Another effect of the symmetry breaking is that the six-fold long-range shape anisotropy is lost, leading to less defined domains as can be seen in figure 4, on the other hand, the exact geometry of the hole is crucial since it determines the shape of the constriction and therefore the punctual pinning potential experienced by the domain walls, playing thus a major role in the coercive field [38–41].. Figure 3. Coercivity of different antidot arrays as a function of the hole diameter.. neighbour, are associated to the presence of domain walls. In the case of snapshot (e) (40 nm pore diameter) fewer domain walls are present and the size of domains is larger. These domains seem to be oriented rather locally since the hexagonal order is partially lost due to the presence of defects. For the smallest pore diameter, shown in snapshot (a), almost no domain walls are present between neighbouring pores; instead, 90 ◦ domain walls separate large domains oriented parallel to the borders of the overall structure. In order to decorrelate the pore diameter effect from the hexagonal ordering, micromagnetic simulations have also been performed keeping the pore diameter values and considering a defect-free perfect hexagonal arrangement of the pores. Figure 4 also shows the magnetic configurations found at the remanent state (fourth column) as well as at the coercive field (third column) for ideal samples. Together with the results obtained, the magnetic configurations for a 28 nm thick continuous film are also presented. From these images it can be seen that a bigger pore diameter is associated to the presence of more domains and thus to a higher density of domain. 4.2. FORC analysis. In order to obtain further insight into the magnetic properties of the systems, we obtained the FORC diagrams from a set of 4.
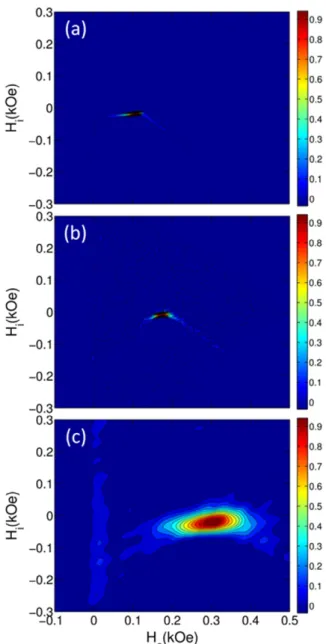
(6) J. Phys. D: Appl. Phys. 47 (2014) 335001. (a). S Michea et al. (b). (c). (d). (e). (f). (g). (h). (i). (j). (k). (l). (m). (n). Figure 4. Snapshots of the magnetization state corresponding to different external applied field parallel to the plane of the samples for disordered and ideal systems. In the colour map the red colour corresponds when the magnetization is pointing in the +x direction (i.e. to the right), and the blue one is for the magnetic moments pointing in the −x direction (i.e. to the left).. minor hysteresis loops [42]. While major M(H ) hysteresis loops provide information regarding the global (average) behaviour of the magnetic system, FORC measurements are more appropriate to investigate the processes taking place during the magnetization reversal. In particular, FORC diagrams provide information about the coercivity distribution and interactions inside the systems and the portions of reversible and irreversible component of the magnetization [43, 44]. This technique has been used to study diverse magnetic phenomena and systems [14, 45–50]. For each minor loop, one starts from the magnetically saturated state; then the applied magnetic field is ramped down to a particular value, called the reversal field Ha . Afterwards, the magnetic field is increased back again toward the saturation value. This last part corresponds to the FORC and holds information from the previous minor loop. Figure 5 shows the FORCs measured with the external magnetic field applied parallel to the plane of the antidots. The contour delineated by the FORCs corresponds exactly to the mayor hysteresis loop.. Magnetization for the Hb field over the FORC with the initial Ha field is denoted by M(Ha , Hb ), restricted to the condition that Hb > Ha . The FORC distribution (ρ) is thus obtained from a mixed second derivative of M(H ), given by [51] 1 ∂ 2 M(Ha , Hb ) ρ(Ha , Hb ) = − . (1) 2 ∂Ha ∂Hb This function extends over the entire (Ha , Hb ) plane. A FORC diagram is a contour plot of equation (1), and can be expressed in terms of the variables Hc = (Hb + Ha )/2 and Hi = (Hb − Ha )/2, which are the commutation (coercivity of an entity) and interaction fields (shift of an entity) [51, 52], allowing us to capture the reversible magnetization component, which appears to be centred in Hc = 0. The density function in equation (1) for a sample is obtained by numeric derivation of the M(Ha , Hb ) function, which contains all the measured FORCs. In this way, the FORC diagram is obtained by making a contour plot of the equation (1). Thus, in order to evidence the differences between the systems, 5.
(7) J. Phys. D: Appl. Phys. 47 (2014) 335001. S Michea et al. Figure 5. FORCs for antidot arrays with a pore diameter of (a) 20 nm, (b) 40 nm and (c) 60 nm, when the external field is applied parallel to the plane of the antidots.. it is necessary to carry out FORC diagrams, as shown in figure 6. The FORC diagram for the thin film with 20 nm pore diameter shows a small spot of irreversible magnetization (for Hc > 0 Oe), with a narrow distribution of interaction and a small distribution of coercivity centred in Hc = 106 Oe, a value close to that of the hysteresis curve of 90 Oe. The small spot on the diagram indicates that the system has a more homogeneous structure of magnetic domains than the system with larger pores. Theoretically, the FORC diagram of a bistable monodomain is a point located over the coercivity axis in a value equal to the coercivity of the system. The diagram of the system with 40 nm pores shows a similar outlook to that of the 20 nm pore system: only a spot of irreversible magnetization centred in Hc = 176 Oe, a value very close to the hysteresis curve of 178 Oe. This spot shows slightly higher interaction and coercivity distributions than those of the 20 nm pore system. Specifically, it shows an increase in the width of the interaction distribution, which indicates the presence of a more complex magnetic structure than that of the 20 nm pore system; a larger number of magnetic domains interacting. If we take a look now to the diagram corresponding to the 60 nm pore, we can see that a large irreversible magnetization spot centred in Hc = 300 Oe is obtained. This system has larger coercivity and interaction distributions than the other two systems (20 and 40 nm), indicating the presence of a more complex magnetic structure than those of the systems of smaller pores. The increase in coercivity distribution indicates that there are different magnetic regions that revert their magnetization at distinct external fields, which results in a denser and more complex domain structure, with smaller magnetic domains (see figure 4). In turn, the increased number of magnetic regions oriented in different directions increases magnetic interaction among neighbouring regions, which is evidenced in the increased interaction distribution in the diagram. Finally, in all the diagrams (for 20, 40 and 60 nm) we observe considerably greater distribution of coercivity than of interaction, indicating the formation of a larger number of magnetic domains. Given the two-dimensional nature of the samples and the direction of the external magnetic field, the effect of magnetic interaction is lower than the effect of the formation of magnetic domains.. Figure 6. First-order reversal diagrams for antidot arrays with a pore diameter of (a) 20 nm, (b) 40 nm and (c) 60 nm, obtained with the applied magnetic field parallel to the plane of the antidots. The colour scale goes from blue (representing the minimum) toward red (maximum values).. 6.
(8) J. Phys. D: Appl. Phys. 47 (2014) 335001. S Michea et al. [8] Heyderman L J, Nolting F, Backes D, Czekaj S, Lopez-Diaz L, Klaui M, Rudiger U, Vaz C A F, Bland J A C, Matelon R J, Volkmann and Fischer P 2006 Phys. Rev. B 73 214429 [9] Moore L S and Goldhaber-Gordon D 2007 Nature Phys. 3 295–6 [10] Beroulle V, Bertrand I, Latorre L and Nouet P 2003 Sensors Actuators A 103 23–32 [11] Seeman K, Leiste H and Ziebert C 2007 J. Magn. Magn. Mater. 316 e879–82 [12] Leitao D C, Ventura J, Pereira A M, Sousa C T, Morira J M, Carpinteiro F C, Sousa J B, Vazquez M and Araujo J P 2010 J. Low Temp. Phys. 159 245–8 [13] Neusser S, Botters B, Becherer M, Schmitt-Landsiedel D and Grundler D 2008 Appl. Phys. Lett. 93 122501 [14] Béron F, Pirota K R, Vega V, Prida V M, Fernández A, Hernando B and Knobel M 2011 New J. Phys. 13 013035 [15] Manzin A and Bottauscio O 2012 J. Phys. D: Appl. Phys. 45 095001 [16] Merazzo K J, Leitao D C, Jiménez E, Araujo J P, Camarero J, del Real R P, Asenjo A and Vázquez M 2011 J. Phys. D: Appl. Phys. 44 505001 [17] Hu X K, Sievers S, Mueller A, Janke V and Schumacher H W 2011 Phys. Rev. B 84 024404 [18] Deshpande N G, Seo M S, Jin X R, Lee S J, Lee Y P, Rhee J Y and Kim K W 2010 Appl. Phys. Lett. 96 122503 [19] Wang C C, Adeyeye A O and Singh N 2006 Nanotechnology 17 1629 [20] Rahman M T, Shams N N, Lai C H, Fidler J and Suess D 2010 Phys. Rev. B 81 014418 [21] Rodrı́guez-Suárez R L, Palma J L, Burgos E O, Michea S, Escrig J, Denardin J C and Aliaga C 2014 J. Magn. Magn. Mater. 350 88–93 [22] Vázquez M, Pirota K R, Navas D, Asenjo A, Hernandez-Vélez M, Prieto P and Sanz J M 2008 J. Magn. Magn. Mater. 320 1978–83 [23] Pirota K R, Prieto P, Neto A M J, Sanz J M, Knobel M and Vázquez M 2008 J. Magn. Magn. Mater. 320 e235–8 [24] Martens S, Albrecht O, Nielsch K and Goerlitz D 2009 J. Appl. Phys. 105 07C113 [25] Palma J L, Gallardo C, Spinu L, Vargas J M, Dorneles L S, Denardin J C and Escrig J 2013 J. Magn. Magn. Mater. 344 8–13 [26] Hu C-L, Magaraggia R, Yuan H-Y, Chang C S, Kostylev M, Tripathy D, Adeyeye A O and Stamps R L 2011 Appl. Phys. Lett. 98 262508 [27] Neusser S, Botters B and Grundler D 2008 Phys. Rev. B 78 054406 [28] Mu C P, Wang W W, Zhang B, Liu Q F and Wang J B 2010 Physica B 405 1325–8 [29] Krivoruchko V N and Marchenko I 2011 J. Appl. Phys. 109 083912 [30] Ding J, Tripathy D and Adeyeye A O 2011 J. Appl. Phys. 109 07D304 [31] Torres L, Lopez-Diaz L and Iniguez J 1998 Appl. Phys. Lett. 73 3766 [32] Guo J, Bin M and Jalil A 2004 J. Magn. Magn. Mater. 272–276 722–3 [33] Garcı́a-Sánchez F, Paz E, Pigazo F, Chubykalo-Fesenko O, Palomares F J, González J M, Cebollada F, Bartolomé J and Garcı́a L M 2008 Europhys. Lett. 84 67002 [34] Donahue M J and Porter D G 1999 OOMMF User’s Guide version 1.0 National Institute of Standards and Technology Inter Agency Report NISTIR 6376 [35] Metaxas P J, Zermatten P-J, Jamet J-P, Ferre J, Gaudin G, Rodmacq B, Schuhl A and Stamps R L 2009 Appl. Phys. Lett. 94 132504 [36] Briones J, Montaigne F, Hehn M, Lacour D, Childress J R and Carey M J 2011 Phys. Rev. B 83 060401(R). 5. Conclusions. In conclusion, cobalt thin film have a strong magnetization when the external field is applied in plane directions, antidots arrays were synthesized with different pore sizes in cobalt thin film in order to increase the coercive field value. The morphology for cobalt antidots was characterized by SEM and their magnetic properties were measured experimentally by hysteresis curves and FORC diagrams. Besides, we simulated hysteresis curves and obtained snapshots of the magnetization to investigate magnetic configurations. In particular, we performed micromagnetic simulations of an ideal and a disordered systems in order to investigate the effect of disorder in the array. From these simulations it is observed that the disorder produces variations in the values of coercivity and remanence measured, a fact that is largely due to symmetry breaking of the sample. The analysis of the FORC diagrams shows an increase in the coercivity and interaction field distributions in the samples with larger pores. From micromagnetic simulations and experimental measurements we can conclude that as the pore size increases, and the space between the pores decreases, the interaction between the different domains that propagate produces many small domains which consequently give rise to a domain structure more complex, resulting in an increase in coercivity with respect to a thin film. The increased number of magnetic regions oriented in different directions increases magnetic interaction among neighbouring regions, which is evidenced in the increased interaction distribution in the FORC diagram. In this way varying the hole diameter can be used to tailor the magnetic properties of ordered nanoscale antidot arrays for specific applications. Acknowledgments. This work was supported by FONDECYT (Projects 3130397, 3130393, 11110130, 3120059, 1140195, 1110784 and 1130705), USAFOSR Award No FA9550-11-1-0347, Grant ICM P10-061-F by Fondo de Innovación para la Competitividad-MINECON and Financiamiento Basal para Centros Cientı́ficos y Tecnológicos de Excelencia, under project FB0807. References [1] Wolf S A, Awschalom D D, Buhrman R A, Daughton J M, Von Molnar S, Roukes M L, Chtchelkanova A Y and Treger D M 2001 Science 294 1488 [2] Chappert C, Fert A and Nguyen Van Dau F 2007 Nature Mater. 6 813–23 [3] Moser A, Takano K, Margulies D T, Albrecht M, Sonobe Y, Ikeda Y, Sun S and Fullerton E E 2002 J. Phys. D: Appl. Phys. 35 R157 [4] Adeyeye A O and Singh N 2008 J. Phys. D: Appl. Phys. 41 153001 [5] Jessensky O, Müller F and Göeselle U 1998 Appl. Phys. Lett. 72 1173–5 [6] Carstensen J et al 2005 Ordered Porous Nanostructures and Applications ed R B Wehrspohn (New York: Springer) [7] Masuda H and Fukuda K 1995 Science 268 1466 7.
(9) J. Phys. D: Appl. Phys. 47 (2014) 335001. S Michea et al. [45] Dumas R K, Li C-P, Roshchin I V, Schuller I K and Liu K 2007 Phys. Rev. B 75 134405 [46] Pike C and Fernández A 1999 J. Appl. Phys. 85 6668 [47] Chiriac H, Lupu N, Stoleriu L, Postolache P and Stancu A 2007 J. Magn. Magn. Mater. 316 177 [48] Vivas L G, Vázquez M, Escrig J, Allende S, Altbir D, Leitao D C and Araujo J P 2012 Phys. Rev. B 85 035439 [49] Lavı́n R, Farı́as C and Denardin J C 2012 J. Magn. Magn. Mater. 324 1800 [50] Lavı́n R, Denardin J C, Escrig J, Altbir D, Cortes A and Gomez H 2008 IEEE Trans. Magn. 44 2808 [51] Pike C R 2003 Phys. Rev. B 68 104424 [52] Preisach F 1935 Z. Phys. 94 277. [37] Attané J P, Ravelosona D, Marty A, Samson Y and Chappert C 2006 Phys. Rev. Lett. 96 147204 [38] Bruno P 1999 Phys. Rev. Lett. 83 2425 [39] Lacour D, Katine J A, Folks L, Block T, Childress J R, Carey M J and Gurney B A 2004 Appl. Phys. Lett. 84 1910 [40] Briones J, Montaigne F, Lacour D, Hehn M, Carey M J and Childress J R 2008 Appl. Phys. Lett. 92 032508 [41] Faulkner C C, Allwood D A and Cowburn 2008 J. Appl. Phys. 103 073914 [42] Mayergoyz I D 1986 Phys. Rev. Lett. 56 1518 [43] Berón F, Pirota K R and Knobel M 2011 J. Appl. Phys. 109 07E308 [44] Berón F, Ménard D and Yelon A 2007 J. Appl. Phys. 103 07D908. 8.
(10)
Figure
Documento similar