La función de calcio en la vía de señalización mediada por nitrato en raíces de Arabidopsis thaliana /
79
0
0
Texto completo
(2) II. ACKNOWLEDGMENTS. I would like to express my gratitude to my advisor, Dr. Rodrigo A. Gutiérrez for his advice, guidance and encouragement throughout my work and also for all the opportunities he provided me.. I would like to thank to Dra. Ana Laxalt of the Universidad Nacional de Mar del Plata for her cooperation and guidance in my investigation with phosphatidic acid in response to nitrate.. I would like to specially acknowledge Jose Miguel, Carolina, Elena and Andrea for help me in this thesis and great ideas to improve this work. I would also like to thank all the members of the Plant Systems Biology Lab at Pontificia Universidad Católica de Chile or also nicknamed as “La Furia PSBL”.. I would like to thank to my family for give me all the opportunities to develop myself in all I wanted. I would like to thank especially to my wife Macarena for loving me and for help me during this special stage with her supporting in every important decision.. This work would not have been possible without the financial support of CONICYT, which awarded me a 4-year Doctoral scholarship and a Doctoral thesis support scholarship of the “VicerrectoríaAdjunta de Investigación y Doctorado” at the Faculty of Biological Sciences in Pontificia Universidad Católica de Chile..
(3) III. This work was funded by International Early Career Scientist program from Howard Hughes Medical Institute, Fondo de Desarrollo de Areas Prioritarias (FONDAP) Center for Genome Regulation (15090007), Millennium Nucleus Center for Plant Functional Genomics (P10-062-F), Fondo Nacional de Desarrollo Científico y Tecnológico (FONDECYT) 1141097 and PhD fellowship from ComisiónNacional de InvestigaciónCientífica y Tecnológica (AT24121649) to E.R..
(4) IV. SUBJECT INDEX. ACKNOWLEDGMENTS …...................................................................................................II SUBJECT INDEX ..................................................................................................................IV FIGURE INDEX......................................................................................................................VI TABLE INDEX.....................................................................................................................VIII GLOSSARY.............................................................................................................................IX ABSTRACT...............................................................................................................................X RESUMEN...............................................................................................................................XI 1. INTRODUCTION..................................................................................................................1 Cross-talk between nitrate and hormone signals….....................................................................2 N perception and signaling pathway............................................................................................4 Ca2+ in plant signaling pathways ................................................................................................8 Calcium transport Proteins.........................................................................................................10 Hypothesis .................................................................................................................................13 General Aim ..............................................................................................................................13 Specific Aims ............................................................................................................................13 2. MATERIALS AND METHODS .......................................................................................14 Plant Materials...........................................................................................................................14 Growth Conditions.....................................................................................................................14 Plant Genotyping.......................................................................................................................15 Chemical Treatment of Plants…………………........................................................................16 In Vivo Reconstitution of Aequorin and Ca2+-Dependent Luminescence Measurement..........16.
(5) V. Inositol-1,4,5-Triphosphate (IP3) Assays..................................................................................17 RNA Isolation and RT-qPCR....................................................................................................18 Gene Expression Analysis.........................................................................................................18 Construction of 35S::PLC4:GFP gene fusion............................................................................19 Phosphatidic acid assay..............................................................................................................20 3. RESULTS. ...........................................................................................................................21 Nitrate treatments increase cytoplasmic calcium concentration................................................21 PI-PLC activity is required for changes in cytoplasmic calcium levels in response to nitrate treatments in Arabidopsis thaliana. ...........................................................................................25 NRT1.1 is a positive regulator of the [Ca2+]cyt increase in response to nitrate treatments…………...................................................................................................................28 Nitrate-induced. gene. expression. is. mediated. by. NRT1.1,. PLC. and. Ca2+............................................................................................................................................32 Transcriptome changes associated to PLC activity are important for the nitrate response……………………………………………………………………………..................37 Nitrate regulates the expression of PLC4 and PLC5 genes. .....................................................46 PLC4 modulates the expression of nitrate responsive genes.....................................................48 Phosphatidic acid is not involved into nitrate signaling pathway..............................................53 4. DISCUSSION.......................................................................................................................55 5. CONCLUSIONS..................................................................................................................60 6. REFERENCES ....................................................................................................................61.
(6) VI. FIGURE INDEX. Figure 1. Simplified representation of a “canonical pathway” for nitrate signaling...................7 Figure 2. Nitrate treatments increase [Ca2+]cyt levels.................................................................22 Figure 3. LaCl3 and EGTA treatments altered the increase [Ca2+]cyt levels in response to nitrate.........................................................................................................................................23 Figure 4. A PLC inhibitor blocks increase in [Ca2+]cyt and inositol-1,4,5-trisphosphate (IP3) levels in response to nitrate treatments......................................................................................26 Figure 5. NRT1.1 is required for increase in [Ca2+]cyt and inositol-1,4,5-trisphosphate (IP3) levels in response to nitrate treatments......................................................................................29 Figure 6. Induction of gene expression in response to nitrate treatments is mediated by NRT1.1 and PLC activity in roots…….....................................................................................33 Figure 7. Induction of gene expression in response to nitrate treatments is mediated by NRT1.1 and Ca2+ in roots…......................................................................................................35 Figure 8. Sungear analysis of genes with significant Treatment (T), Pharmacological (F) and Treatment:pharmacological (TF) interaction factor reveals that PLC activity regulates the expression. of. nitrate-responsive. genes. and. genes. that. do. not. respond. to. nitrate………………………………………….........................................................................39 Figure 9. PLC4 and PLC5 respond to nitrate in Arabidopsis roots...........................................47 Figure 10. PLC4 overexpression enhances nitrate response of NRT2.1 and NRT3.1 genes..........................................................................................................................................49.
(7) VII. Figure 11. PLC4 is not required for nitrate induction of NIR or NIA1 gene expression..................................................................................................................................50 Figure 12. A simplified model of the nitrate signaling pathway...............................................52 Figure 13. Phosphatidic acid is not induced for nitrate treatment.............................................54.
(8) VIII. TABLE INDEX. Table1. Gene ontology analysis of group 1 genes………….....................................................41 Table2. Gene ontology analysis of group 2 genes………….....................................................42 Table3. Gene ontology analysis of group 3 genes………….....................................................43 Table4. Gene ontology analysis of group 4 genes………….....................................................44.
(9) IX. GLOSSARY. ABA: Abscisic acid. DGK: Diacylglycerol kinase. ANOVA: Analysis of variance. EGTA: Ethylene glycol tetraacetic acid. ARF: Auxin response factor. GFP: Green fluorescent protein. C: Carbon. HATS: High affinity transport systems. CIPK: CBL- interacting protein kinase. iGluR: Glutamate receptor. CNGC: Cyclic nucleotide-gated channel. IP3: inositol 1, 4, 5-trisphosphate. CaM: Calmodulin. KNO3: Potassium nitrate. CDPK: Ca2+-dependent protein kinases. KCl: Potassium chloride. CBL: Calcineurin-like protein. LATS: Low affinity transport systems. cAMP: Cyclic AMP. LaCl3: Lanthanum Chloride. cGMP: Cyclic GMP. LR: Lateral root. cADPR: Cyclic ADP ribose. MS: Murashige and Skoog Medium. CDS: Coding sequence. miRNA: micro RNA. Col-0: Columbia 0 ecotype.. N: Nitrogen. Coelenterazine (CTZ): 3,2-Dihydro-2-(p-. NLP: NIN-like protein. hydroxybenzyl)-6-(p-hydroxyphenyl)-8-. NR: Nitrate reductase. benzylimidazolo [1,2-a] pyrazin-3-one. NRT1.1/AtNPF6.3: Nitrate transporter 1.1. Ca2+: calcium,. NaCl: Sodium chloride. [Ca2+]cyt: cytoplasmic Ca2+ concentration. NIR: Nitrite reductase. DAG: Diacylglycerol. NIA1: Nitrate reductase 1. DGPP: Diacylglycerolpyrophosphate. NRT: Nitrate transporter.
(10) X. PRG: Primary nitrate response. RMA: robust multiarray analysis. PM: Plasma membrane. TLC: Thin layer chromatography. PLC: Phospholipase C. U73122:. 32Pi:. Inorganic 32P-orthophosphate. 1-[6-[((17β)-3-Methoxyestra-. 1,3,5[10]-trien-17-yl)amino]hexyl]-1H-. PLD: Phospholipase D. pyrrole-2,5-dione. PIP: phosphatidylinositol phosphate. U73343:. PIP2: phosphatidylinositol bisphosphate. 1,3,5[10]-trien-17-yl)amino]hexyl]-2,5-. PA: Phosphatidic acid. pyrrolidinedione. PCR: Polymerase chain reaction. VDCC:. PRG: Primary response gene. channel. qPCR: quantitative PCR. WT-AQ: 35S::Aequorin line. R: Receptor ROCC: channel. Receptor-operated. calcium. 1-[6-[((17β)-3-Methoxyestra-. Voltage-dependent. calcium.
(11) XI. ABSTRACT. Understanding how plants sense and respond to changes in nitrogen (N) availability is the first step towards developing strategies for biotechnological applications such as to improve nitrogen-use efficiency. However, components involved in N signaling pathways remain poorly characterized. Calcium is a second messenger in signal transduction pathways in plants but its role in nitrate responses has not been addressed. Using aequorin reporter plants we show that nitrate treatments transiently increase cytoplasmic Ca2+ concentration ([Ca2+]cyt). We found that nitrate also induces a rise in cytoplasmic concentration of inositol 1, 4, 5-trisphosphate (IP3). Increases in IP3 and [Ca2+]cyt levels in response to nitrate treatments were blocked by U732122, a pharmacological inhibitor of phospholipase C (PLC), but not the non-functional analog U73343. In addition, increases in IP3 and [Ca2+]cyt levels in response to nitrate treatments were abolished in mutants of the nitrate transceptor NRT1.1/AtNPF6.3. Expression of nitrate-responsive genes was severely affected by pretreatments with Ca2+ channel blockers and PLC inhibitors. These results indicate that Ca2+ act as a second messenger in the nitrate-signaling pathway of Arabidopsis thaliana. Our results suggest a model where NRT1.1/AtNPF6.3 and a phospholipase C activity mediate the increase of Ca2+ in response to nitrate required for changes in expression of prototypical nitrate-responsive genes..
(12) XII. RESUMEN. Entender como las plantas censan y responden a cambios en la disponibilidad de nitrógeno (N) es el primer paso para desarrollar estrategias para aplicaciones biotecnológicas tales como mejorar la eficiencia del uso del nitrógeno. Sin embargo, los componentes involucrados en las vías de señalización de N son pobremente conocidos. Calcio es un segundo mensajero en vías de transducción de señales en plantas pero su rol en la respuesta a nitrato no ha sido evaluado. Usando una planta reportera que expresa la proteína Aequorina, hemos observado que tratamientos con nitrato incrementan la concentración de calcio citoplasmático ([Ca2+]cyt). Encontramos que nitrato también induce un aumento en los niveles de inositol trifosfato (IP3). El incremento en los niveles de IP3 y [Ca2+]cyt en respuesta a nitrato fue bloqueado por U73122, un inhibidor de la actividad de la fosfolipasa C (PLC), pero no por el análogo no funcional U73343. Además, el incremento en los niveles de IP3 y [Ca2+]cyt en respuesta a nitrato fue inhibido en la mutante del receptor de nitrato NRT1.1/AtNPF6.3. La expresión de genes de respuesta nitrato fue severamente afectada por pre-tratamientos con bloqueadores de canales de calcio e inhibidores de la PLC. Estos resultados indican que el calcio actúa como un segundo mensajero en la vía de señalización de nitrato de Arabidopsis thaliana. Nuestros resultados sugieren un modelo en el que NRT1.1/AtNPF6.3 y la actividad de la PLC median el incremento de calcio en respuesta a nitrato, el cual a su vez produce el cambio en la expresión de genes de respuesta a nitrato..
(13) 1. 1. INTRODUCTION. Plants are sessile organisms that evolved sophisticated responses to adapt to changing environmental conditions. Nutrient availability is an important factor for plant growth and productivity. Nitrogen (N) is the mineral nutrient required in the greatest amount by plants (Epstein and Bloom, 2005) and its availability, or lack thereof, limits plant growth and development (Alvarez et al., 2012), crop yield (Hirel et al., 2011) and primary production at a planetary scale (Gruber and Galloway, 2008). Available N forms, such as nitrate or ammonia, are in short supply in natural as well as agricultural systems. Plants have evolved sophisticated strategies to cope with heterogeneous N availability in the soil (Alvarez et al., 2012). Two sophisticated uptake systems have been found in plants: the low affinity transport systems (LATS) that acts in high nutrient concentrations (above 1 mM), and the high affinity transport systems (HATS) which acts at the micromolar range (Wang et al., 1993). N uptake is subjected to strict regulation according to plant demands (Crawford and Glass, 1998). Nitrate is the main source of N in agriculture and a potent signal that regulates the expression of hundreds of genes (Wang et al., 2004; Vidal and Gutiérrez, 2008; Ho and Tsay, 2010). Microarray analyses performed using nitrate, nitrite and other forms of N revealed thousands of genes regulated by N signals (Alvarez et al., 2012; Canales et al., 2014). These genes participate in many different plant processes including metabolism, growth and development (Vidal and Gutiérrez, 2008; Vidal et al., 2014b). Due to the importance of nitrate as primary N source for plants, the nitrate response has been the most thoroughly characterized. Roots are highly responsive to nitrate, with more than 1,000 genes identified that respond rapidly and at very low concentrations of external nitrate (250 μM) (Wang, 2003; Wang et al., 2004). Transcriptomics changes caused by nitrate treatments have been shown to correlate with.
(14) 2. later changes in metabolite levels such as amino acids, indicating that changes in gene expression by nitrate are important for modulating plant metabolic processes (Wang et al., 2004). To discriminate between nitrate responsive genes and genes responding to N-signals downstream of nitrate reduction, the root and shoot response of nitrate reductase (NR)-null mutant plants was compared to the root and shoot response of wild-type plants (Wang et al., 2004). NR-null plants cannot reduce nitrate to nitrite, which is the first step in the N reduction and assimilation pathway. Therefore, regulation of gene expression by nitrate treatments in NR-null plants are the result of nitrate acting as a signal and not a result of another N form or signal produced after nitrate reduction or assimilation. In these experiments, 38% of the genes were regulated similarly by nitrate treatments in NR-null mutant and wild-type plants suggesting they were responding directly to nitrate (Wang et al., 2004). These genes were involved in specific processes such as energy, glycolysis and nitrogen and sulfur metabolism (Wang et al., 2004).. Cross-talk between nitrate and hormone signals. Phytohormones are signal molecules produced by the plant to regulate cellular processes in targeted cells. Hormones have a role in the development of flowers, stems, leaves, roots, among other organs of plants. Moreover, it has also been shown that such cross-controls exist between nitrate and auxin, cytokinin, and ABA. Auxin plays an important role in modulation of root architecture in response to nitrate. A previous report has found a regulatory module that includes miR167 and AUXIN RESPONSE FACTOR 8 (ARF8) involved in regulation of LR initiation and emergence in response to nitrate (Gifford et al., 2008). We have previously shown that regulatory module miR393/auxin receptor AFB3 has a role in coordinating primary and lateral root growth in response to nitrate availability (Vidal et al., 2010). It has been proved that NAC4.
(15) 3. transcription factor is a key regulatory factor acting downstream of AFB3 in lateral root development (Vidal et al., 2013a), supporting the idea that nitrate and auxin can modulate LR architecture by miR393/AFB3/NAC4. Moreover, evidence showed that nitrate can regulate at the transcriptional level iso-pentenyl-transferase 3 (IPT3). This enzyme catalyzes the critical step of cytokinin biosynthesis and has been shown to be involved in the production of nitrate-induced cytokinins (Nero et al., 2009). Similarly, exogenous supply of cytokinin down-regulates the expression of NITRATE TRANSPORTER 2 (NRT2) genes, such as NRT2.1, NRT2.3, and NRT2.6 (Ruffel et al., 2014), but the impact of cytokinin and nitrate on modulation of root architecture is still unclear. On the other hand, abscisic acid (ABA) plays a central role in mediating the regulatory effects of high nitrate concentrations on root branching in Arabidopsis. Abscisic acid (ABA) seems to be required for this effect, since the NO3- inhibitory effect on LR is reduced by mutating either ABI4 or ABI5 genes (Nero et al., 2009). Indeed, recently the low affinity NO3transporter NRT1.2, another member of the NRT family, has been identified as an ABA transporter in a heterologous cellular system (Kanno et al., 2012). NO3- does not seem to inhibit ABA transport in a yeast system (Kanno et al., 2013), but the impact of ABA on NO3- transport by NRT1.2 has still to be determined. NITRATE TRANSPORTER 1.1 (NRT1.1) has been proposed also to facilitate uptake of the phytohormone auxin. Nitrate inhibits NRT1.1-dependent auxin uptake, thereby NRT1.1 represses lateral root growth at low nitrate availability by promoting basipetal auxin transport out of these roots (Krouk et al., 2010b). In addition, NRT1.1 also has roles in regulation of root system architecture independent from nitrate uptake. NRT1.1 is involved in root colonization of nitrate-rich patches by promoting LR elongation in response to a localized high nitrate supply (Remans et al., 2006b), and this effect is mediated by the MADS box transcription factor ANR1 (Remans et al., 2006b). Also,.
(16) 4. NRT2.1 is involved in Lateral Root (LR) repression in media that contain a high C/N ratio (Little et al., 2005) and in LR initiation control in response to a low nitrate supply (Remans et al., 2006a). This signaling function is shown to be independent of nitrate transport (Little et al., 2005; Remans et al., 2006a).. Nitrate perception and signal transduction A few primary nitrate response genes (PRGs) have been identified, characterized by rapid changes in gene expression independent of protein synthesis in response to nitrate treatments (Sakakibara et al., 1997). Krouk et al. 2010a monitored genome-wide responses at early time points after exposing plants to 1 mM nitrate. Results of these experiments showed that the initial nitrate response includes genes involved in translation, suggesting that nitrate initially triggers a reprogramming of the transcriptome to ensure production of the necessary proteins for nitrate acquisition (Krouk et al., 2010a). The best characterized sensor in nitrate signaling pathway is NITRATE TRANSPORTER 1.1 (NRT1.1). NRT1.1 can switch from low to high affinity by phosphorylation of threonine residue 101 (T101) (Ho et al., 2009). Under low nitrate conditions, CBL-INTERACTING PROTEIN KINASE (CIPK) 23 can phosphorylate T101, making NRT1.1 a high affinity nitrate carrier and leading to weak induction of NRT2.1 gene expression (Ho et al., 2009). NRT2.1 is a high affinity nitrate transporter and one of the several PRGs that show a rapid induction of gene expression in response to nitrate treatments, independently of protein synthesis. Conversely, under high nitrate conditions, T101 is not phosphorylated, NRT1.1 functions as a low affinity carrier and NRT2.1 gene expression is strongly induced. The NRT1.1 protein is involved in both nitrate perception and transport (Wang et al., 2009; Dechorgnat et al., 2011; Gojon et al., 2011). These two functions can be decoupled in the chl1-9 mutant allele carrying a point.
(17) 5. mutation that changes the proline residue 492 to leucine. This mutation reduces NRT1.1 nitrate uptake in all affinity ranges but does not affect the primary nitrate response of NRT2.1. Thus nitrate transport activity is not required for the signaling function of NRT1.1 (Ho et al., 2009). Our laboratory has demonstrated that gene expression in response to nitrate of AFB3, NAC4, TGA1 and TGA4 depends on the nitrate transport function of NRT1.1/AtNPF6.3 (Alvarez et al., 2014; Vidal et al., 2014a). Thereby, both transport and signaling function of NRT1.1/AtNPF6.3 are important to control gene expression in response to nitrate. It has been shown that NRT1.1 is required for normal expression in response to nitrate of more than 100 genes in Arabidopsis roots (Wang et al., 2009). CIPK8 is a kinase whose expression depends on NRT1.1. CIPK8 is an important regulator of early nitrate response genes (Hu et al., 2009). cipk8 mutants show 40% reduction in the plant response to nitrate treatments, suggesting CIPK8 functions upstream of PRGs (Hu et al., 2009). CIPKs act in concert with CBL proteins, plant-specific calcium binding proteins that activate CIPKs to phosphorylate downstream targets (Shi et al., 1999; Albrecht et al., 2001; Pandey et al., 2008). The function of CIPK proteins in gene expression in response to nitrate prompts a possible role for calcium as a second messenger in nitrate signaling pathways. Early experiments using maize and barley detached leaves showed that nitrate response genes could be altered by pretreating the leaves with calcium chelator EGTA or calcium channel blocker LaCl3 (Sakakibara et al., 1997; Sueyoshi et al., 1999). These results suggest that nitrate signaling partly depends on cellular calcium levels and suggest a mechanism that requires transient increase in calcium levels to activate CBL-CIPK proteins which in turn trigger changes in protein phosphorylation patterns activating gene expression responses in Arabidopsis. However, the role of calcium in the nitrate response has not been thoroughly addressed..
(18) 6. Another important regulatory factor of the nitrate signaling pathway is NLP7. NLP7 belongs to the NIN-like protein family (NLPs) (Schauser et al., 1999). The expression of genes involved in N metabolism depends on NLP7 (Castaings et al., 2009) and recently it was demonstrated that NLP7 binds to the promoter of 851 genes in response to nitrate (Marchive et al., 2013). We recently used an integrative bioinformatics approach to demonstrate that TGA1 and TGA4 transcription factors are regulators of the nitrate response (Alvarez et al., 2014). TGA1 and TGA4 are bZIP transcription factors and are regulated by nitrate in Arabidopsis root. In addition, TGA1 and TGA4 transcription factors act downstream of NRT1.1 transport activity to transcriptionally regulate NRT2.1 in a nitrate dependent manner. TGA1 and TGA4 also regulate lateral root development and primary root growth (Alvarez et al., 2014). On the other hand, members of the LATERAL ORGAN BOUNDARY DOMAIN (LBD37/38/39), were found to repress anthocyanin biosynthesis and many other nitrate responsive genes, including key genes required for nitrate uptake and assimilation (Rubin et al., 2009). SQUAMOSA PROMOTER BINDING PROTEIN-LIKE 9 (SPL9) was identified as a negative regulator of NIR and NIA2 using a systems biology approach (Krouk et al., 2010a). In this work, new nitrate responsive-genes at early time points were identified, including the SPL9 transcription factor, using highresolution transcriptomics profiling in response to nitrate treatment. In this proposal, we would like to address the hypothesis that a canonical signaling pathway involving Ca2+, protein kinases and transcription factors exist to transduce the nitrate signal and induce changes in gene expression in plants. (Figure 1)..
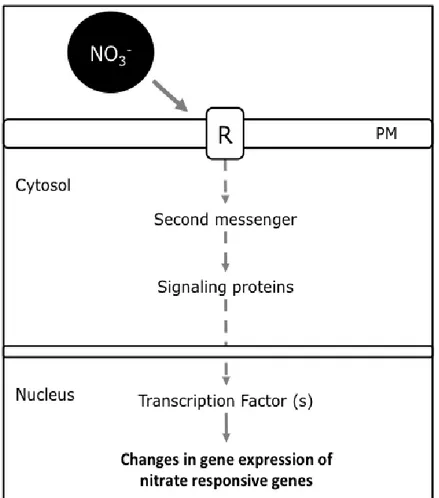
(19) 7. Figure 1.Simplified representation of a “canonical pathway” for nitrate signaling. An receptor (R) would perceive the nitrate signal and activate a signal transduction pathway that involves protein phosphorylation cascades that ultimately activate transcription factors that regulate expression of nitrate responsive genes. R: Receptor. PM: Plasma membrane..
(20) 8. Ca2+ in plant signaling pathways Ca2+ is a key essential second messenger in signal transduction pathways in plants and other organisms (Harper et al., 2004; Hetherington and Brownlee, 2004; Reddy and Reddy, 2004; Hepler, 2005). Multiple abiotic and biotic cues elicit specific and distinct spatiotemporal patterns of change in the cytosolic free Ca2+ concentration in plants (Sanders et al., 2002; Hetherington and Brownlee, 2004; Reddy and Reddy, 2004; Hepler, 2005). Abiotic stimuli include light, UV/B irradiation, high temperature, touch, hyperosmotic stress, drought and oxidative stress (Bush, 1995; Plieth, 2001; Snedden and Fromm, 2001). Biotic stimuli include hormones such as abscisic acid (ABA), gibberellin, fungal elicitors, and nodulation factors (Bush, 1995; Plieth, 2001; Snedden and Fromm, 2001). Critical information regarding the nature and intensity of the stimuli can be relayed by changes in the characteristics of the “Ca2+ signature” consisting of differences in Ca2+ oscillation frequency, amplitude and localization. Ca2+ concentration in the cytoplasm is typically in the micromolar range and is finely controlled by regulating influx and efflux. Free Ca2+ in the cytosol can rapidly increase due to influx from outside the cell as well as release from internal stores in subcellular compartments such as vacuole or endoplasmic reticulum (Kiegle et al., 2000; Dodd et al., 2010). Influx is facilitated by Ca2+-permeable channels in the plasma membrane and a strong electrochemical gradient due to concentrations in the millimolar range outside the cell and in internal stores such as vacuole (Kiegle et al., 2000; Dodd et al., 2010). Ca2+ signatures are detected, decoded and transmitted to downstream responses by a set of Ca2+ binding proteins that function as Ca2+ sensors. Binding of Ca2+ to the protein sensors alter their structural and/or enzymatic properties, regulating their interaction with target proteins that affect solute transport and enzymatic activities, cytoskeletal orientation, protein phosphorylation cascades and changes in gene expression (White and Broadley,.
(21) 9. 2003; Dodd et al., 2010). In plants, some of the best studied calcium sensors are calmodulin (CaM), CaM-related proteins (Bouché et al., 2002), Ca2+-dependent protein kinases (CDPK) (Harper et al., 2004) and calcineurin-like proteins (CBL) (Luan et al., 2002). Calmodulin is a small (17 kDa), highly conserved, acidic protein with two globular domains each containing two EF hands connected by a flexible α-helical spacer (Zielinski, 1998). Calmodulin binds to many different proteins implicated in diverse physiological processes including cation transporters (involved in cytosolic Ca2+ homeostasis) (Snedden and Fromm, 2001), cytoskeletal rearrangements and cell division (Bush, 1995), phytohormone (Reddy et al., 2000), disease resistance (Snedden and Fromm, 2001) and stress tolerance (Monshausen et al., 2009). Calmodulin can also regulate gene expression by binding to specific transcription factors such as EICBP (Ethylene-Induced CaM Binding Protein) that is involved in ethylene signal transduction (Reddy et al., 2000). CDPKs are ubiquitous in plants. They have four EF hands that bind Ca2+ to activate their serine/threonine kinases activity. CDPKs are capable of decoding Ca2+ signals by phosphorylating diverse target proteins including membrane solute transporters, ion and water channels, NADPH oxidases, metabolic enzymes, cytoskeletal proteins, proteases and DNA-binding proteins (Cheng et al., 2002; Sanders et al., 2002). The CBL Ca2+ sensor is a plant-specific family. Upon Ca2+ binding, they activate serine/threonine CIPKs which in turn activate downstream signal transduction cascades (Albrecht et al., 2001). It has been proposed that myristoylation of CBLs alter their cellular location and intracellular interaction (Luan et al., 2002). It is thought that particular CBLs transduce specific environmental or developmental signals (White and Broadley, 2003). CBL–CIPK complexes are known to regulate several stress responses, such as salt, cold, drought, abscisic acid signaling and K+ shortage (Gong et al., 2004; Li et al., 2006; Pandey et al.,.
(22) 10. 2008) and are potential components of the nitrate signaling pathway (Ho et al., 2009; Hu et al., 2009).. Calcium transport Proteins The Ca2+ concentrations on both sides of the cell membrane are finely controlled by regulating influx and efflux (channels, pumps, and transporter exchangers). Therefore, environmental changes causing the opening of the calcium channel gate creates a flow of Ca2+ ions and pumps and carriers are responsible for efflux to return Ca2+ concentration to basal levels in the cytosol (Knight et al., 1996; Polisensky and Braam, 1996; Alexandre et al., 1999; Meimoun et al., 2009; Chin et al., 2013; Choi et al., 2014a). The form of a Ca2+ signature that is potentially specific to relevant decoders is determined by the interplay between influx through channels and efflux through pumps and carriers. Moreover, the cellular and tissue location of ion channels play an important role in determining stimulus specificity (Wood et al., 2000; Marti et al., 2013). In animals, transport of Ca2+ into cells is controlled by three types of channels: voltage-dependent calcium channels (VDCCs), receptor-operated calcium channels (ROCCs), and mechanical-stimulation–gated channels. Electrophysiological, biochemical and sequence analyses have revealed the existence of VDCC and ROCC in plants (Sanders et al., 2002; Nagata et al., 2004). VDCC channels are controlled by the cell membrane voltage. Polarization or depolarization of the membrane voltage opens the gate subunits and permits a flood of calcium ions through the cell membrane. In plants, calcium–permeable channels that are activated by membrane depolarization and hyperpolarization have been revealed by diverse stimulus (Ward et al., 2009). On the other hand, the ROCCs channels family (cyclic nucleotide-gated channels [CNGCs] and Glutamate receptors [iGluR]) seem to have been conserved in plants and animals (Sanders et al., 2002; Nagata et al., 2004). Ionotropic glutamate receptors (iGluR).
(23) 11. families have 20 genes identified in Arabidopsis. Glutamate receptor homologs are required for glutamate-induced depolarization and intracellular Ca2+ elevation in roots (Ward et al., 2009). Physiological and genetic studies revealed that this channel is required for proper Ca2+-fluxes underlying pollen tube growth and fertility, plant defense and wounding, among other processes (Steinhorst and Kudla, 2014).The Arabidopsis genome appears to encode 20 members of Cyclic nucleotide-gated channel (GNGC) (cyclic AMP [cAMP]) and cyclic GMP [cGMP])-gated channels (Nagata et al., 2004). Interestingly, GNGC have been implicated in diverse function in plants, including response to biotic and abiotic stress, as well as pollen tube growth (Guo et al., 2008; Tunc-Ozdemir et al., 2012; Chin et al., 2013). On the other hand, ryanodine and INOSITOL TRIPHOSPHATE (IP3) receptors in plants have not homolog proteins compared with the animal channels (Nagata et al., 2004). In animals, these receptors opened the calcium channel gate when the second messengers Cyclic ADP Ribose (cADPR) and IP3 join to the channels (Hymel et al., 1988; Finch and Augustine, 1998). Electrophysiological analysis has revealed the existence of ryanodine and IP3 receptors and calcium oscillation but their molecular identification has not been possible (Blatt et al., 1990; Gilroy et al., 1990; Sanders et al., 2002). Recent evidence suggest that the IP3 could be further phosphorylated into IP6 (Laxalt and Munnik, 2002; Lemtiri-Chlieh et al., 2003; Meijer and Munnik, 2003; Munnik and Vermeer, 2010). The IP6-induced increase in cytoplasmic calcium was shown to involve endomembrane for calcium release from internal stores and that the ability of IP6 to release Ca2+ was ~100 times more potent than IP3 (Lemtiri-Chlieh et al., 2003). Several studies suggest that changes in [Ca2+]cyt is mediated by IP3 and the PI-PLC pathway in plants (Sanchez and Chua, 2001; Perera, 2006; Perera et al., 2008; Zheng et al., 2012). Therefore, many process such as biotic and abiotic stress have involved PLC signaling pathway as important role in the response to environmental changes. ABA and.
(24) 12. heat shock treatments cause a rapid intracellular Ca2+ increase which is preceded by a transient increase in the levels of inositol 1, 4, 5-trisphosphate (IP3) (Sanchez and Chua, 2001; Zheng et al., 2012). Understanding the role of PLC and Ca2+ signaling pathway in the nitrate signaling pathway is the first step to understand the mechanistic relationships between classical Ca2+ regulatory components and nitrate responsive genes in Arabidopsis thaliana (Figure 1). In this thesis, our combined cell biology and molecular genetics approach allowed us to identify steps in the nitrate-signaling pathway that involves Ca2+ as second messenger in the regulation of prototypical nitrate responsive genes. We show that nitrate treatments cause a rapid increase of IP3 and [Ca2+]cyt levels and that blocking PLC activity inhibits both IP3 and [Ca2+]cyt increase after nitrate treatments. We provide evidence that NRT1.1/AtNPF6.3 is required for increasing both IP3 and [Ca2+]cyt in response to nitrate treatments. Altering [Ca2+]cyt or blocking PLC activities hinders regulation of gene expression of nitrate responsive genes. Our results indicate Ca2+ is a second messenger in the nitrate-signaling pathway of Arabidopsis thaliana..
(25) 13. Hypothesis. Ca+2 acts as a second messenger in the nitrate signaling pathway in Arabidopsis thaliana roots.. General Aim. To demonstrate that calcium acts as a second messenger in the nitrate signaling pathway in Arabidopsis thaliana roots.. Specific Aims. 1. To determine whether nitrate treatments trigger changes in cytoplasmic calcium concentration in Arabidopsis. 2. To evaluate the role of calcium as a second messenger in the nitrate response. 3. To identify factors that mediate changes in cytoplasmic calcium levels in response to nitrate treatments in Arabidopsis plants. 4. To identify genes regulated by calcium in response to nitrate treatments..
(26) 14. 2. MATERIALS AND METHODS. Plant Materials. Arabidopsis thaliana ecotype Col-0 was used for all experiments. The Arabidopsis line expressing cytoplasmic Aequorin (Gao et al., 2004) was obtained from Dr. Christoph Plieth, Christian-Albrechts-Universität zu Kiel, Germany. Aequorin is a haloprotein composed of two distinct units, apoaequorin and the prosthetic group coelenterazine. When Aequorin is bound to calcium, the coelenterazine is oxidized and generated blue light. The luminescence detected with a luminometer is used for determined the Ca2+ concentration. The chl1-5 and chl1-9 mutants were kindly donated by Dr. Yi-Fang Tsay, Institute of Molecular Biology, Academia Sinica, Taipei, Taiwan (Tsay et al., 1993). The chl1-5 mutant has a deletion in the genome corresponding to an 18.31-kb DNA fragment, beginning in the last NRT1.1/AtNPF6.3 intron and ending after the At1g12090 gene. This mutant has been extensively used for functional characterization of the NRT1.1/AtNPF6.3 gene. The chl1-9 plant is a point mutation of the NRT1.1/AtNPF6.3 transporter. chl1-9 lines were generated by EMS mutagenesis and isolated by chlorate selection and was found to have normal levels of CHL1 mRNA and protein (Ho et al., 2009).The amino acid Pro 492 is replaced for Leu, generating a nitrate uptake defect in the chl1-9 mutant.. Growth Conditions. Plants were grown in hydroponic cultures under long-day (16/8-h light/dark) conditions at 22ºC (in Percival incubators) using MS basal salt media without N (M531, PhytoTechnology Laboratories LLC, Shawnee Mission, KS) supplemented with 0.5 mM ammonium succinate (Merck, catalog number 1.00682) and 0.1% sucrose for 15 day (Merck, catalog number 1.07687)..
(27) 15. Plant Genotyping. To investigate the role of chl1-5 and chl1-9 in the nitrate response, we generated a stable transgenic line that expressed aequorin in the chl1-5 and chl1-9 mutant background. Aequorin-expressing chl1-5 lines (chl1-5-AQ) and chl1-9 lines (chl1-9-AQ) were generated by crosses between both NRT1.1 lines and a 35S::aequorin line (WT-AQ). Transgenic lines were selected on Murashige and Skoog medium containing 50 µg mL-1 kanamycin. chl1-5-AQ lines are genotyped using polymerase chain reaction (PCR) to amplify specific regions from genomic DNA using the following sets of primers: Forward primer 5'- TAT CCT TCA CAC ACA TGC AC-3', Reverse 1 primer 5'- AAT GCA GTC ATG CAG TTT ATG CC-3' or Reverse 2 primer 5'- CTG CCA CAC ACT GAA CAA TTC C-3'. The primer combination Forward-Reverse 1 generates a 1100 base pairs (bp) amplification product only when using genomic DNA from the chl1-5 mutant. The combination of Forward-Reverse 2 primers only generates a 1469 bp amplification product from genomic DNA extracted from WT plants. Because the chl1-5 mutant has a deletion in the genome, the primer combination Forward-Reverse 1 would generate a PCR product of 19.4-kb with wild-type genomic DNA, but a 1.1-kb fragment was amplified when using chl1-5 genomic DNA as template (Muños et al., 2004). We designed another primer, reverse 2, using the intergenic DNA sequence to identify the wild-type locus. The combination of Forward-Reverse 2 primers only generates an amplification product when using DNA extracted from wild-type plants. chl1-9-AQ lines are genotyped using polymerase chain reaction (PCR) to amplify specific regions from genomic DNA using the following sets of primers: Forward primer 5'-AGACATTGGACCGTTCCATC-3' and Reverse primer 5'-ATCGGCAATCCATGGATGAG-3'. The amplification product is 500pb using genomic DNA from chl1-9-AQ plants. The point mutation in chl1-9 changes.
(28) 16. the Proline 492 to Leucine. Hence, we sequenced the amplification products to identify the codon change from CCT (Pro) to CTT (Leu).. Chemical Treatment of Plants U73122 (catalog number U6881), U73343 (catalog number U6756), EGTA (catalog number E3889) and LaCl3 (catalog number 211605) were purchased from Sigma-Aldrich (St Louis, USA). Before harvesting plant material for analysis of gene expression, Col-0, chl1-5 and chl1-9 seedlings of 15 day were pre-treated in petri dishes for 1 h in the presence of 10µM U73122, 10µM U73343, 10 mM EGTA or 5 mM LaCl3. We evaluated the effect of PLC inhibitor (U73122), non-functional PLC inhibitor analog (U73343), channel blockers (LaCl3) and calcium chelating agent (EGTA) in WT-AQ lines. U73122 and U733343 were dissolved in 0.1% (v/v) DMSO (catalog number 317275) and LaCl3 was dissolved in water (Merck, catalog number 1.15333). For LaCl3 treatments, the medium was replaced with water to prevent unwanted precipitation with media components. Plants were then treated for 1 h with 5mM KNO3 or 5mM KCl and then roots were harvested and immediately frozen in liquid N2. For aequorin measurements and the inositol-1,4,5-triphosphate. (IP3). levels,. the. plants. were. pre-treated. with. all. pharmacological agents for 1h and then treated for the indicated period of time with 5mM KNO3 or 5mM KCl.. In vivo Reconstitution of Aequorin and Ca2+-Dependent Luminescence Measurements Reconstitution of aequorin in vivo with coelenterazine (CTZ) was performed as described previously (Knight et al., 1996). Synthetic native CTZ was obtained from Sigma-Aldrich (cat N° C2230). Briefly, we incubated 14 days old seedlings overnight in the dark with 2.5 µM CTZ. To measure calcium increases, excised root organs and whole seedlings were.
(29) 17. placed in a 5 mL glass cuvette to measure luminescence immediately after treatments. Luminescence measurements were performed using a Sirius single-tube luminometer (Berthold Detection Systems). Five washed root organs and whole seedlings were used for each experiment. Luminescence was recorded every 0.2 s during ten minutes. The first two minutes were used to stabilize the plants in the luminometer and then the plants were treated with 5mM KNO3 or 5mM KCl as control for three minutes. Finally, we added 1 M CaCl2 and 10% ethanol to discharge remaining aequorin in the plants, and measured luminescence for 5 additional minutes. To convert luminescence into Ca2+ concentrations, we calculated the Ca2+ concentrations according to the calibration equation of Knight H. et al (1996): pCa = 0.332588(-log k) + 5.5593 Where k is equal to luminescence counts per second of the plants divided by total remaining counts in plants treated with 1 M CaCl2 and 10% ethanol.. Inositol-1,4,5-Triphosphate (IP3) Assays IP3 was measured as described previously (Heilmann and Perera, 2013). Briefly, plants were treated for 10 seconds with 5mM KNO3 or 5mM KCl and then roots were harvested and frozen immediately in liquid N2. Frozen tissue (approximately 0.1 g) was grounded to powder under liquid N2 and incubated with 200 µL of 10% perchloric acid on ice for 20 min. Perchloric acid was obtained from Sigma-aldrich (catalog number 244252). Samples were centrifuged to remove precipitates and supernatants were transferred to new tubes and the pH adjusted to 7.5 using 1.5 M KOH/60 mM HEPES. IP3 was measured using the Inositol-1,4,5-triphosphate [3H] radioreceptor assay kit (NEK 064 PerkinElmer) according to the instructions of the manufacturer. Briefly, the basic principle of radioreceptor assay kit is a competitive ligand binding, where a radioactive ligand competes with a non-.
(30) 18. radioactive ligand for a membrane preparation containing the IP3 receptor. The decrease of 3. H inositol trisphosphate ([3H]IP3) bound to the receptor is inversely proportional to the. increase of the amount of unlabelled ligand bound to the receptor. Then, we can calculate the IP3 concentration in the different samples by interpolation into a standard curve using IP3 standards of known concentration.. RNA Isolation and RT-qPCR. RNA was isolated from whole roots with the Trizol® reagent according to the instructions of the manufacturer (catalog number 15596-026, Invitrogen, Carlsbad, CA, USA). cDNA synthesis was carried out using the Improm-II reverse transcriptase (catalog number A3802) according to the instruction of the manufacturer (Promega, Madison, USA). RTqPCR was carried out using the Brilliant® SYBR® Green QPCR Reagents on a Stratagene MX3000P qPCR system. The RNA levels were normalized relative to the clathrin adaptor complexes medium subunit family protein (At4g24550).. Gene Expression Analysis. cDNA synthesis, array hybridization and normalization of the signal intensities were performed according to the instructions provided by Affymetrix. Data was normalized in the R software using robust multiarray analysis (RMA) (Irizarry et al., 2003). Normalized data was subjected to a two-way ANOVA analysis with a p<0.05 and a false discovery rate of 5%. For the ANOVA analysis, we used a model considering the expression of a given gene Y as Yi = β0 + β1T + β2G + β3TG + ε, β0 being the global mean, β1, β2 and β3 the effects of the treatment, the genotype and the interaction between these two factors respectively. The variable ε was defined as the unexplained variance. Next, we analyzed our data using the Sungear tool available in the VirtualPlant webpage (Poultney et al.,.
(31) 19. 2006; Katari et al., 2009). Sungear allows performing comparative studies of multiple data sets to determine genes that are unique or that are shared by different gene lists. In this case, sungear generated a triangle, representing all genes with a significant factor in the ANOVA model at the vertices (T, F o TF factor). Circles inside the triangle represent genes with the different ANOVA models found, significant factors indicated by the vertices pointed by the arrows around the vessels. Based on the sungear analysis, we can identify four main signaling groups: group 1, group 2, group 3 and group 4. Genes belonging to each group were exported to PlantGSEA toolkit (Yi et al., 2013). PlantGSEA allows a rigorous analysis of over-representation using Fisher’s exact test for declaring a GO (Gene Ontology) category and the generation of a P-value. In order to focus on specific functions, we only considered GO terms at level 6, 7 and 8 and removed redundant terms using the REVIGO tool (Supek et al., 2011).. Construction of 35S::PLC4:GFP gene fusion. To investigate the role of PLC4 in the nitrate response, we generated a stable transgenic line that expressed 35S::PLC4 in Col-0 background. For the chimeric 35S::PLC4:GFP gene fusion, the CDS of PLC4 (At5g58700) was amplified from cDNA from the A. thaliana ecotype Col-0. The following primers were used to amplify PLC4 CDS and were designed to introduce NcoI and SpeI restriction sites: PLC4 CDS forward, 5’- GCC CCA TGG AAG GAA AA and reverse, 5’-CAC TAG TGA CAA ACT CGA AG. The PCR product and plasmid were digested with NcoI and SpeI, and DNA fragments were ligated into pCAMBIA 1302 (CAMBIA, Canberra, Australia). The construct was verified by DNA sequencing and then introduced into Agrobacterium tumefaciens GV3101. A. tumefaciensmediated transformation of Arabidopsis plants was accomplished using the floral dip protocol (Clough and Bent, 1998). Transformants were selected on Murashige and Skoog.
(32) 20. medium containing 50 µg mL-1 hygromycin. T3 lines were screened by hygromycin resistance analysis.. Phosphatidic acid assay. PA was measured as described previously (Munnik and Zarza, 2013). Briefly, 14 day-old seedlings were pre-labelled overnight with. inorganic. 32. P-orthophosphate (32Pi). (NEK0534H002MC, Perkin Elmer). At the beginning day 15, seedling were treated with KNO3 or KCl for 30, 60, 120, 300 and 600 seconds. As positive control we used treatment with 300 mM NaCl for 30 minutes. Plant lipids were extracted with organic solvent and were separated by alkaline thin layer chromatography (TLC). TLC were exposed to a Phosphoimager screen for 1 h. Labelled phospholipids were measured through densitometry of each lipid and were normalized for total lipids..
(33) 21. 3. RESULTS. Nitrate treatments increase cytoplasmic calcium concentration in plant root and seedling. Calcium is an essential second messenger in plant signaling processes (Bush, 1995; Trewavas and Malho, 1998). Increase in [Ca2+]cyt has been recorded in cellular responses to several stimuli (Sanders et al., 1999). As a first step to determine whether calcium acts as a second messenger in the nitrate signaling pathway, we measured [Ca2+]cyt in Arabidopsis root organs and whole seedlings treated with nitrate. Plants expressing cytoplasmic aequorin (WT-AQ) (Gao et al., 2004) were grown hydroponically for two weeks with ammonium as the only N source. We treated plants with 5 mM KNO3 (or 5 mM KCl) at dawn on the 15th day and luminescence was measured every 0.2 s thereafter. Nitrate treatment increases [Ca2+]cyt in root organs (Fig. 2A) and whole seedlings (Fig2B). A lower peak was observed in KCl treatments (Fig. 2A-B). After reaching a maximum, [Ca2+]cyt decreased to near basal levels (Fig. 2A-B). It is known that abiotic and biotic cues such as sugar, salt and drought stress can increase strong and transiently [Ca2+]cyt in roots and leaves (Furuichi et al., 2001; Choi et al., 2014b; Johnson et al., 2014). This increase in [Ca2+]cyt can be partially abolished by the use of Ca2+ channel blockers such as lanthanum. Pretreatment of WT-AQ plant roots and seedlings with 5 mM LaCl3 for 1 hour inhibited the [Ca2+]cyt increase observed in response to nitrate treatment (Fig.3A-B). A similar response was observed in pretreatments with EGTA (Fig.3C). These results indicate that nitrate treatments cause a specific increase in [Ca2+]cyt in root cells and seedlings of Arabidopsis thaliana..
(34) 22. A 200. KNO3. [Ca2+]cyt nM. KCl 150 100 50 0 0. 20. 40. 60. Time (s). B KNO3 KCl. [Ca2+]cyt nM. 300. 200. Peak II. 100. Peak I 0 0. 20. 40. 60. 80 100 120 140 160 180. Time (s) Figure 2. Nitrate treatments increase [Ca2+]cyt levels. Wild-type plants expressing cytoplasmic aequorin were grown hydroponically for two weeks with 1 mM ammonium as the only N source. Aequorin was reconstituted by incubating plants in 2,5 µM coelenterazine overnight in dark. Cytosolic Ca2+ concentrations were monitored in A) root organs and B) whole seedlings over time in response to 5 mM KNO3 or 5 mM KCl treatments. Plotted values correspond to the mean of at least three independent biological replicates ± standard deviation..
(35) 23. A 300. Mock KNO3 Mock KCl. 200. 100. LaCl3 KNO3 LaCl3 KCl. [Ca2+]cyt nM. [Ca 2+]cyt nM. 300. 0. 200. 100. 0 0. 20. 40. 60. 0. 20. Time (s). 40. 60. Time (s). B Mock KNO3. 300. LaCl3 KNO3. 300. LaCl3 KCl. [Ca2+]cyt nM. [Ca2+]cyt nM. Mock KCl 200. 100. 0. 200. 100. 0 0. 20. 40. 60. 80 100 120 140 160 180. 0. 20. 40. 60. 80 100 120 140 160 180. Time (s). Time (s). C EGTA KCl. [Ca2+]cyt nM. [Ca2+]cyt nM. 200. 100. EGTA KNO3. 300. Mock KNO3 Mock KCl. 300. 200. 100. 0. 0 0. 20. 40. 60. 80 100 120 140 160 180. Time (s). 0. 20. 40. 60. 80 100 120 140 160 180. Time (s).
(36) 24. Figure 3: LaCl3 and EGTA treatments altered the increase [Ca2+]cyt levels in response to nitrate. Wild-type plants expressing cytoplasmic aequorin were grown hydroponically for two weeks with 1 mM ammonium as the only N source. WT-AQ was reconstituted by incubating plant roots in 2,5 µM coelenterazine overnight in dark. WT-AQ were pretreated with Mock (H20), LaCl3 and EGTA for 1 hour and then treated for the indicated period of time with 5mM KNO3 or 5mM KCl. Cytosolic Ca2+ concentrations were monitored over time in A) root organs and B) whole seedlings or C) with EGTA in whole seedling. Plotted values correspond to the mean of at least three independent biological replicates ± standard deviation..
(37) 25. PI-PLC activity is required for changes in cytoplasmic calcium levels in response to nitrate treatments in Arabidopsis thaliana. In order to identify components of the signal transduction pathway mediating changes in cytoplasmic calcium levels in response to nitrate, we first determined whether a phospholipase C (PLC)-dependent pathway was implicated in this [Ca2+]cyt increase. We evaluated the effect of a PLC inhibitor (U73122) and a non-functional PLC inhibitor analog (U73343) in WT-AQ lines in response to KNO3 or KCl treatments. WT-AQ plants were pre-treated for 1 h with 10 µm U73122 or U73343 and luminescence of plant root and seedling were recorded after KNO3 or KCl treatments using the same experimental conditions described above. The presence of PLC inhibitor (U73122) altered the [Ca2+]cyt increase in response to nitrate treatments in plant roots and seedlings (Fig. 4A-B). However, treatments with non-functional analog (U73343) did not affected the [Ca2+]cyt increase in Arabidopsis roots and seedlings (Fig. 4A-B). These results suggest that products of PLC enzyme activity or metabolites produced thereof trigger the [Ca 2+]cyt increase in response to nitrate treatments. As an independent confirmation that a PLC activity was induced under our experimental conditions, we measured IP3 content after nitrate treatments in Arabidopsis roots. Wild-type plants were grown and treated with KNO3 or KCl under the same experimental conditions described above and were quickly collected and frozen in liquid nitrogen. Treatment with 5 mM KNO3 resulted in a 3-fold increase of IP3 levels as compared to the KCl control 10 s after the treatment (Fig. 4C). Pretreatment of plants with U73122 (but not with U73343) completely blocked IP3 increase in response to nitrate (Fig.4C). These results indicate that PLC activity is required for IP3 accumulation as well as increase in [Ca2+]cyt in response to nitrate treatments under our experimental conditions..
(38) 26. A U73343 KNO3. 200. U73122 KNO3. 200. U73122 KCl. 150. [Ca2+]cyt nM. [Ca2+]cyt nM. U73343 KCl. 100 50. 150 100 50 0. 0 0. 20. 40. 0. 60. 20. 40. 60. Time (s). Time (s). B U73343 KNO3 U73343 KCl. 200. 100. 0 20. 40. 60. 80 100 120 140 160 180. Time (s). Inositol Triphosphate (pmol/g fresh weight). 100. 8. b b. 6 4. a 0. a. 10 Mock. a. 0. a. 10. U73343. 0. 20. 40. 60. 80 100 120 140 160 180. Time (s). C. 0. 200. 0 0. 2. U73122 KNO3 U73122 KCl. 300. [Ca2+]cyt nM. [Ca2+]cyt nM. 300. a. 0. a a. 10. U73122. Time (s).
(39) 27. Figure 4. A PLC inhibitor blocks increases in [Ca2+]cyt and inositol-1,4,5trisphosphate (IP3) levels in response to nitrate treatments. Wild-type plants expressing cytoplasmic aequorin (WT-AQ) were grown hydroponically for two weeks with 1mM ammonium as the only nitrogen source and [Ca2+]cyt and IP3 levels were assayed as described in the main text. A) WT-AQ root organs and B) whole seedlings were pretreated with U73122 (PLC inhibitor) and U73343 (non functional analog) for 1 hour and then we were monitored the [Ca2+]cyt levels over time after 5mM KNO3 or 5mM KCl. (C) Plants were pretreated with Mock, U73122 (inhibitor of PLC) and U73343 (analogous no functional) and we evaluated the IP3 content in response to 5mM KNO3 or 5mM KCl treatment. Plotted values correspond to means of three independent biological replicates ± standard deviation. Gray bars represent time 0 (before treatment), white bars represent KCl treatment, and black bars represent KNO3 treatment. The letter indicates means that significantly differ between control and treatment conditions (P < 0.05).
(40) 28. NRT1.1 is a positive regulator of the [Ca2+]cyt increase in response to nitrate treatments. Several lines of evidence indicate that NRT1.1/AtNPF6.3 is a nitrate sensor in Arabidopsis plants (Ho et al., 2009; Wang et al., 2009; Gojon et al., 2011). To determine whether the increase in [Ca2+]cyt in response to nitrate requires a functional NRT1.1/AtNPF6.3, we generated a stable transgenic line that constitutively expresses aequorin in a nrt1.1-null background. Aequorin-expressing chl1-5 lines (chl1-5-AQ) were generated by crossing the chl1-5 mutant (Tsay et al., 1993) and a transgenic line containing the 35S::Aequorin construct (WT-AQ) (Gao et al., 2004). We measured [Ca2+]cyt in chl1-5AQ plants in response to nitrate using the same experimental design described in the previous section. As we show in Figure 5B, the [Ca2+]cyt increase by nitrate was significantly reduced in the chl1-5-AQ line, as compared to wild-type plants. As chl1-5 is a mutant that does not express NRT1.1/AtNPF6.3 transcript (Tsay et al., 1993), these results did not distinguish whether the effect on [Ca2+]cyt was caused by a defect in nitrate signaling or nitrate transport. We generated a chl1-9-AQ to evaluate [Ca2+]cyt and distinguished between these two possibilities. A point mutation in chl1-9 reduces NRT1.1/AtNPF6.3 nitrate uptake but does not affect the signaling function of NRT1.1 (Ho et al., 2009). As shown in Figure 5C, [Ca2+]cyt are lower in chl1-9-AQ plant root as compared to wild-type in response to nitrate treatments, and are comparable with the results obtained for the chl1-5-AQ line. These results indicate that [Ca2+]cyt increase by nitrate depends on NRT1.1/AtNPF6.3 nitrate transport. In order to evaluate whether NRT1.1/AtNPF6.3 was part of the nitrate-PLC-Ca2+ pathway, we measured IP3 content in chl1-5 and chl1-9 mutant root organs after nitrate treatments. chl1-5 and chl1-9 plants were grown for 15 days and were treated with 5 mM KNO3 or KCl as control and IP3 content was measured. In contrast to the increase in IP3.
(41) 29. A. B WT-AQ KNO3. 200. chl1-5-AQ KNO 3. 200. chl1-5-AQ KCl. 150. [Ca 2+]cyt nM. [Ca2+]cyt nM. WT-AQ KCl. 100 50. 150 100 50 0. 0 0. 20. 40. 0. 60. 20. 40. 60. Time (s). Time (s). C. D chl1-9-AQ KNO3. 200. WT-AQ KNO3. 250. WT-AQ KCl. 150. [Ca2+]cyt nM. [Ca2+]cyt nM. chl1-9-AQ KCl. 100 50. 200 150 100 50 0. 0 0. 20. 40. 60. 0. 20. 40. 60. 80 100 120 140 160 180. Time (s). Time (s). F chl1-5-AQ KNO3 chl1-5-AQ KCl. [Ca2+]cyt nM. 250 200 150 100 50 0 0. 20. 40. 60. 80 100 120 140 160 180. Time (s). Inositol Triphosphate (pmol/g fresh weight). E. T0 KCl KNO3. 8. b 6 4. a a. a. a. a. a. a. a. 2 0. 0. 10 WT. 0. 10 chl1-5. 0. 10 chl1-9. Time (s).
(42) 30. Figure 5. NRT1.1 is required for increases in [Ca2+]cyt and inositol-1,4,5-trisphosphate (IP3) levels in response to nitrate treatments. Wild-type, chl1-5 and chl1-9 plants were grown hydroponically for two weeks with ammonium as the only nitrogen source and [Ca2+]cyt and IP3 content were assayed as described in the main text. A) WT-AQ, B) chl15-AQ and C) chl1-9-AQ root organs and D) WT-AQ and E) chl1-5-AQ whole seedling were reconstituted by incubating plants in 2,5 µM coelenterazine overnight in darkness. At the beggining day were monitored the Cytosolic Ca2+ concentrations over time after 5mM KNO3 or 5mM KCl treatment. F) Wild-type, chl1-5 and chl1-9 plants were treated with 5mM KNO3 and 5mM KCl as control for 10s and then we evaluated de IP3 content. Plotted values correspond to means of at least three independent biological replicates ± standard deviations. Gray bars represent time 0 (before treatment), white bars represent KCl treatment, and black bars represent KNO3 treatment. The letter indicates means that significantly differ between control and treatment conditions (P < 0.05).
(43) 31. levels in wild-type plant roots, there was no significant increases in IP3 content in chl1-5 and chl1-9 mutant plant roots after KNO3 treatments (Fig. 5F). This result indicates that accumulation of IP3 in Arabidopsis roots in response to nitrate treatments also requires NRT1.1/AtNPF6.3 nitrate transport activity for activation of a PLC in response to nitrate treatments..
(44) 32. Nitrate-induced gene expression is mediated by NRT1.1, PLC and Ca2+. In order to evaluate the impact of this signaling pathway on nitrate regulation of gene expression, we analyzed the expression of characteristic nitrate-responsive genes in WT, chl1-5 and chl1-9 plant roots treated with the calcium channel blocker LaCl3 or the PLC inhibitor U73122. Total RNA was isolated and mRNA levels were measured for selected genes using reverse transcription and quantitative real time polymerase chain reaction. In Fig. 6, NRT2.1, TGA1, NIR, NRT3.1, AFB3 and NIA1 gene expression is induced after KNO3 treatments. As has been previously described (Ho et al., 2009; Wang et al., 2009; Alvarez et al., 2014; Vidal et al., 2014a), the induction of these genes by nitrate was significantly reduced in the chl1-5 and chl1-9 mutant as compared with wildtype plants. To determine whether the expression of these nitrate-responsive genes is mediated by PLC activity and Calcium, we pretreated WT, chl1-5 and chl1-9 plants with the PLC inhibitor U73122 or the calcium channel blocker LaCl3, and then we treated with 5 mM KNO3 or 5 mM KCl. Similarly, nitrate induction of NRT2.1, TGA1, NRT3.1, NIR and NIA1 were significantly reduced in the presence of U73122 or LaCl3 and are comparable with results obtained for the chl1-5 and chl1-9 mutants (Fig. 6 and 7). In contrast, the induction of AFB3 by nitrate was not significantly affected by U73122 and LaCl3. This indicates that NRT1.1/AtNPF6.3, a PLC activity and the increase in cytosolic calcium levels are required for changes in gene expression in response to nitrate treatments in Arabidopsis. These results suggest the existence of a Ca2+-dependent and a Ca2+independent pathways downstream of NRT1.1/AtNPF6.3 to control gene expression of nitrate-responsive genes.
(45) 33. 1.0. a. TGA1. a. 0.8 0.6. b. b. 0.4. b. 0.2 0.0. b WT. 1-5. 1-9. WT. 1-5. U73343. Relatives levels mRNA. Relatives levels mRNA. NRT2.1. 1-9. 0.15. a 0.10. b. 0.00. WT. U73122. b. 1-5. b. 1-9. b. b WT. U73343. 1-5. Relatives levels mRNA. Relatives levels mRNA. 40. WT. 1-9. 2.0. b. b b. b. 1-5. 1-9. 0.2. 1-5. U73343. 1-9. WT. U73122. Relatives levels mRNA. Relatives levels mRNA. ab. WT. b. b. 1.0 0.5. c. c 0.0. WT. 1-5. 1-9. WT. 1-5. 1-9. U73122. NIA1. a. 0.0. 1-9. U73122. U73343. 0.8. b. 1-5. 1.5. AFB3. 0.4. b. a. U73122. 0.6. WT. b. NRT3.1. a. 0. b. U73343. 60. b. 1-9. 1-5. NIR. 20. b. 0.05. 15. a 10. b. b 5. 0. b b. b. WT. 1-5. U73343. 1-9. WT. 1-5. 1-9. U73122.
(46) 34. Figure 6. Induction of gene expression in response to nitrate treatments is mediated by NRT1.1 and PLC activity in roots. Col-0, chl1-5 and chl1-9 plants were grown for 15 days. Plant roots were pre-treated for 1 h with 10 µM U73122 (PLC inhibitor) or 10 µM U73343 (non-functional PLC inhibitor analog) and then treated for 1h with 5 mM KNO3 or 5 mM KCl. Plotted values correspond to means of three independent biological replicates ± standard deviations. White bars represent KCl treatment, and black bars represent KNO3 treatment. We evaluated the gene expression of NRT2.1, nitrate transporter 2.1; TGA1, transcription factor; NIR, nitrite reductase, NRT3.1, nitrate transporter 3.1; AFB3, auxin receptor and NIA1, nitrate reductase. The letters indicates means that significantly differ between control and treatment conditions (P < 0.05)..
(47) 35. TGA1. a. 1.5. Relatives levels mRNA. Relatives levels mRNA. NRT2.1 a 1.0. b. b. 0.0. WT. 1-5. 1-9. b. b. 0.5. WT. 1-9. 1-5. Mock. 0.3. a. 0.2. 0.0. WT. LaCl3. c bc b. b. b. 20. 1-9. WT. Mock. 1-5. Relatives levels mRNA. Relatives levels mRNA. 60. 1-5. 1-9. 5. 3. Relatives levels mRNA. b. b b. 1-5 Mock. 1-9. WT. 1-5 LaCl3. 1-9. Relatives levels mRNA. WT. b. b. 2. b. b 1 0. WT. 1-5. 1-9. WT. 1-5. b. 1-9. LaCl3. NIA1. 0.2. 0.0. 1-9. LaCl3. Mock. a b. 1-5. 4. LaCl3. a. 0.4. b. a. AFB3 0.6. WT. b. NRT3.1. a. WT. b. Mock. 80. 0. 1-9. 1-5. NIR. 40. b. b. 0.1. 20. a. 15 10. c 5 0. b WT. 1-5 Mock. b. 1-9. WT. b. b. 1-5. 1-9. LaCl3.
(48) 36. Figure 7. Induction of gene expression in response to nitrate treatments is mediated by NRT1.1 and Ca2+ in roots. Col-0, chl1-5 and chl1-9 plants were grown for 15 days. Plants were pre-treated for 1 h with 5 mM LaCl3 (channels blockers) and then treated for 1 h with 5 mM KNO3 or 5 mM KCl as control. Plotted values correspond to means of three independent biological replicates ± standard deviations. White bars represent KCl treatment, and black bars represent KNO3 treatment. We evaluated the gene expression of NRT2.1, nitrate transporter 2.1; TGA1, transcription factor; NIR, nitrite reductase, NRT3.1, nitrate transporter 3.1; AFB3, auxin receptor and NIA1, nitrate reductase. Letters indicate means that significantly differ between control and treatment conditions (P < 0.05)..
(49) 37. Transcriptome changes associated to PLC activity are important for the nitrate response. To assess the role of PLCs in the nitrate response we analyzed the global gene expression profile of plants treated with U73122 (PLC inhibitor) and U73343 (non-functional analog). Col-0 plants were grown in ammonium succinate as the only N source for 14 days and were pre-treated at the beginning of the light period on day 15 with 10 µM U73122 or U73343 for 1 hour. We then treated the plants with 5 mM KNO3 or 5 mM KCl for 1h. Total RNA was isolated from roots and prepared for Affymetrix ARAGENE gene chip. ARAGENE gene chip 1.0 ST array have whole-transcriptome coverage of Arabidopsis thaliana. The whole-transcriptome analysis approach allows to detect multiple transcript isoforms, such as splice variants, non-polyadenylated transcripts and truncated transcripts. Gene expression data were normalized using RMA and differential gene expression was determined using a two-way analysis of variance (ANOVA). Since our primary goal was to identify genes whose nitrate regulation was altered in the presence of U73122, we used an ANOVA model considering the expression of a given gene Y as Yi = β0 + β1T + β2F + β3TF + ε, β0 being the global mean, β1, β2 and β3 being the effects of the treatment with KNO3(T), Pharmacological treatment (F) and the interaction between those two factors (TF), respectively, and ε being the unexplained variance. We found 611 genes showing significant T factor, 1079 genes showing significant F factor and 228 genes exhibiting a significant TF interaction factor. To simplify the analysis of our results and to have a first insight into how PLC activity regulates gene expression in response to nitrate, we analyzed our data using the Sungear tool available in the VirtualPlant webpage (Poultney et al., 2006; Katari et al., 2009). Sungear allows for the visualization and analysis of multiple data sets to determine genes that are unique or that are shared by different gene lists. In this case, sungear.
(50) 38. generated a triangle, representing the genes with significant T, F or TF factors (Figure 9). Every vertices in the triangle represents a factor of the anova model, and the circles inside the triangle (vessels) represent the number of genes with anova models with significant factors, indicated by the arrow around the vessels. Using Sungear, we found that 228 genes have TF as a significant factor, indicating that PLC activity is necessary for the expression in response to nitrate of such genes (group 1). In addition, 233 genes were affected by nitrate and U73122 treatments as the significant factors, indicating that the nitrate response of these genes is altered by nitrate signal or PLC activity (group 2). Moreover, we observed that 242 genes are not affected by U73122, indicating that the nitrate response of these genes is not influenced by PLC activity (group 3). Finally, we visualized that 666 genes are affected only by the U73122 treatment, indicating that PLC activity is also important for the regulation of the expression of genes that not respond to nitrate (group 4). To uncover regulatory functions of genes whose response depends on PLC activity, we performed a Gene ontology (GO) analysis of genes present in the different groups. We identified. GO. terms. using. PlantGSEA. tool. (http://structuralbiology.cau.edu.cn/PlantGSEA) and in order to focus on specific functions, we only considered GO terms at level 6, 7 and 8 and removed redundant terms using the REVIGO tool (Canales et al., 2014). PlantGSEA is a method for interpreting biological meaning of a list of genes by computing over 20.290 defined genes sets derived from different resources of annotation systems. PlantGSEA allows a statistical analysis of over-representation generating a P-value and a FDR value. The lower the P-value is, the higher the significance of the overrepresentation. According to our GO analysis, group 1 genes participate in inorganic anion transport, organic cation transport, nitrate transport and phosphorylation, among others (table 1). Moreover, group 2 genes participate in the iron response and ion transport,.
(51) 39. Figure 8. Sungear analysis of genes with significant Treatment (T), Pharmacological (F) and Treatment:pharmacological (TF) interaction factors reveal that PLC activity regulates the expression of nitrate-responsive genes and genes that do not respond to nitrate. The list of genes with significant factors obtained by two-way ANOVA of Affymetrix data is represented in a Venn diagram using the VirtualPlant tool Sungear (http://www.virtualplant.org). The Sungear triangle shows the factors (T, F, and TF) at the vertices (anchors). The circles inside the triangle (vessels) represent the genes controlled by the different factors, as indicated by the arrows around the vessels. The area of each vessel (size) is proportional to the number of genes associated with that vessel. The number of genes in the vessel is shown next to the corresponding vessel..
(52) 40. cellular response to lipid, cellular response to nitrate and flavonoid metabolic process (table 2). Group 3 is a set of genes that only respond to nitrate and GO analysis indicates that they participate in response to cadmium ion, monosaccharide metabolic process, isocitrate metabolic process, tricarboxylic acid metabolic process, amino acid homeostasis, oxidoreduction coenzyme metabolic process, primary root development, secondmessenger-mediated signaling, among others. These categories are almost identical to those found for genes that respond directly to nitrate (Wang, 2003; Canales et al., 2014). The most consistent biological functions are those related to nitrate transport, carbon metabolism and root development that has been studied in the context of nitrate responses (table 3). Finally, group 4 genes participate in many other processes such as response to chitin, carbohydrate, light, hormone stimulus, defense response, heat response, hyperosmotic salinity response, among other perturbations (table 4). Altogether, these results indicate that PLC activity is important in a myriad of biological processes that has been previously studied in response to multiple abiotic and biotic cues (Stevenson et al., 2000; Munnik and Testerink, 2008; Chen et al., 2011). These results also suggest that PLC activity is important for gene expression in response to nitrate..
(53) 41. Table 1. Term ID GO:0010200 GO:0015698 GO:0015695 GO:0015706 GO:0010363 GO:0030001 GO:0006612 GO:0071323 GO:0009808 GO:0016310 GO:0009812 GO:0009627 GO:0009813 GO:0006694 GO:0006468 GO:0009873 GO:0000041 GO:0071407 GO:0009750. Description response to chitin inorganic anion transport organic cation transport nitrate transport regulation of plant-type hypersensitive response metal ion transport protein targeting to membrane cellular response to chitin lignin metabolic process phosphorylation flavonoid metabolic process systemic acquired resistance flavonoid biosynthetic process steroid biosynthetic process protein phosphorylation ethylene-activated signaling pathway transition metal ion transport cellular response to organic cyclic compound response to fructose. p-value 1,79E-10 1,25E-05 7,70E-05 9,60E-05 0,00011898 0,00013507 0,00015994 0,0002299 0,00059509 0,00130998 0,00149146 0,00198796 0,00319113 0,00361642 0,00485091 0,00503336 0,00588938 0,00818574 0,00903585. Gene ontology analysis of group 1 genes. The gene table was obtained from Sungear analysis of the genes with significant TF factor. We identified GO terms using PlantGSEA toolkit with significance of p<0.01 and FDR 1%. In order to focus on specific functions, we only considered GO terms at level 6, 7 and 8 and removed redundant terms using the REVIGO tool..
(54) 42. Table 2. Term ID GO:0006826 GO:0071396 GO:0071249 GO:0009812 GO:0006821 GO:0072330 GO:0010363 GO:0072523 GO:0010583 GO:0009627 GO:0006612 GO:0009813 GO:0046189 GO:0030001 GO:0006094 GO:0019761 GO:0010200 GO:0046482 GO:0006576 GO:0000041 GO:0009699 GO:0009141 GO:0072511. Description iron ion transport cellular response to lipid cellular response to nitrate flavonoid metabolic process chloride transport monocarboxylic acid biosynthetic process regulation of plant-type hypersensitive response purine-containing compound catabolic process response to cyclopentenone systemic acquired resistance protein targeting to membrane flavonoid biosynthetic process phenol-containing compound biosynthetic process metal ion transport gluconeogenesis glucosinolate biosynthetic process response to chitin para-aminobenzoic acid metabolic process cellular biogenic amine metabolic process transition metal ion transport phenylpropanoid biosynthetic process nucleoside triphosphate metabolic process divalent inorganic cation transport. p-value 0,00012283 0,00015238 0,0002299 0,00149146 0,00157228 0,00171082 0,00174303 0,00176341 0,00195713 0,00198796 0,00219763 0,00319113 0,00344142 0,00360589 0,00390913 0,0042584 0,00429835 0,0045184 0,00489103 0,00588938 0,00782203 0,00955554 0,00977351. Gene ontology analysis of group 2 genes. The gene table was obtained from Sungear analysis of the genes with both T and F significant factor. We identified GO terms using PlantGSEA toolkit with significance of p<0.01 and FDR 1%. In order to focus on specific functions, we only considered GO terms at level 6, 7 and 8 and removed redundant terms using the REVIGO tool..
Figure
![Figure 2. Nitrate treatments increase [Ca 2+ ] cyt levels. Wild-type plants expressing cytoplasmic aequorin were grown hydroponically for two weeks with 1 mM ammonium as the only N source](https://thumb-us.123doks.com/thumbv2/123dok_es/7329942.454141/34.892.182.619.130.822/nitrate-treatments-increase-expressing-cytoplasmic-aequorin-hydroponically-ammonium.webp)


+5


![Figure 12. A simplified model of the nitrate signaling pathway. Nitrate is sensed by NRT1.1 and (i) activates a PLC activity that increase [Ca 2+ ] cyt levels or (ii) Ca 2+ -independent pathways](https://thumb-us.123doks.com/thumbv2/123dok_es/7329942.454141/64.892.158.798.144.282/simplified-signaling-nitrate-activates-activity-increase-independent-pathways.webp)

Documento similar
In this investigation we have addressed (i) the study of the expression level of IF1 in different prevalent human carcinomas, (ii) the metabolic and signaling events that mediate
To evaluate the effect of compounds on the expression of parameters related to HRI (ROS, hormone levels, and gene expression), a factorial ANOVA was conducted for each olive
The expression of most of the genes comprised in lung AM-related module 296 was upregulated in VHL-deficient AMs compared to control WT cells, including its associated
Mutations in ING1 accelerated flowering in LD, but caused no flowering alterations in SD, indicating that this protein acts as a repressor of flowering under long photoperiods. The
The genes that were included in group 2 (apoptosis and cell senescence) were the most frequently altered in the present meningioma study, as 7 out of 14 (50%) genes were abnormally
In addition, in contrast to the effects observed in established colon carcinoma cell lines, 1,25(OH) 2 D 3 does not affect the expression of key genes of the Wnt/β-catenin
In order to analyze if the candidate genes contained in the amplicons are altered in primary tumors and other cell lines, we analyzed expression data obtained in a previous study
Discarding the role of LrpC in global gene expression, the in vivo localization of GFP-LrpC during vegetative role was addressed, in order to obtain a hint of the possible
