TítuloEffects of the use of construction and demolition waste aggregates in cold asphalt mixtures
29
0
0
Texto completo
(2) Effects of the use of construction and demolition waste aggregates in cold asphalt mixtures B. Gómez-Meijide a,* and I. Pérez a a. E.T.S.I. Caminos, Canales y Puertos, Universidade da Coruña. Campus de Elviña s/n, 15071. A Coruña, Spain. *Corresponding autor. Tel.: +34-981167000. Fax: +34-981167170 E-mail addresses: [email protected] (B. Gómez Meijide), [email protected] (I. Pérez). Abstract: Cold asphalt mixtures (CAM) with 100% recycled aggregates from construction and demolition waste (CDW) were researched to ecologically and economically improve cold asphalt mixtures. The present study indicates that the UCS, ITS, ITSM and moisture susceptibility were very satisfactory not only compared with a control mix with 100% natural aggregates (NA) but also with values given by different standards and recommendations. A new global approach to design these aggregates has also been explored because conventional methods are inaccurate in this case.. Keywords: Construction and Demolition Waste; cold asphalt mixture; sustainable pavement engineering; Indirect Tensile Strength; Indirect Tensile Stiffness Modulus. 1. Introduction Cold asphalt mixes (CAM) have been considered inferior to hot-mix asphalt (HMA) in the last several decades, mainly due the high air-void content of the compacted mixtures, their weak early life strength and the long curing times required to achieve an optimal performance [1]. After lay-down, these mixtures need to pass through a number of stages in which the binder and mastic cohesion, binder-aggregate adhesion and mixture shear strength develop. During these stages, cold asphalt does not lend itself to studies of the influence of material and/or process variables, e.g., moisture condition, on its mechanical properties [2]. This drawback is due to the associated peculiarities of cold asphalt, which include the presence of water,. 1.
(3) emulsion-aggregate reactivity, evolving characteristics with time and an undeveloped internal structure [3]. Many studies have been conducted to minimise these considerations and approximate hot asphalt mixtures, such as incorporating a certain amount of cement, as well as modified asphalt emulsions in the mixture [4-6]. In addition, cold mixes have features that make them preferable to hot mixes, such as a lower energy consumption, ecological impact, economic costs or occupational hazards for operators. Moreover, cold mixes are storable at room temperature until lay-down, non-polluting and show a lower tendency for cracking, due to their flexibility when the subgrade is not of great quality. Thus, cold mixes are especially suitable for low/medium traffic local roads, which are normally placed far away from the manufacturing plants. Cold asphalt mixtures are currently regaining their importance within the asphalt world market, reaching annual production levels of 1.5 million tonnes in France or 2 million tonnes in Turkey in recent years [7]. Nevertheless, researchers and producers continue to improve these mixtures in an attempt to increase their competitiveness. As such, and to improve the ecological and economic properties of CAM, CAM containing 100% recycled aggregates from construction and demolition waste (CDW) were studied. An extensive, growing and successful body of research on hot asphalt mixes with recycled aggregates from waste materials [8-16] reinforces this new approach in pavement engineering. This research was focused on the mechanical properties of CAMcontaining 100% construction and demolition waste aggregates (CDWA) once they have already reached a high curing degree. The results obtained were satisfactory not only compared with a control mix containing 100% natural aggregates (NA) but also with values given by different standards and recommendations. An ANOVA statistical analysis was performed to test and support the experimental results. Because the interaction between water and bitumen is unclear, one 2-way ANOVA and two 1-. 2.
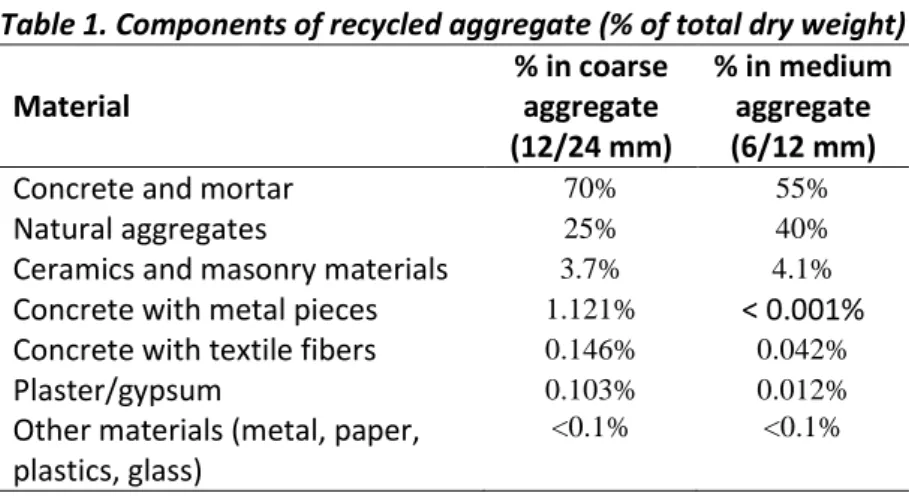
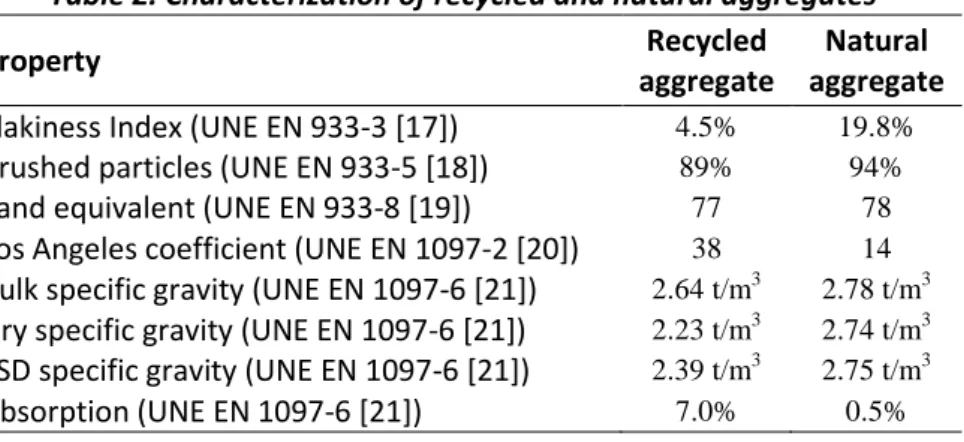
(4) way ANOVA (one for each fixed variable water/bitumen) were performed for each studied property. As explained, both analyses served to confirm the results because the conclusions drawn from both follow the same direction and did not contradict in any of the cases.. 2. Materials Used Two different aggregates were used: a hornfels, a metamorphic siliceous aggregate from a natural quarry used to produce the control mixes (hereafter, natural aggregate or NA) and a 100% recycled aggregate from construction and demolition waste (hereafter CDWA), whose composition is given in Table 1 for the received coarse and medium fractions. This composition was used to analyse the potential behaviour of this material in CAM. Most of this aggregate was concrete and natural stone but also contained other materials (Figure 1) that required the use of an X-Ray diffractogram to truly define their source in some cases. In this way, materials such as asphalt materials, plaster, aerated concrete or limestone with quartzite particles were identified. The different properties of both natural and recycled aggregates are shown in Table 2. CDWA materials are weaker because they have a lower Los Angeles coefficient, Flakiness Index and Crushed Particles after the crushing process. However, the most characteristic feature is the low specific gravity and the extensive water absorption, which clearly affect the mechanical and rheological properties of the bituminous mixtures they comprise. Table 1. Components of recycled aggregate (% of total dry weight) % in coarse % in medium Material aggregate aggregate (12/24 mm) (6/12 mm) 70% 55% Concrete and mortar 25% 40% Natural aggregates 3.7% 4.1% Ceramics and masonry materials 1.121% Concrete with metal pieces < 0.001% 0.146% 0.042% Concrete with textile fibers 0.103% 0.012% Plaster/gypsum <0.1% <0.1% Other materials (metal, paper, plastics, glass). 3.
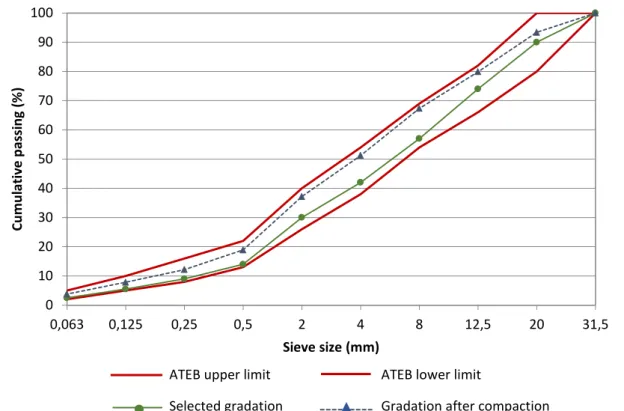
(5) Concrete with metal pieces. Gypsum/Plaster. Ceramics. Metal Concrete with textil fiber Plastic Light materials. Figure 1. Some of the materials found in the recycled aggregate Table 2. Characterization of recycled and natural aggregates Recycled Natural Property aggregate aggregate 4.5% 19.8% Flakiness Index (UNE EN 933-3 [17]) 89% 94% Crushed particles (UNE EN 933-5 [18]) 77 78 Sand equivalent (UNE EN 933-8 [19]) 38 14 Los Angeles coefficient (UNE EN 1097-2 [20]) 3 2.64 t/m 2.78 t/m3 Bulk specific gravity (UNE EN 1097-6 [21]) 3 2.23 t/m 2.74 t/m3 Dry specific gravity (UNE EN 1097-6 [21]) 3 2.39 t/m 2.75 t/m3 SSD specific gravity (UNE EN 1097-6 [21]) 7.0% 0.5% Absorption (UNE EN 1097-6 [21]) The binder used was a cationic bitumen emulsion (60% bitumen content) with 100 pen. grade base bitumen. The other relevant properties are shown in Table 3. The aggregate gradations of all the design mixtures used in this investigation were based on the technical recommendations given by the Spanish Technical Association of Bituminous Emulsions [22] for grave-emulsions. The initial gradation, which corresponds to a grave-emulsion GE1,. 4.
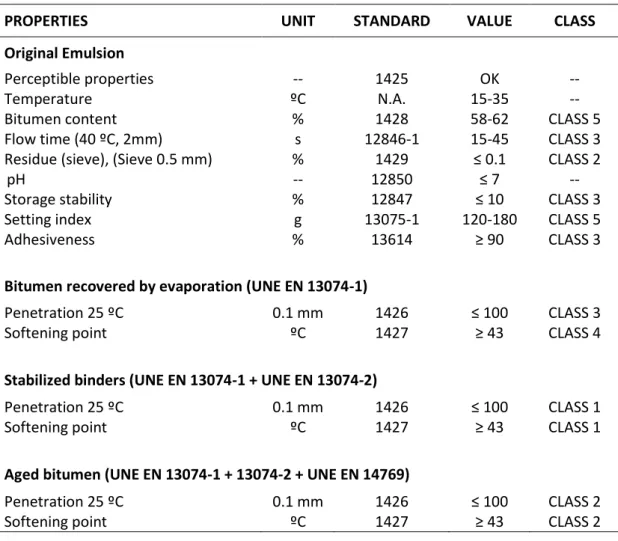
(6) required modification to be maintained within the upper and lower limits after compaction because the recycled aggregate tended to break, as shown in Figure 2. Table 3. Properties of the asphalt emulsion used during the present investigation PROPERTIES. UNIT. STANDARD. VALUE. CLASS. -ºC % s % -% g %. 1425 N.A. 1428 12846-1 1429 12850 12847 13075-1 13614. OK 15-35 58-62 15-45 ≤ 0.1 ≤7 ≤ 10 120-180 ≥ 90. --CLASS 5 CLASS 3 CLASS 2 -CLASS 3 CLASS 5 CLASS 3. ≤ 100 ≥ 43. CLASS 3 CLASS 4. ≤ 100 ≥ 43. CLASS 1 CLASS 1. ≤ 100 ≥ 43. CLASS 2 CLASS 2. Original Emulsion Perceptible properties Temperature Bitumen content Flow time (40 ºC, 2mm) Residue (sieve), (Sieve 0.5 mm) pH Storage stability Setting index Adhesiveness. Bitumen recovered by evaporation (UNE EN 13074-1) Penetration 25 ºC Softening point. 0.1 mm ºC. 1426 1427. Stabilized binders (UNE EN 13074-1 + UNE EN 13074-2) Penetration 25 ºC Softening point. 0.1 mm ºC. 1426 1427. Aged bitumen (UNE EN 13074-1 + 13074-2 + UNE EN 14769) Penetration 25 ºC Softening point. 0.1 mm ºC. 1426 1427. 3. Laboratory Testing Program 3.1 Mixture production and mechanical properties tested Many emulsified mix-design methods are currently being used, such as Modified Hveem Method for emulsified asphalt-aggregate cold mixture design or the Marshall Method for emulsified asphalt-aggregate cold mixture design, as well as different empirical formulas [23]. In some countries (i.e., Spain), first obtaining an optimal total water content from the Modified Proctor test (UNE 103-501-94) [24] and then testing the mixes with different bitumen/emulsion contents is common; here, the total water content is the sum of the water from the bitumen. 5.
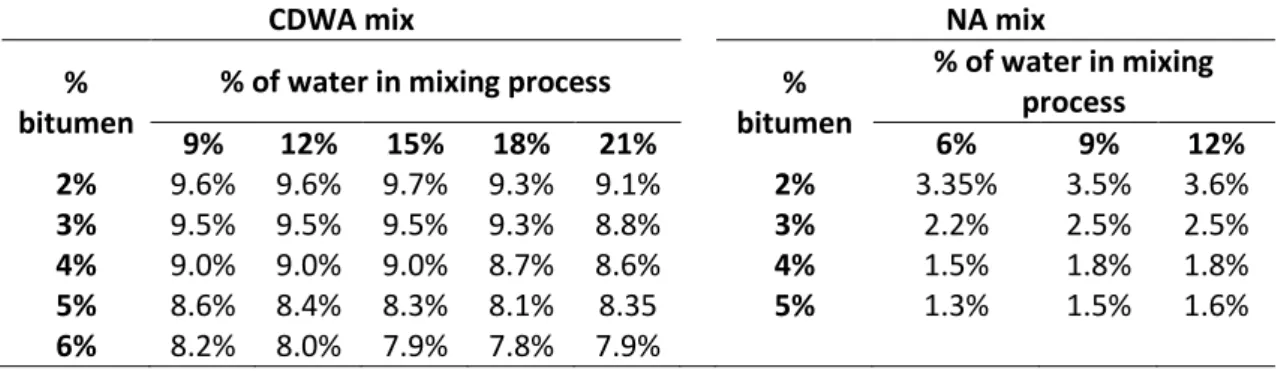
(7) emulsion plus the added water. Nevertheless, all tests were carried out with a wide combination of both contents to exactly determine the optimal bitumen and water contents. As such, the variations of a certain property due to either the water or bitumen content are clarified and easily understood, and the optimal values were real and not simple approximations.. 100 90 Cumulative passing (%). 80 70 60 50 40 30 20 10 0 0,063. 0,125. 0,25. 0,5. 2. 4. 8. 12,5. 20. 31,5. Sieve size (mm) ATEB upper limit. ●. Selected gradation. ATEB lower limit. ▲. Gradation after compaction. Figure 2. Aggregate gradation of CDWA before and after compaction compared with ATEB recommendations The water content discussed hereafter refers to the total water in the mixing process, which consists of water from the asphalt emulsion plus the added water. After compaction, the amount of water remaining inside the specimens was found to be lower and depending on the bitumen content as well as the type of aggregate (Table 4). The NA facilitates the water outlet, while the CDWA tends to retain it due to its high absorption. Similarly, larger amounts of bitumen waterproof the aggregate, and the water losses tend to increase again. The precise amount of water in the mixing process remarkably minimally influences this remaining water. However, the added water influenced the mechanical properties, as discussed below. Thus, it was necessary to test different water amounts.. 6.
(8) Table 4. Water contents (% of dry aggregate weight) remaining in the specimens after compaction process CDWA mix NA mix % of water in mixing % of water in mixing process % % process bitumen bitumen 9% 12% 15% 18% 21% 6% 9% 12% 2% 9.6% 9.6% 9.7% 9.3% 9.1% 2% 3.35% 3.5% 3.6% 3% 9.5% 9.5% 9.5% 9.3% 8.8% 3% 2.2% 2.5% 2.5% 4% 9.0% 9.0% 9.0% 8.7% 8.6% 4% 1.5% 1.8% 1.8% 5% 8.6% 8.4% 8.3% 8.1% 8.35 5% 1.3% 1.5% 1.6% 6% 8.2% 8.0% 7.9% 7.8% 7.9%. All specimens of the current study consisted of 100% CDWA or 100% NA. A CDWA content of 100% is higher than the top contents published by other authors for hot asphalt mixtures [25]. However, in cold asphalt mixtures, this material potentiated the mixes even when the aggregate content consisted entirely of CDWA. In summary, the mixing process was carried out as follows: 1550 g of CDWA or 1875 g of NA (this adjustment was necessary due to the different specific gravities) were dry mixed with the required pre-wetting water for 30 sec (to produce a homogeneous mixture and avoid the loss of fine particles during mechanical mixing). The bitumen emulsion and remaining water were then added and mixed for 90 sec (the necessary time to obtain a satisfactory coating). A static axial compaction effort of 21 MPa was subsequently applied for 2 min, and the resultant material was cured for 3 days 60ºC, as specified in the Spanish Standard NLT-162 [26] and ATEB recommendations. This method was used to produce 101.6 mm diameter x 101.6 mm height cylindrical specimens. These samples were suitable for the unconfined compression test but not for the indirect tensile test or stiffness test. To produce specimens with the same intrinsic properties (specific gravity, voids content, moisture content, etc.) irrespective of the test and thus correlate all results in the most reliable way possible, the authors developed a novel method by which two 101.6 mm diameter x 50 mm height were obtained from the split of the same 101.6 mm height “mother specimen”.. 7.
(9) The height of the specimen tended to slightly increase by increasing the bitumen content. This effect was not observed for the water content. As such, specimens containing 100% or CDWA showed heights ranging from -2 mm to +2 mm from the target height for bitumen contents of 3% to 8%. Conversely, specimens that consisted of 100% NA showed variations near 1 mm for bitumen contents of 2% to 5%. These variations were not observed with respect to the diametrical dimensions, even though this dimension was found to be closer to 101.8 mm than to the target 101.6 mm. The bitumen or water content did not affect the standard deviation. Thus, an almost random range of values was obtained from values close to 0 to those greater than 1; the standard deviation in the height was close to 0.85, and the standard deviation in the diameter was close to 0.07. A volumetric analysis was carried out to determine the void content present in the studied asphalt mixes. The parameters studied were VMA (voids in mineral aggregate, which includes all voids filled with air, bitumen and water), Vaw (voids filled with air and water) and Va (air voids, just filled with air), as well as the bulk specific gravity, which was obtained by using the following expressions proposed by the Asphalt Institute [23]: G=D/(F-E). (1). VMA (%)=[((100+A+K)/G-100/C)÷((100+A+K)/G)]×100. (2). Vaw (%)=[((100+A+K)/G-100/C-A/B)÷((100+A+K)/G)]×100. (3). Va (%)=V-[((K×100)/L)÷((100+A+K)/G)]. (4). where G is the bulk specific gravity; D is the mass of specimen in air (g); E is the mass of specimen in water (g); F is the mass of specimen in saturated surface-dry (SSD) condition (g); A is the asphalt residue as percent of dry aggregate mass; B is the specific gravity of asphalt; L is the specific gravity of water and K is the water content at testing (%), which can be calculated as follows:. 8.
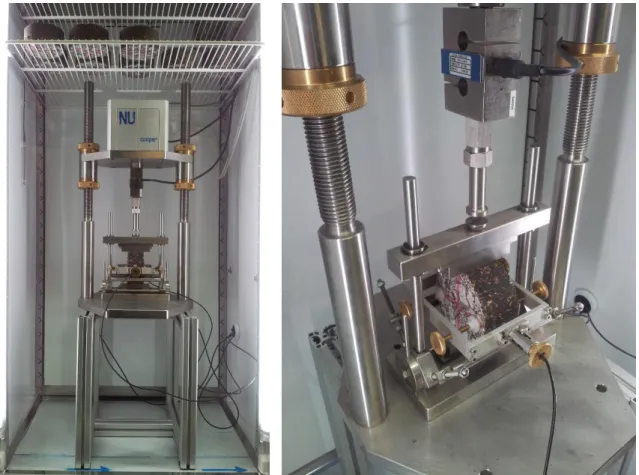
(10) K (%)=(mass of water (g))/(mass of dry mixture (g))×(100+A). (5). A static press was used for the static tests to analyse the following mechanical properties: - Unconfined Axial compression test (Spanish NLT-161 [26]) - Moisture susceptibility: Immersion-Compression test (Spanish NLT-162 [26]) - Indirect Tensile Strength (ITS) at 20ºC (UNE EN 12697-23 [27]) Furthermore, a Cooper NU 14 (Figure 3) dynamic testing machine was used to evaluate the stiffness by means of ITSM at 2ºC, 10ºC and 20ºC (UNE-EN 12697-26 [28]).. Figure 3. ITSM dynamic tests according to Standard UNE-EN 12697-26. 3.2 Immersion-Compression This test was performed according to the Spanish NLT-162 standard [26] (a test method for assessing the effect of water on the Unconfined Compression Strength (UCS) of compacted. 9.
(11) bituminous mixtures). Ten 101.6 mm diameter x 101.6 mm height cylindrical specimens were produced. Five specimens were immersed in water at a temperature of 49ºC for 96 h, and the other five were maintained at room temperature without being submerged in water. They were later subjected to unconfined compression (Axial Compression test, NLT-161 [26]), and the average value of the strength in each group was determined. The retained strength ratio (RSR) was calculated as follows: RSR=UCSwet/UCSdry. (6). where UCSwet is the unconfined compression strength of the group immersed in water at 49ºC (MPa) and UCSdry the unconfined compression strength of the group that was not submerged. According to Spanish legislation (PG-3) [29], this index must be higher than 50% in grave-emulsions and higher than 60% according to ATEB. Furthermore, ATEB defines the lowest UCS at 1.2 MPa for the non-immersed group and 1.0 MPa for the immersed group for medium and low traffic roads.. 3.3 Indirect Tensile Strength The indirect tensile strength (ITS) was tested according to the Standard UNE-EN 12697-23 [27] at room temperature of 25ºC to evaluate the stress cracking resistance. Five cylindrical specimens per bitumen/water content were subjected to diametral compression with a constant deformation rate of (50±2) mm/min until fracture occurred. The ITS was obtained for each specimen with the following equation: ITS=(2·P)/(π·D·H). (7). where P is the peak vertical load (kN), D is the diameter (mm) and H is the height of the cylindrical specimens (mm). Finally, the ITS was considered to be the average value of five tested specimens.. 10.
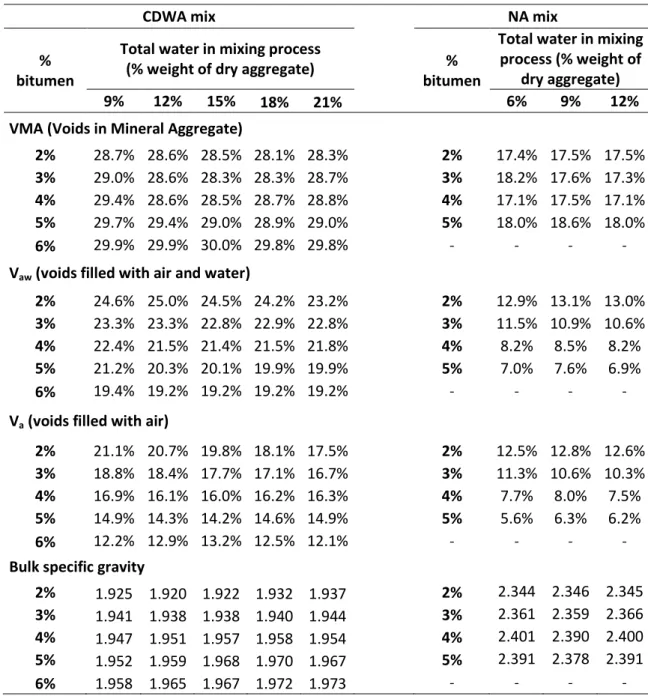
(12) 3.4 Stiffness Modulus The stiffness of bituminous mixes can be considered a synthetic indicator of the structural properties of the mixtures because it is related to the capacity of the material to distribute traffic loads. The test was carried out following the Standard EN 12697-26, Annex C. The test is characterised by 5 semi-sinusoid impulses with a total duration of 3 s that consists of a rise time of 124 ms and a visco-elastic deformation recovery, conducted in a regime of deformation control (5 µm). To evaluate the thermal sensitivity of the mixtures, indirect tensile stiffness modulus (ITSM) tests were conducted at three different temperatures: 2ºC, 10ºC and 20ºC. A temperature of 2ºC instead of 0ºC was selected to avoid the possible freezing of internal mixing water. Five specimens per bitumen/water content were tested under an assumed Poisson ratio condition of 0.35, which represents the final value the average value of these specimens. For each pulse, the modulus was calculated as follows: Sm=F(ν+0.27)/(z·h). (8). where Sm is the stiffness modulus (MPa), F represents the peak value of the applied vertical load (N), z is the amplitude of the horizontal deformation obtained during the load cycle (mm), h is the mean height of the cylindrical specimen (mm) and ν is Poisson’s ratio.. 4. Test Results 4.1 Volumetric properties The parameters VMA, Vaw, Va and the bulk specific gravity are shown in Table 5 for both NA and CDWA asphalt mixes. As expected, the obtained values for VMA, V aw, and Va are much higher in the CDWA than in the NA mixtures due to the high porosity of CDWA. Overall, the VMA tended to slightly increase by increasing the bitumen content and be almost independent of the water content. However, Vaw and Va tended to markedly decrease by increasing bitumen content and slightly decrease by increasing water content. Nevertheless, the void content of the CDWA mixes never dropped below 10% and was sometimes higher than. 11.
(13) 20%, which is a typical value in granular materials or open-graded asphalt mixes. Moreover, mixes prepared with CDWA showed a lower bulk specific gravity (around a 18% lower) due to the lightness of CDWA. The specific gravity of the NA mixes was maximised at 4% bitumen content, while the specific gravity of the CDWA materials continued to increase due to the persistent high void content that was neither filled with bitumen nor with water and could continually be filled. As explained below, this feature not only strongly affects the properties of CDWA but also results in the inaccuracy of classical design methods for this case.. Table 5. Voids contents and density of CDWA and NA mixtures made with different bitumen and water contents CDWA mix NA mix Total water in mixing Total water in mixing process process (% weight of % % (% weight of dry aggregate) dry aggregate) bitumen bitumen 9% 12% 15% 18% 21% 6% 9% 12% VMA (Voids in Mineral Aggregate) 2% 3% 4% 5% 6%. 28.7% 29.0% 29.4% 29.7% 29.9%. 28.6% 28.6% 28.6% 29.4% 29.9%. 28.5% 28.3% 28.5% 29.0% 30.0%. 28.1% 28.3% 28.7% 28.9% 29.8%. 28.3% 28.7% 28.8% 29.0% 29.8%. 2% 3% 4% 5%. 17.4% 18.2% 17.1% 18.0%. 17.5% 17.6% 17.5% 18.6%. 17.5% 17.3% 17.1% 18.0%. -. -. -. -. 24.5% 22.8% 21.4% 20.1% 19.2%. 24.2% 22.9% 21.5% 19.9% 19.2%. 23.2% 22.8% 21.8% 19.9% 19.2%. 2% 3% 4% 5%. 20.7% 18.4% 16.1% 14.3% 12.9%. 19.8% 17.7% 16.0% 14.2% 13.2%. 18.1% 17.1% 16.2% 14.6% 12.5%. 17.5% 16.7% 16.3% 14.9% 12.1%. 2% 3% 4% 5% -. -. -. -. 1.920 1.938 1.951 1.959 1.965. 1.922 1.938 1.957 1.968 1.967. 1.932 1.940 1.958 1.970 1.972. 1.937 1.944 1.954 1.967 1.973. 2% 3% 4% 5%. 2.344 2.361 2.401 2.391. 2.346 2.359 2.390 2.378. 2.345 2.366 2.400 2.391. -. -. -. -. Vaw (voids filled with air and water) 2% 3% 4% 5% 6%. 24.6% 23.3% 22.4% 21.2% 19.4%. 25.0% 23.3% 21.5% 20.3% 19.2%. -. 12.9% 13.1% 13.0% 11.5% 10.9% 10.6% 8.2% 8.5% 8.2% 7.0% 7.6% 6.9% -. -. -. Va (voids filled with air) 2% 3% 4% 5% 6%. 21.1% 18.8% 16.9% 14.9% 12.2%. 12.5% 12.8% 12.6% 11.3% 10.6% 10.3% 7.7% 8.0% 7.5% 5.6% 6.3% 6.2%. Bulk specific gravity 2% 3% 4% 5% 6%. 1.925 1.941 1.947 1.952 1.958. 12.
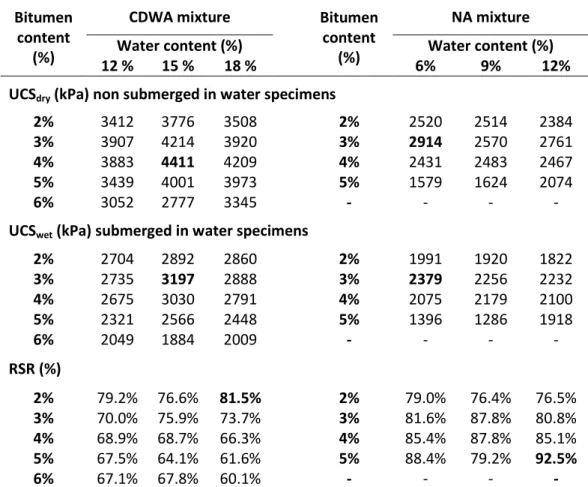
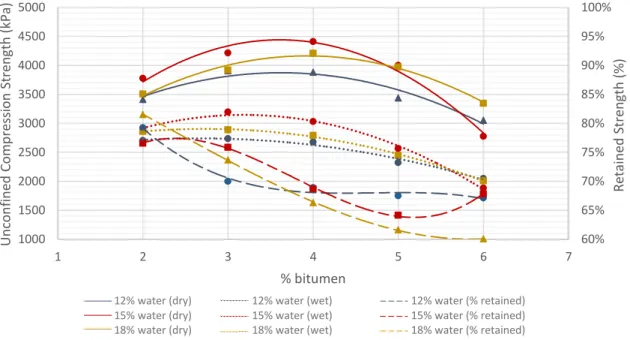
(14) 4.2 Immersion-compression The results of the retained strength index can be found in Table 6. The strongest CDWA mixture showed an SI of 81.5%, while the strongest NA mixture had an SI of 92.5%. These values are much higher than the specification threshold of 60%. Although the mixtures that consist of CDWA seemed to be weaker than the NA mixtures, we must consider that both dry and wet UCS were noticeably higher for mixes with CDWA in general. In fact, the peak values shifted from 2914 kPa and 2379 kPa (with NA) to 4411 kPa and 3197 kPa (with CDWA), which constitute increases of 51.4% and 34.4%, respectively. Table 6. Unconfined Compression Strength (dry and wet) and retained strength ratio of specimens with 100% of recycled aggregate and 100% of natural aggregate Bitumen content (%). CDWA mixture Water content (%) 12 % 15 % 18 %. Bitumen content (%). NA mixture Water content (%) 6% 9% 12%. UCSdry (kPa) non submerged in water specimens 2% 3% 4% 5% 6%. 3412 3907 3883 3439 3052. 3776 4214 4411 4001 2777. 3508 3920 4209 3973 3345. 2% 3% 4% 5% -. 2520 2914 2431 1579 -. 2514 2570 2483 1624 -. 2384 2761 2467 2074 -. UCSwet (kPa) submerged in water specimens 2% 3% 4% 5% 6%. 2704 2735 2675 2321 2049. 2892 3197 3030 2566 1884. 2860 2888 2791 2448 2009. 2% 3% 4% 5% -. 1991 2379 2075 1396 -. 1920 2256 2179 1286 -. 1822 2232 2100 1918 -. 79.2% 70.0% 68.9% 67.5% 67.1%. 76.6% 75.9% 68.7% 64.1% 67.8%. 81.5% 73.7% 66.3% 61.6% 60.1%. 2% 3% 4% 5% -. 79.0% 81.6% 85.4% 88.4% -. 76.4% 87.8% 87.8% 79.2% -. 76.5% 80.8% 85.1% 92.5% -. RSR (%) 2% 3% 4% 5% 6%. Thus, mixes with NA have a higher retained strength, not because they are better, but because the improvements obtained by changing NA to CDWA are more marked in the dry strength than the wet strength. In fact, the wet strength for CDWA is even higher than the dry. 13.
(15) strength of NA. Hence, the mixtures containing 100% CDWA were less likely to be damaged by moisture with respect to the UCS value than mixtures containing 100% NA. Furthermore, the results show that the optimal bitumen content is almost the same for both mixtures (3% for NA and between 3% and 4% for CDWA). However, the optimal amount of total water in the mix is much higher for mixes containing CDWA (15% against 6%), which is to be expected due to the large absorption capacity of this aggregate. Finally, Figures 4 and 5 show that the curves for CDWA are more pronounced than for NA. This effect could indicate that small deviations from the optimal binder and water content significantly affect the CDWA. Therefore, the mix and the production must be carefully and accurately designed. A two-way analysis of variance (ANOVA) was conducted to determine the effect of the water (12%, 15% and 18%) and bitumen (2%, 3%, 4%, 5% and 6%) content on the UCS for CAM with CDWA. The results showed that statistically speaking, only the bitumen content is significant at the 99% confidence level both for the UCSdry (pbitumen=0.002<0.01) and UCSwet (pbitumen<0.001). The p-values obtained for the water content were not significant even for a 95% confidence level (pwater=0.126>0.05 and pwater=0.069>0.05). Similar results were observed for the NA. The content of bitumen (2%, 3%, 4% and 5%) and water (6%, 9% and 12%) was studied, but only the bitumen content was statistically significant for UCSdry (pbitumen<0.001) and UCSwet (pbitumen<0.001). The p-values obtained for the water content were not significant even at a 95% confidence level (pwater=0.094>0.05 and pwater=0.389>0.05). Thus, while the optimal bitumen contents are clear (3% for NA and between 3% and 4% for CDWA), the obtained optimal water contents must be approximated.. 14.
(16) 100%. 4500. 95%. 4000. 90%. 3500. 85%. 3000. 80%. 2500. 75%. 2000. 70%. 1500. 65%. 1000. Retained Strength (%). Unconfined Compression Strength (kPa). 5000. 60% 1. 2. 3. 4. 5. 6. 7. % bitumen 12% water (dry) 15% water (dry) 18% water (dry). 12% water (wet) 15% water (wet) 18% water (wet). 12% water (% retained) 15% water (% retained) 18% water (% retained). 5000. 100%. 4500. 95%. 4000. 90%. 3500. 85%. 3000. 80%. 2500. 75%. 2000. 70%. 1500. 65%. 1000. Retained Strength (%). Unconfined Compression Strength (kPa). Figure 4. UCSdry (kPa), UCSwet (kPa) and retained strength (%) of dry and wet specimens of cold asphalt mixtures with different water and bitumen contents and a 100% of recycled aggregate. 60% 1%. 2%. 3%. 4%. 5%. 6%. % de betún 6% water (dry) 9% water (dry) 12% water (dry). 6% water (wet) 9% water (wet) 12% water (wet). 6% water (% retained) 9% water (% retained) 12% water (% retained). Figure 5. UCSdry (kPa), UCSwet (kPa) and retained strength (%) of dry and wet specimens of cold asphalt mixtures with different water and bitumen contents and a 100% of natural aggregate. 15.
(17) 4.3 Indirect Tensile Strength First, the results show that the ITS values more strongly depend on the bitumen content than the water content (Figure 6 and Table 7). Therefore, the curves in Figure 6 tend to be parallel lines from left to right. Thus, the water content of the mixture does not significantly influence the ITS value, but it does influence the bitumen content. In fact, large amounts of water (up to 36%) needed to be tested to obtain a clear ITS peak value, unlike with mixes containing NA. As mentioned above, the amount of water that remained within the specimens after the compaction process does not vary significantly depending on the amount of water added to the mix. Thus, this behaviour is explained by the higher water absorption of CDWA, which forces the premature setting of the emulsion and produces clots and a deficient coating of aggregates during the mixing and compaction processes. Thus, large amounts of water are necessary to maintain the emulsion in a liquid state until the curing process, although most of this water is lost during the compaction process.. Peak value for 6% bitumen and 27% water. ITS (kPa) 1000 950 900 850 800 750 700 650 600 550. ITS (kPa) 950-1000 900-950 850-900. 6% 5% 4% 3% 36%. 33%. 30%. 27%. 24%. % water. 8% 7% 21%. 18%. 9% 12% 15%. 800-850. % bitumen. 750-800 700-750 650-700 600-650 550-600. Figure 6. Indirect Tensile Strength (kPa) of cold asphalt mixes with 100% of recycled aggregate and different contents of bitumen and water. 16.
(18) Table 7. Indirect Tensile Strength (kPa) of cold asphalt mixes with 100% of recycled aggregate and different contents of bitumen and water % water (by dry aggregate weight) % bitumen 3% 4% 5% 6% 7% 8%. 9% 12%. 15%. 18%. 21%. 24%. 27%. 30%. 33%. 36%. 602 738 847 862 843 821. 646 752 904 892 829 795. 635 723 914 920 825 747. 652 748 940 944 860 745. 671 751 903 952 901 767. 652 748 880 960 920 777. 619 670 835 925 935 753. 587 648 785 885 890 745. 606 655 784 868 858 713. 634 740 862 881 841 824. Compared to NA (Figure 7 and Table 8), CDWA mixtures require considerably more water because NA mixtures do not set the emulsions. Therefore, the water acts as a harmful element, and the peak ITS values are achieved at the lowest studied water percentage. A lower amount would not be possible because a 3% water content is approximately equal to the water provided by the emulsion. Conversely, the bitumen content of 100% CDWA and NA mixtures was optimised at 6 and 4%, respectively. This extra amount of bitumen is consistent with the publications of other authors that studied different types of CDWA in hot mixes.. Peak value for 4% bitumen and 3% water. ITS (kPa) 0,900 0,850 0,800 0,750 0,700 0,650 0,600 0,550 0,500 0,450 3%. ITS (kPa) 0,850-0,900 0,800-0,850 0,750-0,800 0,700-0,750 0,650-0,700. 6% 9%. % water. 5% 12%. 4% 3%. 15% 2%. % bitumen. 0,600-0,650 0,550-0,600 0,500-0,550 0,450-0,500. Figure 7. Indirect Tensile Strength (kPa) of cold asphalt mixes with 100% of natural aggregate and different contents of bitumen and water. 17.
(19) Table 8. Indirect Tensile Strength (kPa) of cold asphalt mixes with 100% of natural aggregate and different contents of bitumen and water % water (by dry aggregate weight) % bitumen 3% 6% 9% 12% 15% 2% 3% 4% 5%. 543 798 851 690. 475 729 792 485. 525 724 791 567. 478 743 755 513. 482 719 739 635. Finally, the peak ITS value for mixes containing CDWA is 12.8% higher than for those containing NA. Thus, CDWA is again beneficial for asphalt cold mixes. A two-way ANOVA was again conducted to determine the effect of the water (9%, 12%, 15%, 18%, 21%, 24%, 27%, 30%, 33%, 36%) and bitumen (3%, 4%, 5%, 6%, 7%, 8%) content on the ITS. The results confirm the above explanation and indicate that both the water and bitumen contents are statistically significant at the 99% confidence level (pwater=0.002<0.01 and pbitumen<0.001). For NA, the ANOVA showed that the studied percentages of water (3%, 6%, 9%, 12% and 15%) and bitumen (2%, 3%, 4% and 5%) are significant at the 99% confidence level (pwater<0.001 and pbitumen<0.001).. 4.4 Stiffness modulus The resilient modulus test results are shown in Figure 8 and Table 9 for CDWA mixes and in Figure 9 and Table 10 for NA mixes. Like the ITS results, the ITSM results more strongly depend on the bitumen content than the water content, and the curves tended to be lines that are parallel to the axis of water content. The ITSM is higher in mixes containing CDWA, but at 20ºC, it is higher in mixes containing NA, which indicates that the mechanical behaviour of mixes containing CDWA is less susceptible to changes in temperature. For example, heating NA from 2ºC to 20ºC results in a loss of stiffness near 80% in many cases, which does not occur for CDWA (the loss is near 50%). Thus, mixes containing CDWA are less susceptible to temperature changes and therefore less prone to cracking at lower temperatures and rutting at high temperatures.. 18.
(20) Table 9. Resilient Modulus (MPa) of cold asphalt mixes with 100% of CDWA and different contents of bitumen and water at 2ºC. 10ºC and 20ºC % water % bitumen 9% 12% 15% 18% 21% 24% 27% 30% 33% 36% ITSM at T=2ºC 3% 4% 5% 6% 7% 8%. 3256 4990 6486 7512 7532 7251. 4567 6010 7586 7461 7325 7140. 4551 6493 7606 7374 7140 6723. 4114 5900 7738 7731 7023 6359. 4944 6228 7740 7859 6851 6082. 6009 6592 7485 7959 7412 6234. 5993 6493 7058 8010 8019 7385. 5911 6433 6976 7560 8407 7480. 5839 6352 6822 7531 7611 7105. 5820 6434 6957 7545 7518 6689. 5064 5102 5530 6010 5492 4717. 4808 5094 5392 5941 6044 5015. 4679 5063 5402 5693 5741 4913. 4552 4989 5410 5607 5599 4720. 3596 3667 3766 4006 3421 2565. 3566 3657 3640 3799 3812 2707. 3558 3601 3618 3586 3490 2724. 3570 3583 3553 3451 3213 2526. ITSM at T=10ºC 3% 4% 5% 6% 7% 8%. 3132 3805 4610 4254 5778 5632. 4022 4654 5670 5813 5468 5254. 4201 4912 5889 5448 5153 4790. 3496 4659 5890 5950 5199 4506. 3887 4895 5831 6007 5105 4220. 4811 5284 5880 5980 5170 4400. ITSM at T=20ºC 3% 4% 5% 6% 7% 8%. 2379 2741 3024 3515 3403 3288. 2622 3013 3723 3642 3321 2837. 2490 3318 4024 3418 2844 2668. 2710 3182 3854 3866 2987 2394. 3043 3380 3912 3896 3079 2311. 3312 3595 4001 3786 2983 2269. The results are comparable and even higher than the ones published by different authors about CAM containing NA, even with additions (i.e., cement) or a much longer curing time [4, 5, 30, 31]. Conversely, the resilient modulus did not reach the 5000 MPa at 20ºC, a value more typical of hot asphalt mixes. Thus, the obtained mixes retain a certain stiffness that is very useful in low and medium traffic roads, where the subgrades are usually not of good quality. Finally, the optimal water/bitumen contents (understood as the contents that result in the highest resilient modulus) depend on the test temperature. For CDWA, the optimal contents range from 7% bitumen and 30% water at 2ºC to 5% bitumen and 15% water at 20ºC. The latter bitumen/water contents could be defined as better because they result in the highest stiffness at high temperatures (favourable to prevent permanent deformations), but not the highest stiffness at low temperatures (favourable to avoid fatigue cracking). Conversely, the NA materials. 19.
(21) showed a peak value at 20ºC for 4% bitumen and 3% water (the minimum allowed by the inherent water of the emulsion). Thus, the water is noxious to mixes with NA but necessary for mixes with CDWA. Again, a three-way ANOVA was carried out to statistically evaluate the results of ITSM. For CDWA, both the water (9%, 12%, 15%, 18%, 21%, 24%, 27%, 30%, 33%, 36%) and bitumen content (3%, 4%, 5%, 6%, 7%, 8%) as well as the temperature (2ºC, 10ºC and 20ºC) showed statistically significant effects at a 99% confidence level (pwater=0.001, pbitumen<0.001 and pbitumen<0.001). For the NA, all contents also resulted in significant effects (pwater<0.001 and pbitumen<0.001 and pbitumen<0.001).. Table 10. Resilient Modulus (MPa) of cold asphalt mixes with 100% of NA and different contents of bitumen and water at 2ºC. 10ºC and 20ºC % water % bitumen 3% 6% 9% 12% 15% ITSM at T=2ºC 2% 3% 4% 5%. 6892 9821 11096 8303. 5980 10431 10184 6189. 5938 9375 9521 5777. 6528 9560 8810 6905. 6471 9852 10004 8939. 3784 5684 4918 3751. 3944 5602 5699 5059. 1469 2308 1795 1310. 1691 2374 2184 1850. ITSM at T=10ºC 2% 3% 4% 5%. 4203 5457 6230 4404. 3608 5882 5678 3167. 3478 5529 5495 2954. ITSM at T=20ºC 2% 3% 4% 5%. 1844 2351 2537 1459. 1619 2298 2197 963. 1387 2137 2137 931. 20.
(22) a) T=2ºC. Peak value for 7% bitumen and 30% water ITSM (MPa). ITSM (MPa) 9000 8500 8000 7500 7000 6500 6000 5500 5000 4500 4000 3500 3000 12% 15% 18% 21% 24% 27% % water 30%. 8500-9000 8000-8500 7500-8000 7000-7500 6500-7000 6000-6500 5500-6000 8% 7%. 4500-5000. 6%. 33%. 5% % bitumen 36%. 4%. 4000-4500 3500-4000 3000-3500. 3%. b) T=10ºC. Peak value for 7% bitumen and 30% water. ITSM (MPa). ITSM (MPa). 5850 5600 5350 5100 4850 4600 4350 4100 3850 3600 9% 12% 15% 18% 21% 24% % water 27% 30% 33%. 5850-6000 5600-5850 5350-5600 5100-5350 4850-5100 4600-4850 8%. 4350-4600. 6% 5% % bitumen. 4100-4350. 7% 36%. c) T=20ºC. 5000-5500. 4%. 3850-4100 3600-3850. 3%. Peak value for 5% bitumen and 15% water. ITSM (MPa) 4000 3800 3600 3400 3200 3000 2800 2600 2400 2200 2000 9% 12% 15% 18% 21% 24% % water 27% 30%. ITSM (MPa) 3800-4000 3600-3800 3400-3600 3200-3400 3000-3200 2800-3000 8% 7% 6%. 33% 36%. 4% 3%. 5% % bitumen. 2600-2800 2400-2600 2200-2400 2000-2200. Figure 8. Resilient Modulus (MPa) of cold asphalt mixes with 100% of CDWA and different contents of bitumen and water at a) 2ºC, b) 10ºC and c) 20ºC. 21.
(23) a) T=2ºC Peak value for 4% bitumen and 3% water ITSM (MPa) 11000 10500 10000 9500 9000 8500 8000 7500 7000 6500 6000 5500 5000 3%. ITSM (MPa) 11000-11200 10500-11000 10000-10500 9500-10000 9000-9500 8500-9000 8000-8500. 6%. 7500-8000 9%. % water. 2% 12% 4%. 6000-6500. % bitumen. 5500-6000. 15%. b) T=10ºC. 5000-5500. 5%. Peak value for 4% bitumen and 3% water. ITSM (MPa) 7000 6500 6000 5500 5000 4500 4000 3500 3000 2500 2000 1500 1000 3%. 7000-7500 6500-7000. 3%. ITSM (MPa) 6500-7000 6000-6500 5500-6000 5000-5500 4500-5000 4000-4500 3500-4000. 6% 9%. 2%. % water. 3%. 12% 4%. 2500-3000 2000-2500. % bitumen. 1500-2000. 15%. c) T=20ºC. 3000-3500. 1000-1500 5%. Peak value for 4% bitumen and 3% water. ITSM (MPa) 3000 2750 2500 2250 2000 1750 1500 1250 1000 750 500 250 0 3%. ITSM (MPa) 2750-3000 2500-2750 2250-2500 2000-2250 1750-2000 1500-1750 1250-1500. 6% 9% % water. 2% 3%. 12% 4% 15% 5%. % bitumen. 1000-1250 750-1000 500-750 250-500 0-250. Figure 9. Resilient Modulus (MPa) of cold asphalt mixes with 100% of NA and different contents of bitumen and water at a) 2ºC, b) 10ºC and c) 20ºC. 22.
(24) 5. Discussion When studied as an aggregate, CDWA exhibited poor properties that make these materials less favourable than NA in principle. For instance, they were weaker, more prone to breaking, had a higher Los Angeles coefficient and absorbed large amounts of water. Moreover, they result in the premature setting of bituminous emulsions to produce clots and an incomplete coating of aggregates. However, carefully and accurately designing the mixing process and production, which usually involved slightly greater amounts of bitumen and noticeably greater amounts of water, cold asphalt mixes containing 100% CDWA showed properties that were preferred to those of the NA. Both the wet and dry UCS were improved and met all of the considered standards and recommendations, such as the RSR, by substituting NA with CDWA. The peak values of UCSdry and UCSwet shifted from 2914 kPa and 2379 kPa in mixes with NA to 4411 kPa and 3197 kPa in mixes with 100% CDWA, which constitutes increases of 51.4% and 34.4%, respectively. Because the wet strength grew less than the dry strength, higher retained strength indices were obtained. However, this pattern does not indicate that mixes containing CDWA are more susceptible to moisture damage because the UCSwet of CDWA mixes continued to exceed the UCSdry of NA mixes. CDWA also favourably contributes to CAM with respect to the ITS (and therefore stress cracking resistance), reaching ITS values of 12.8% or higher. As expected, the ITSM negatively correlated with the temperature, but this effect was less pronounced in cold asphalt mixes that contained 100% CDWA. Hence, CDWA mixes retain a higher stiffness at higher temperatures (favourable for protecting against permanent deformations) and a lower stiffness at low temperatures (favourable for avoiding fatigue cracking). Furthermore, the ITSM values of CDWA mixes were found to fall between the values of NA cold mixes and hot asphalt mixes, which indicates that they should perform well in practice.. 23.
(25) The water and bitumen optimal content (meaning the optimum water content and the total amount of water present during the mixing process) depends on the type of aggregate and the tested property (Table 11). Conversely, the bitumen percentages that produced peak values tended to be slightly greater for CDWA (up to 3% difference). Nevertheless, the amounts of water that are required for CDWA are very large when compared with the ones needed for NA. However, the curves are more susceptible to bitumen than water variations. Hence, lower water contents could be used for a mix design without significant losses in the ITS or ITSM. Once all of these considerations have been taken into account, the authors propose a compromise mix design that consists of 15% water and 5% bitumen. In this situation, the UCSdry (4001 kPa), UCSwet (2566 kPa) and RSR (64.1%) remain above the specification limits of 1200 kPa, 1000 kPa and 60%, respectively. The ITS would fall from 960 kPa to 904 kPa (an acceptable reduction), and the ITSM at 2ºC and 10ºC would fall from 8407 MPa and 6044 MPa to 7606 MPa and 5889 MPa, respectively (which helps to prevent fatigue cracking at low temperatures). Nevertheless, the ITSM would be maximised at 20ºC (optimal ITSM value to avoid rutting at high temperatures). Table 11. Water and bitumen contents which produce the peak values of tested properties CDWA Aggregate Natural Aggregate Property % % % % water bitumen water bitumen UCSdry 15% 4% 6% 3% UCSwet 15% 3% 6% 3% ITS 27% 6% 3% 4% ITSM – 2ºC 30% 7% 3% 4% ITSM – 10ºC 30% 7% 3% 4% ITSM – 20ºC 15% 5% 3% 4%. Notably, other water and bitumen percentages could be used if the conditions of service so require. For example, the results indicate that lower water and bitumen contents would be desirable (12% and 3%) if the average rainfall in the area is high but the average temperature is near 20ºC because the UCSwet is optimal without losing much stiffness. This versatility makes cold asphalt mixes with recycled aggregates more suitable to a wider range of uses.. 24.
(26) 6. Conclusions The research project aimed to evaluate the potential of using CDWA as an aggregate for CAM for low traffic asphalt roads. Based on the laboratory experiments and analyses, the following conclusions can be summarised: 1. The traditional mix design methods for cold asphalt mixtures are not suitable when incorporating CDWA into the mix. A global study of different properties must be conducted to reach a compromise depending on the use of the cold asphalt mix. Moreover, the design and production requires precision and care. 2. Cold asphalt mixes containing CDWA are more versatile than NA mixes. These mixes can be suitable for a wide range of environmental features (e.g., temperature, rainfall) and service conditions (traffic loads) by simply varying the water and bitumen contents. 3. Mechanical properties, such as the UCS, ITS and ITSM, show important improvements shortly after production when the NA are replaced by CDWA. 4. Cold asphalt mixes containing CDWA perform better under conditions of abundant moisture and/or temperature variations. 5. In general terms, aggregate CDWA materials have poor properties, which make them worse than NA. However, CDWA can potentiate CAM to improve their performance. Therefore, CDWA has a great market potential when being transformed to a raw material for road engineering from waste. 6. The amount of water present within the specimens after the compaction process does not strongly depend on the total amount of water incorporated during the mixing process. However, the water is important to maintain the bitumen emulsion in a liquid state while mixing it with an extremely absorbent aggregate, such as CDWA. Hence, low amounts of water result in the premature setting of the emulsion, which can be noticed by examining at the results obtained for the mechanical properties.. 25.
(27) Acknowledgements The authors would like to acknowledge the funding of the project BIA2010-17751 and the scholarship FPI (ref. BES-2011-044377) from the Spanish Ministry of Economy and Competitiveness. Furthermore, the authors wish to express their sincere gratitude to the GESTAN Group for the CDWA and to ECOASFALT for the bitumen emulsion that were generously donated for the present research.. References [1] Thanaya INA, Zoorob SE, Forth JP. A laboratory study on cold-mix, cold lay emulsion mixtures. Proceedings of the Institution of Civil Engineers. February 2009; Transport 162:47-55. [2] Khalid HA, Monney OK. Moisture damage potential of cold asphalt. International Journal of Pavement Engineering. October 2008;10(5):311-318 [3] Serfass JP. Advantages peculiarities and mysteries of emulsion cold mixes. Revue General des Routes et Autoroutes 2002;802: 60-68 [4] Oruc S, Celik F, Akpinar MV. Effect of Cement on Emulsified Asphalt Mixtures. Journal of Materials Engineering and Performance. October 2007;16(5):578-583 [5] Thanaya INA. Evaluating and improving the performance of cold asphalt emulsion mixes. Civil Engineering Dimension. September 2007;9(2); 64-69 [6] Chávez-Valencia LE, Alonso E, Manzano A, Pérez J, Contreras ME, Signoret C. Improving the compressive strengths of cold-mix asphalt using asphalt emulsion modified by polyvinyl acetate. Construction and Building Materials 2007;21:583-589 [7] European Asphalt Pavement Association (EAPA). Asphalt in figures. EAPA; 2012 [8] Mills-Beale J, You Z. The mechanical properties of asphalt mixtures with Recycled Concrete Aggregates. Construction and Building Materials 2010;24:230-235 [9] Pérez I, Gallego J, Toledano M, Taibo J. Asphalt mixtures with construction and demolition debris. Proceedings of the Institution of Civil Engineers. Transport November 2010;163:165-174. 26.
(28) [10] Shen DH, Du JC. Application of gray relational analysis to evaluate HMA with reclaimed building materials. Journal of Materials in Civil Engineering. July/August 2005:400-406. [11] Paranavithana S, Mohajerani A. Effects of recycled concrete aggregates on properties of asphalt concrete. Resources Conservation & Recycling 2006;48:1-12 [12] Wong YD, Sun DD, Lai D. Value-added utilization of recycled concrete in hot-mix asphalt. Waste Management 2007;27:294-301 [13] Chen MZ, Lin JT, Wu SP. Potential of recycled fine aggregates powder as filler in asphalt mixture. Construction and Building Materials 2011;25:3909-3914 [14] Pasetto M, Baldo N. Mix design and performance analysis of asphalt concretes with electric arc furnace slag. Construction and Building Materials 2011;25:3458-3468 [15] Wu S, Zhu J, Zhong J, Wang D. Experimental investigation on related properties of asphalt mastic containing recycled red brick powder. Construction and Building Materials 2011;25:2883-2887 [16] Akbulut H, Gürer C. Use of aggregates produced from marble quarry waste in asphalt pavements. Building and Environment 2007;42:1921-1939 [17] AENOR. Asociación Española de Normalización y Certificación. UNE EN 933-3. Ensayos para determinar las propiedades geométricas de los áridos. Parte 3: Determinación de la forma de las partículas. Índice de lajas. Madrid, Spain; 2012 [18] AENOR. Asociación Española de Normalización y Certificación. UNE EN 933-5. Ensayos para determinar las propiedades geométricas de los áridos. Parte 5: Determinación del porcentaje de caras de fractura de las partículas de árido grueso. Madrid, Spain; 1999 [19] AENOR. Asociación Española de Normalización y Certificación. UNE EN 933-8. Ensayos para determinar las propiedades geométricas de los áridos. Parte 8: Evaluación de los finos. Ensayo del equivalente de arena. Madrid, Spain; 2000 [20] AENOR. Asociación Española de Normalización y Certificación. UNE EN 1097-2. Ensayos para determinar las propiedades mecánicas y físicas de los áridos. Parte 2: Métodos para la determinación de la resistencia a la fragmentación. Madrid, Spain; 2010. 27.
(29) [21] AENOR. Asociación Española de Normalización y Certificación. UNE EN 1097-6. Ensayos para determinar las propiedades mecánicas y físicas de los áridos. Parte 6: Determinación de la densidad de partículas y la absorción de agua. Madrid, Spain; 2006 [22] Technical Association of Bituminous Emulsions (ATEB). Gravel-emulsion specifications. ATEB (consulted on-line in http://www.ateb.es/pdf/PLI_GRAVA.pdf last time on 08/08/2013) [23] Asphalt Institute. Asphalt Cold Mix Manual. Manual Series No. 14 (MS.14).Third edition. Asphalt Institute; 1997 [24] AENOR. Asociación Española de Normalización y Certificación. UNE 103-501-94. Geotecnia. Ensayos de compactación. Proctor modificado. Madrid, Spain; 1994 [25] Pasandín AR, Pérez I. Laboratory evaluation of hot-mix asphalt containing construction and demolition waste. Construction and Building Materials 2013;43:497-505 [26] Ministerio de Obras Públicas y Transportes. Normas NLT. Ensayos de carreteras. Dirección General de Carreteras, 2nd ed. Madrid, Spain; 2002. [27] AENOR. Asociación Española de Normalización y Certificación. UNE EN 12697-23. Métodos de ensayo para mezclas bituminosas en caliente. Parte 23: Determinación de la resistencia a la tracción indirecta de probetas bituminosas. Madrid, Spain; 2004 [28] AENOR. Asociación Española de Normalización y Certificación. UNE-EN 12697-26. Métodos de ensayo para mezclas bituminosas en caliente. Parte 26: Rigidez. Madrid, Spain; 2006 [29] Ministerio de Fomento. O.C. 24/08 sobre el Pliego de Prescripciones Técnicas Generales para obras de carreteras y puentes (PG-3); 2002 [30] Ozsahin TS, Oruc S. Neural network model for resilient modulus of emulsified asphalt mixtures. Construction and Building Materials. 2008;22:1436-1445 [31] Nageim Al H, Al-Busaltan SF, Atherton W, Sharples G. A comparative study for improving the mechanical properties of cold bituminous emulsion mixtures with cement and waste materials. Construction and Building Materials 2012;36:743-748. 28.
(30)
Figure
+7

Documento similar
In contrast to most natural systems, the behavior of artificial chemical substances, complexes or aggregates in multicomponent mixtures and the creation of
Impedance measurements were performed with dry and wet samples of both RC/4 and RC/4+dendrimer membranes; wet sam- ples mean immersed for 24 h in a 1 mM solution of the
aggregates from construction and demolition waste as road base layer. Road Materials and Pavement Design, 1-15. Analysis of chromium and sulphate origins in construction
Since such powers frequently exist outside the institutional framework, and/or exercise their influence through channels exempt (or simply out of reach) from any political
In a survey of 1,833 business management undergraduates in six Ibero-American countries, factor analysis identified three approaches to stakeholder relations, behaviors, and
Of special concern for this work are outbreaks formed by the benthic dinoflagellate Ostreopsis (Schmidt), including several species producers of palytoxin (PLTX)-like compounds,
The draft amendments do not operate any more a distinction between different states of emergency; they repeal articles 120, 121and 122 and make it possible for the President to
H I is the incident wave height, T z is the mean wave period, Ir is the Iribarren number or surf similarity parameter, h is the water depth at the toe of the structure, Ru is the
