Rate of campus wide information systems adoption in novice users and its relationships with complex adaptive systems
220
0
0
Texto completo
(2) Signature Page RATE OF CAMPUS WIDE INFORMATION SYSTEMS ADOPTION IN NOVICE USERS AND ITS RELATIONSHIPS WITH COMPLEX ADAPTIVE SYSTEMS. Approved by Dissertation Committee:. _____________________________________ Dr. Reuben McDaniel, Jr., Main Advisor, Professor of Information Management. _____________________________________ Dr. David Ángel Alanís Dávila, Advisor, Professor of Information Systems. _____________________________________ Dr. Rafael Modesto de Gasperín Gasperín, Advisor, Professor of Ethics and Philosophy. _____________________________________ Dr. Anabella del Rosario Dávila Martínez, Director of Doctoral Program. ii.
(3) Dedication. With all my heart to my lovely Wife: Florina, light of my life.. To my Daughter: Ana Sofía and her happiness. To my Daughter: María Paulina and her loveliness.. To my Mother: Martha and her unconditional love. To my Father: Jesús and his intelligence. To my Siblings: Rosa Ana, Luis Miguel and Mauricio.. To my committee: Reuben, David, and Rafael. To my Club (in ascii): Eusebio, Joaquín, Jaime, Rafael, Gerardo, Enrique, Raúl, Luis, Enrique, and Carlos.. To all my Friends and Colleagues. And GOD.. iii.
(4) Abstract in English RATE OF CAMPUS WIDE INFORMATION SYSTEMS ADOPTION IN NOVICE USERS AND ITS RELATIONSHIPS WITH COMPLEX ADAPTIVE SYSTEMS. Publication N°.___________________. Martín de Jesús González Martínez, Ph.D. Instituto Tecnológico y de Estudios Superiores de Monterrey, 2008. Main Advisor: Reuben McDaniel Jr.. When an organization is examined as a Complex Adaptive System (CAS) one is able to suggest that they take information from environment, and use this information to adapt themselves and change their own behavior. The CAS study in Organizational Theory has revealed that systems must operate far from equilibrium; where, by both negative and positive feedback, they are driven to paradoxical states of stability and instability, predictability and unpredictability. Two commonly observed characteristics of complex systems are a large number of interacting elements and emergent properties.. iv.
(5) A Campus Wide Information System can be defined as a set of interrelated components that collect or retrieve, process, store, and distribute information to support decision making and control in an University or College. Communications Systems theories emphasize there are two important elements of context, task and social influence. Most important is social influence, which affects perceptions of the task, the tools and their qualities, and their relevance to the task. Particularly when a communication medium is new, other people’s opinions cause a strong influence on new users. Use of Complex Adaptive Systems (CAS) Theory is helpful to understand the factors that might affect the rate of CWIS adoption, because it offers a solid base about the non-linear interactions between things, actors, and situation interlinked with. Deterministic theories, instead, try to use a rigid frame with chained trigger actions to comprehend complex relationships.. v.
(6) Abstract in Spanish TASA DE ADOPCIÓN DE UN SISTEMA DE INFORMACIÓN DE CAMPUS EN USUARIOS NOVATOS Y SU RELACIÓN CON SISTEMAS ADAPTIVOS COMPLEJOS. Publication N°.___________________. Martín de Jesús González Martínez, Ph.D. Instituto Tecnológico y de Estudios Superiores de Monterrey, 2008. Main Advisor: Reuben McDaniel Jr.. Cuando una organización se analiza como un Sistema Adaptativo Complejo (SAC), se puede decir que toma la información del medio ambiente y utiliza esta información para adaptarse y cambiar su propio comportamiento. El estudio de SACs en la Teoría de la Organización ha puesto de manifiesto que los sistemas deben operar lejos del equilibrio, donde por retroalimentación negativa o positiva, son impulsados a estados paradójicos de estabilidad e inestabilidad, previsibilidad e imprevisibilidad. Dos características comúnmente. vi.
(7) observadas de los sistemas complejos es que tienen un gran número de elementos interactuantes y propiedades emergentes. Un Sistema de Información de Campus (SIC) se puede definir como un conjunto de componentes interrelacionados que recuperan o capturan, procesan, almacenan y distribuyen información para apoyar la toma de decisiones y el control en una Universidad. Las teorías de Sistemas de Comunicación hacen hincapié en que existen dos elementos importantes del contexto, las tareas y la influencia social. Lo más importante es la influencia social, que afecta a la percepción de la tarea, las herramientas y sus cualidades, y su importancia para la tarea. En particular, cuando un medio de comunicación es nuevo, las opiniones de otras personas causan una fuerte influencia sobre los nuevos usuarios. El uso de la teoría de Sistemas Adaptativos Complejos es útil para comprender los factores que podrían afectar a la tasa de CWIS adopción, ya que ofrece una base sólida sobre la no-linealidad de las interacciones entre las cosas, actores y la situaciones interrelacionadas. Las teorías determinísticas, en cambio, tratan de encontrar un modelo mecánico con acciones que desencadenan otras acciones para comprender las relaciones complejas.. vii.
(8) TABLE OF CONTENTS Title Page..................................................................................................... i Signature Page ............................................................................................ ii Dedication ................................................................................................. iii Abstract in English ......................................................................................iv Abstract in Spanish ......................................................................................vi TABLE OF CONTENTS ..................................................................... viii LIST OF TABLES ............................................................................... xiv LIST OF FIGURES .............................................................................. xix CHAPTER 1. Importance of Research and Literature Review ......................... 1 Introduction ............................................................................................ 1 Organizations as Complex Adaptive Systems ........................................... 2 Importance of Complexity in Organizations Theory .................................. 6 Information Systems and CWIS ............................................................... 8 Social Influence and CWIS .................................................................... 11 Complexity, Organizations and CWIS .................................................... 14 Summary .............................................................................................. 16 CHAPTER 2. Methodology and Hypothesis................................................. 18 Purpose ................................................................................................ 18 Hypothesis ............................................................................................ 20 Complexity Framework ......................................................................... 24 viii.
(9) Connectivity and Interdependence. ................................................... 24 Co-evolution.................................................................................... 26 Far-from-equilibrium. ...................................................................... 27 Self-organization, Emergence and the Creation of new Order. ............ 28 Methodology ........................................................................................ 29 CHAPTER 3. Results ................................................................................. 32 Results ................................................................................................. 32 Survey Responses ................................................................................. 32 Correlations between Independent variables ........................................... 45 Correlations with Age. ..................................................................... 46 Correlations with Gender. ................................................................ 47 Correlations with Scholarship. .......................................................... 47 Correlations with Highschool. .......................................................... 47 Correlations with Internet Connection. .............................................. 48 Correlations with Career. ................................................................. 49 Correlations with Socialship. ............................................................ 51 Correlations with Self-Confidence. ................................................... 51 Correlations with Expertise. ............................................................. 53 Correlations with Help Assistance. ................................................... 53 Correlations with Homework through CWIS delivery importance. ..... 55 Correlations with Number of helper friends. ...................................... 56 Correlations with Failure times. ........................................................ 57 ix.
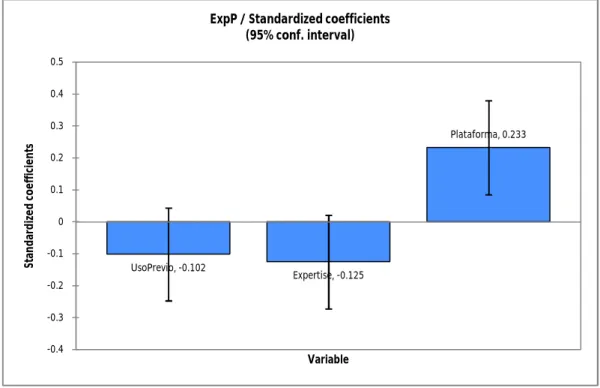
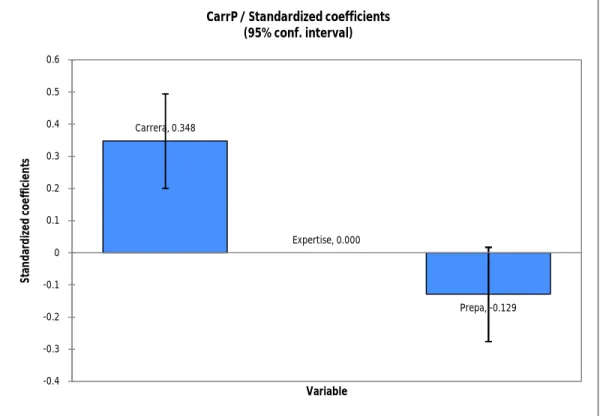
(10) Correlations with Other career helper friends. ................................... 58 Correlations with Same career helper friends..................................... 58 ANOVA analysis and Regression analysis .............................................. 58 H1: Students with experience with other CWIS have similar rate of CWIS adoption than the others (ExpP).......................................... 59 H2: Students of different careers have similar rate of CWIS adoption (CarrP) .............................................................................. 62 H3: Self-experimentation does not affect rate of CWIS adoption in students (AutoP) .......................................................................... 67 H4: Students with relationships with skilled CWIS users have similar rate of CWIS adoption than the others (RelP)......................... 72 H5:Usage importance does not affect the rate of CWIS adoption in students (ImpP) ............................................................................... 76 H6: Students believe that the quality of comments about the use of the CWIS from others does not affect their rate of CWIS adoption (UsoP)............................................................................................. 81 H7: Students believe that the quality of comments from others about the CWIS technical service does not affect their rate of CWIS adoption (TecP) ..................................................................... 85 H8 :. Confidence degree based upon experience does not affect. the rate of CWIS adoption in students (ConfP) .................................. 90. x.
(11) CHAPTER 4. Findings ............................................................................... 95 Findings ............................................................................................... 95 (Hypothesis H1): Students with experience with other CWIS have similar rate of CWIS adoption than the others (ExpP) ........................ 96 (Hypothesis H2): Students of different careers have similar rate of CWIS adoption (CarrP) .................................................................... 99 (Hypothesis H3): Self-experimentation does not affect the rate of CWIS adoption in students (AutoP) ................................................ 102 (Hypothesis H4): Students with relationships with skilled CWIS users have similar rate of CWIS adoption than the others (RelP) ...... 104 (Hypothesis H5): Usage importance does not affect the rate of CWIS adoption in students (ImpP).................................................. 108 (Hypothesis H6): Students believe that the quality of comments about the use of the CWIS from others does not affect their rate of CWIS adoption (UsoP)................................................................... 110 (Hypothesis H7): Students believe that the quality of comments from others about the CWIS technical service does not affect their rate of CWIS adoption (TecP) ........................................................ 113 (Hypothesis H8): Confidence degree based upon experience does not affect the rate of CWIS adoption in students (ConfP) ................. 116 Summary ............................................................................................ 119. xi.
(12) Chapter 5. Conclusions ............................................................................. 122 Conclusions Related to Individual Hypotheses...................................... 124 (Hypothesis H1a): Students with other CWIS experience have better rate of CWIS adoption than the others ................................... 124 (Hypothesis H2a): Students with informatics or technical related careers have a better rate of CWIS adoption than the others ............. 124 (Hypothesis H3a): Self-experimentation affects positively the rate of CWIS adoption in students ......................................................... 125 (Hypothesis H4): Students with relationships with skilled CWIS users have similar rate of CWIS adoption than the others ................. 126 (Hypothesis H5): Usage importance does not affect the rate of CWIS adoption in students ............................................................. 127 (Hypothesis H6a): Students believe that the quality of comments about the use of the CWIS from others affect their rate of CWIS adoption ........................................................................................ 128 (Hypothesis H7a): Students believe that the quality of comments from others about the CWIS technical service affect their rate of CWIS adoption .............................................................................. 129 (Hypothesis H8): Confidence degree based upon experience does not affect the rate of CWIS adoption in students .............................. 129 General Conclusions from the Study .................................................... 130 Future Research .................................................................................. 131 xii.
(13) APPENDIX.............................................................................................. 134 Descriptive Statistics - Previous experience helps?(ExpP) ..................... 134 Descriptive Statistics - Career helps?(CarrP) ........................................ 135 Descriptive Statistics – Self-experimentation helps?(AutoP) ................. 138 Descriptive Statistics - Relationships helps?(RelP) ............................... 148 Descriptive Statistics - Importance given helps?(ImpP) ......................... 160 Descriptive Statistics - Comments on using helps?(UsoP) ..................... 161 Descriptive Statistics - Comments on Technical service helps?(TecP).... 167 Descriptive Statistics - Self-confidence helps?(ConfP) .......................... 169 REFERENCES ......................................................................................... 182 VITA ....................................................................................................... 194. xiii.
(14) LIST OF TABLES Table 1. Correlations between positive and negative questions ......................... 31 Table 2. Population and Sample size................................................................ 32 Table 3. Results on rate of CWIS adoption ...................................................... 33 Table 4. Results on rate of CWIS adoption (simplified) .................................... 34 Table 5. Sample demographics ........................................................................ 35 Table 6. Age .................................................................................................. 36 Table 7. Gender .............................................................................................. 37 Table 8. From................................................................................................. 38 Table 9. Scholarship ....................................................................................... 39 Table 10. Working Status ................................................................................ 40 Table 11. Highschool ...................................................................................... 41 Table 12. Internet connection .......................................................................... 42 Table 13. Hours between Classes .................................................................... 43 Table 14. Career Student's Perception .............................................................. 44 Table 15. Socialship ....................................................................................... 45 Table 16. Between-subjects factors – Previous experience helps? (ExpP) .......... 59 Table 17. Tests of Between-Subjects Effects - Previous experience helps? (ExpP)................................................................................................. 59 Table 18. Model Summary (ExpP) .................................................................. 60 Table 19. ANOVA (ExpP) .............................................................................. 60 xiv.
(15) Table 20. Correlation matrix (ExpP) ................................................................ 60 Table 21. Variable selection (ExpP) ................................................................ 60 Table 22. Analysis of variance and Equation of the model (ExpP)..................... 61 Table 23. Between-subjects factors - Career helps? (CarrP) .............................. 62 Table 24. Tests of Between-Subjects Effects - Career helps? (CarrP) ................ 63 Table 25. Model Summary (CarrP) .................................................................. 63 Table 26. ANOVA (CarrP).............................................................................. 64 Table 27. Correlation matrix (CarrP) ............................................................... 64 Table 28. Variable selection (CarrP) ................................................................ 64 Table 29. Analysis of variance and Equation of the model (CarrP) .................... 65 Table 30. Between-subjects factors - Self-experimentation helps? (AutoP) ........ 67 Table 31. Tests of Between-Subjects Effects - Self- experimentation helps? (AutoP) ............................................................................................... 68 Table 32. Model Summary (AutoP) ................................................................. 68 Table 33. ANOVA (AutoP) ............................................................................. 69 Table 34. Correlation matrix (AutoP) .............................................................. 69 Table 35. Variable selection (AutoP) ............................................................... 69 Table 36. Analysis of variance and Equation of the model (AutoP) ................... 70 Table 37. Between-subjects factors - Relationship helps? (RelP)....................... 72 Table 38. Tests of Between-Subjects Effects - Relationships helps? (RelP) ....... 73 Table 39. Model Summary (RelP) ................................................................... 73 Table 40. ANOVA (RelP) ............................................................................... 74 xv.
(16) Table 41. Correlation matrix (RelP) ................................................................. 74 Table 42. Variable selection (RelP) ................................................................. 74 Table 43. Analysis of variance and Equation of the model (RelP) ..................... 75 Table 44. Between-subjects factors - Importance given helps? (ImpP) .............. 76 Table 45. Tests of Between-Subjects Effects – Importance given helps? (ImpP) 77 Table 46. Model Summary (ImpP) .................................................................. 77 Table 47. ANOVA (ImpP) .............................................................................. 78 Table 48. Correlation matrix (ImpP) ................................................................ 78 Table 49. Variable selection (ImpP) ................................................................ 78 Table 50. Analysis of variance and Equation of the model (ImpP)..................... 79 Table 51. Between-subjects factors - Comments on using helps? (UsoP) ........... 81 Table 52.Tests of Between-Subjects Effects - Comments on using helps? (UsoP)................................................................................................. 82 Table 53. Model Summary (UsoP) .................................................................. 82 Table 54. ANOVA (UsoP) .............................................................................. 83 Table 55. Correlation matrix (UsoP) ................................................................ 83 Table 56. Variable selection (UsoP) ................................................................ 83 Table 57. Analysis of variance and Equation of the model (UsoP)..................... 84 Table 58. Between-subjects factors - Technical service comments helps? (TecP) ................................................................................................. 85 Table 59. Test of between-subjects effects - Comments on technical service helps? (TecP)....................................................................................... 86 xvi.
(17) Table 60. Model Summary (TecP) ................................................................... 87 Table 61. ANOVA (TecP)............................................................................... 87 Table 62. Correlation matrix (TecP) ................................................................ 87 Table 63. Variable selection (TecP) ................................................................. 87 Table 64. Analysis of variance and Equation of the model (TecP) ..................... 88 Table 65. Between-subjects factors - Self-confidence helps? (ConfP) ................ 90 Table 66. Test of between-subjects effects - Self-confidence helps? (ConfP) ..... 91 Table 67. Model Summary (ConfP) ................................................................. 92 Table 68. ANOVA (ConfP) ............................................................................. 92 Table 69. Correlation matrix (ConfP) .............................................................. 92 Table 70. Variable selection (ConfP) ............................................................... 92 Table 71. Analysis of variance and Equation of the model (ConfP) ................... 93 Table 72. Tests of Between-Subjects Effects - Students with experience with other CWIS have similar rate of CWIS adoption than the others............. 99 Table 73. Tests of Between-Subjects Effects - Students of different careers have similar rate of CWIS adoption .................................................... 101 Table 74. Tests of Between-Subjects Effects - Self-experimentation does not affect the rate of CWIS adoption in students ....................................... 104 Table 75. Tests of Between-Subjects Effects - Students with relationships with skilled CWIS users have similar rate of CWIS adoption than the others 107 Table 76. Tests of Between-Subjects Effects – Usage importance does not affect the rate of CWIS adoption in students ....................................... 109 xvii.
(18) Table 77. Tests of Between-Subjects Effects – Students believe that the quality of comments about the use of the CWIS from others does not affect their rate of CWIS adoption................................................................ 112 Table 78. Tests of Between-Subjects Effects - Students believe that the quality of comments from others about the CWIS technical service does not affect their rate of CWIS adoption ...................................................... 115 Table 79. Tests of Between-Subjects Effects - Confidence degree based upon experiences does not affect the rate of CWIS adoption in students........ 119 Table 80. Descriptive Statistics - Previous experience helps? (ExpP) .............. 135 Table 81. Descriptive Statistics - Career helps? (CarrP) .................................. 138 Table 82. Descriptive Statistics - Self-experimentation helps? (AutoP) ........... 148 Table 83. Descriptive Statistics - Relashionships helps? (RelP)....................... 160 Table 84. Descriptive Statistics - Importance given helps? (ImpP) .................. 161 Table 85. Descriptive Statistics - Comments on using helps? (UsoP)............... 167 Table 86. Descriptive Statistics - Comments on Technical service helps? (TecP) ............................................................................................... 169 Table 87. Descriptive Statistics - Self-confidence helps? (ConfP) ................... 181. xviii.
(19) LIST OF FIGURES Figure 1. Planned behavior model ................................................................... 13 Figure 2. Model Proposed ............................................................................... 23 Figure 3. Career ID ......................................................................................... 35 Figure 4. Age ................................................................................................. 36 Figure 5. Gender............................................................................................. 37 Figure 6. From ............................................................................................... 38 Figure 7. Scholarship ...................................................................................... 39 Figure 8. Working Status ................................................................................ 40 Figure 9. Highschool ...................................................................................... 41 Figure 10. Internet connection ......................................................................... 42 Figure 11. Hours between Classes ................................................................... 43 Figure 12. Career Student's Perception ............................................................ 44 Figure 13. Socialship ...................................................................................... 45 Figure 14. Standardized coefficients (ExpP) .................................................... 62 Figure 15. Standardized coefficients (CarrP) .................................................... 66 Figure 16. Standardized coefficients (AutoP) ................................................... 71 Figure 17. Standardized coefficients (RelP) ..................................................... 76 Figure 18. Standardized coefficients (ImpP) .................................................... 80 Figure 19. Standardized coefficients (UsoP) .................................................... 85 xix.
(20) Figure 20. Standardized coefficients (TecP) ..................................................... 89 Figure 21. Standardized coefficients (ConfP) ................................................... 94 Figure 22. H1: Students with experience with other CWIS have similar rate of CWIS adoption than the others ............................................................. 97 Figure 23. H2: Students of different careers have similar rate of CWIS adoption ............................................................................................ 100 Figure 24. H3: Self-experimentation does not affect the rate of CWIS adoption in students ......................................................................................... 102 Figure 25. H4: Students with relationships with skilled CWIS users have similar rate of CWIS adoption than the others ..................................... 105 Figure 26. H5: Usage importance does not affect the rate of CWIS adoption in students ............................................................................................. 108 Figure 27. H6: Students believe that the quality of comments about the use of the CWIS from others does not affect their rate of CWIS adoption ....... 110 Figure 28. H7: Students believe that the quality of comments from others about the CWIS technical service does not affect their rate of CWIS adoption 113 Figure 29. H8: Confidence degree based upon experience does not affect the rate of CWIS adoption in students ...................................................... 117 Figure 30. Final Model ................................................................................. 121 Figure 31. Final Model ................................................................................. 123. xx.
(21) CHAPTER 1. Importance of Research and Literature Review. The purpose of this research was to find factors that affected the rate of adoption of a Campus Wide Information System (CWIS) by novice users. This research will contribute to a better understating of the intersection of Complex Adaptive Systems (CAS) and CWIS by showing us how the novice users’ perception affects their introduction to an unfamiliar CWIS.. Introduction The technical nucleus of an organization determines the degree of diversity, complexity, unpredictability, and interdependence. As greater technical complexity produces an increased structural differentiation, greater technical uncertainty leads to decreased formalization and centralization of the structure; while greater technical interdependence requires greater coordination. (Kamps, J. & Pólos L., 1999). In order to assure stability, an organization can use specific strategies to cushion the surrounding disturbances in the technical nucleus; but these shock absorbers can be inadequate and uncertain (Hedberg, B. & Jonson, S., 1978) and may penetrate the technical nucleus (Hitt, L., & Snir, E., 1999). The demands of technology in the organizational structure can be summarized by the amount of information that must be processed during the execution of a sequence of tasks (Thompson, 1967). 1.
(22) Following the norms of rationality, if the environment is complex, an organization is more likely to build barriers around its technical nucleus, surrounding it with input and output components. For example, there are organizational rules to use Information Systems: password for users or different granularity access in data bases. An organization will attempt to reduce the complexity of its environment by smoothing input and output transactions: for example, help desks or frequently asked questions list. An organization will challenge to predict the amount of uncertainty and fluctuation in a complex environment (Nayar, 1993), for example: Organizations offer courses and training programs to support people for the correct use of the information system. The view of organizations as Complex Adaptive Systems (CAS) suggests that organizations gather information about their surroundings, themselves and their own behavior (Kauffman, 1995) and then use this information to adapt to their environments. (Ashmos, D. & Huber, G., 1987; Ashmos, D., Duchson, D. & McDaniel, R., 2000).. Organizations as Complex Adaptive Systems Organizations could be viewed as dynamic systems which contain multiple parts that interact with one another and the environment (Morel & Ramanujan, 1999; 2.
(23) Scott, 1982; Seel, 2003). Two commonly observed characteristics of complex systems are large number of interacting elements and emergent properties. Interactions are typically associated with the presence of feedback mechanisms in the system; they introduce nonlinearities in the dynamics of the system (Stacey, 1996; Styhre, 2002). The appearances of patterns due to the collective behavior of the components of the systems are called emergent properties. Chalquist in 2003 proposed ten characteristics for CAS: First, agents in organizations are arranged around interactions and within hierarchy of interrelated subsystems; managers are the executive subsystem, while employees are the functional subsystem. These subsystems could have both weak and strong boundaries since certain decision-making cannot be done by employees while certain skilled operations cannot be done by managers. Depending of the level of analysis, an agent may represent an individual, a project team, a division, or an entire organization. Agents have varying degrees of connectivity with other agents through which information and resources can flow. Agents have schemata that are both interpretative and behavioral. Schemata may be shared between the collectives that make up an organization’s culture, or may be highly individualistic (Bak, 1996). Second, wholeness: the system is greater than the sum of the parts. Agents grow in a linear way, while interactions grow in a non-linear way (most of the times growing exponentially). Complex Adaptive Systems (CAS) resist simple reductionist. 3.
(24) analyses, because interconnections and feedback loops prevent holding some subsystems constant in order to study others in isolation (Anderson, 1999). Third, each part of the system affects all others: Everything is connected to everything else. Adequate interactions or distorted interactions can change the status of the system, balancing at the edge of chaos. When the quality of connections is randomly distributed the capability of variety in behavior is improved, enhancing the capacity of self-organizing which in turn leads to adaptability. (Ashmos, D., Huonker, J. & McDaniel, R., 1998). Fourth, interrelations are emphasized more than components: nonlinear system wide ripples are emphasized more than linear ones. For this, no one can completely predict the behavior of the system; little deviations can produce great or small changes, or even have no visible effect at all. Behavior in a CAS is induced not by a single entity but rather by the simultaneous and parallel actions of agents within the system itself. The behavior of a CAS is emergent. Fifth, circular causality emphasizes the present and the process while linear causality emphasizes the past and the content. Present changes follow an uncertain process with feedback. Past changes can be traced backwards to diagnose problems, but cannot change present situations or events (Santosus, 1998). Sixth, self-regulation via feedback loops is used to maintain dynamic stability (Negative feedback toward stability, positive feedback toward change). Vicious or virtuous circles are immediately obvious examples of positive and negative feedback 4.
(25) loops in organizations (Stacey, 1995). The nonlinearity of feedback loops are essential properties of organizational life. Behavior patterns can emerge without being planned and in fact often emerge contrary to intention, producing unexpected and counter intuitive outcomes. Seventh, synergy: interactions and feedback loops add to each other as they combine (a dynamic expression of wholeness). Many actions are irreversible (Driebe, 1999) and have path dependence (Sterman, 2000). Eighth, equipotentiality: agents with the same original conditions can go different ways. Ninth, equifinality: agents with different original conditions can turn out the same. Finally, tenth, CAS exhibit self-organizing behavior: even when starting in a random state, CAS usually evolves toward order instead of disorder. Organization structures created by managers with formal paths and agents for communications and command usually also have informal paths with different agents in charge. All properties fall in two general classes: Static Complexity, which addresses how an object or system is put together (only purely structural informational aspects of an object), and is independent of the processes by which information is encoded and decoded; and Dynamic Complexity, which addresses how much dynamical or computational effort is required to describe the information content of an object or state of a system. One must note that while a system's static complexity certainly 5.
(26) influences its dynamical complexity, the two measures are not equivalent. A system may be structurally rather simple (have a low static complexity), but have a complex dynamical behavior.. Importance of Complexity in Organizations Theory The Complexity science provides very different models for how organizations work (Mainzer, 1997; Waldrop, 1992; Kauffman, 1995; McDaniel & Driebe, 2001; Chen, 1999; Dooley, 2002). Opposite to the machine model, Complexity Theory suggests that organizations are organic, and living systems (Capra, 2002; Fitzgerald & Eijnatten, 2002; Eijnatten & vanGalen, 2002; Luhmann, 1995). The Complex Adaptive Systems study in Organizational Theory has revealed that in order to produce creative, innovative, continually changeable behavior, systems must operate far from equilibrium; where, by both negative and positive feedback, they are driven to paradoxical states of stability and instability, predictability and unpredictability (Stacey, 1995; Edgar. 1996; McDaniel, Jordan & Fleeman, 2003). In 1999, Mathews, White & Long proposed that social systems in general and social organizations in particular, would appear to be prime examples of organized complexity. It seems reasonable that insights from the complexity sciences should be examined with the goal of furthering our understanding of how complex systems, such as organizations, change and transform over time. 6.
(27) Complex Adaptive Systems may exhibit a chaotic behavior. This is not a lack of order, but order of Complexity that is difficult or impossible to describe in simple terms and that cannot be broken down into simple equations. This behavior often requires complex narrative to describe it (Dhillon & Ward, 2002). In this research framework the authors consider chaos as a property embedded in CAS. According to Gleick (1988), the concept of chaos suggests an absence of organization, a disorder in which uncertainty and unpredictability predominate. This would seem a strange field of study to unite with Information Systems, which is predominately concerned with order (Bechtold, 1997). However, Chaos refers to what might be called ordered disorder (Thietart & Forgues, 1995). Patterns are present in chaotic behavior, but they are not regular or easily predictable (Tsoukas, 1998; Weick, 1985). When considering chaos in the context of organizations, it should be noted that it is the complexity of human behavior and actions which will give raise to chaotic phenomenon (Guastello, 1995; Richards, 1990). The concepts of chaos may be a better explanation of organizational behavior than the more traditional explanations of scientific management, since organizations are complex and a dynamic phenomenon (Pigliucci, 2000; Levy, 1994). As Helfer (1998) stated, complexity and chaos are different but linked. Chaos explains how complex things arise from simple systems; complexity explains how simple things arise from complex systems (Keene, 2000; Cartwright, 1991). Chaos explains how simple non-linear systems lead to extremely complicated behavior;. 7.
(28) complexity explains how simple interactions of many things (often repeated) lead to higher-level patterns. Chaos explains how to recognize, describe, and make meaningful predictions from systems that exhibit that property; complexity explains how a complicated system can lead to surprising patterns, when the system is looked at as a whole (Dent, 1999). Chaos uses a reductionist analysis, explaining phenomena in terms of simple entities or already explained things, and the interactions between them; complexity uses a reductionist analysis, explaining macro-level phenomena directly in terms of the most basic elements, without using resources in intermediate levels (or without resources for the intermediate levels)(Fitzgerald & Eijnatten, 2002a; Murray, 1998).. Information Systems and CWIS An information system can be defined as a set of interrelated components that collect or retrieve, process, store, and distribute information to support decision making and control in an organization (Laudon & Laudon, 2004; King, Gruber & Hufnagel, 1989; Stump & Sriram, 1997). An information system within an organization should be established on the basis of clearly defined potential benefits (Gathers, R. & Sutherland, A., 1991). It must be said that the people component of information systems is different than the hardware and software components. While there are a limited amount of information systems in organizations (Ryssel, R., Ritter, T. & Gemünden, H., 2004), there are 8.
(29) many more people and each one of them is unique; people are less predictable than either hardware or software; people live and work as members of a community; and, the most obvious, people have feelings, sensitivities and needs. People live and work in the organization community and culture far beyond their role as components of the information system (Connolly, 1999). Information Systems are intended to facilitate the accomplishment of institutional goals (Martin, W., Brown, V., DeHayes, W. Hoffer, J. & Perkins, C., 1999). Hardware and software are planned, evaluated, purchased, installed and exploited to further those goals (Connolly, 1999; Broadbent, M., Weill, P. & St. Clair, D., 1999; Jonston & Vitale, 1988). While people can be viewed as components of an information system, Kant’s Categorical Imperative implies that they ought not to be considered solely as components of an information system, no matter how important the system may be to the organization (Mason, 1986). “Technology is not nature, but man. It is not about tools, it is equally about how man lives and how man thinks” (Drucker, 1989) Traditionally, information sharing among university members has relied on a range of printed materials. Computer technology created opportunities on university campuses for sharing data and information between the staff and the students, and has been deployed since the late fifties (Sullivan, 1996). University information systems range from library systems, registration systems, and financial systems, to campushousing systems and other university service systems.. 9.
(30) A Campus Wide Information System (CWIS) is a computer-based integrated information system providing information about various aspects of a college campus. CWIS has been around for some time and was originally developed on mainframe computers, but is now available on a variety of platforms. The term has broadened to include information systems in schools and other campus-type institutions (Ford, 1994). For the purposes of this study, a CWIS refers to an academic platform to interact and archive selected information about professors’ lectures, student’s homework and alumni cooperative work. Related elements in a CWIS are e-mail, chat room, topics schedule, and homework drop box (Connolly, 1999). Actis (1995) argued that the selection and organization of information (content) is the most important consideration if the CWIS is to be used well. It should contain information that is informative, and even entertaining, because it has to motivate the user to want to explore it further (Klein, B., Goodhue, D. & Davis, G., 1997). The menu structure must be organized in such a way that the novice user can find the needed information intuitively (Redman, 1995); however, a design problem always arises when novice people try to use a system, since designers select skilled users as model users (Laudon & Laudon, 2004); and this expert users have a different view about CWIS services. Web-based solutions are accepted nowadays because they reduce the costs of client configuration for each new version, have lower user training costs, use the existing infrastructure and support personnel, and can be accessed from anywhere, anytime and on many (or any) devices (Changiz, Moeeny & Jowsan, 2004). 10.
(31) In this work, CWIS is understood as a collection of information among teachers and students; all materials teachers select for their pupils and all materials students create, manage and transfer between themselves and to teachers: like homework, essays, exams and quizzes. Because CWIS affects not only a large portion of the campus population, but also influence the campus culture, the views and perspectives of stakeholders from across the campus community need to be recognized and weighed; it is no longer enough to limit considerations to technical issues and the bottom line in budgets (Connolly, 1999).. Social Influence and CWIS CWIS is a communication tool and an information resource. Its resources can be accessed only through communications networks (Klobas, J. & Clyde, L., 1998). Library and information Scientists have tended to see the CWIS primarily as an information resource, hence their emphasis on information quality and accessibility (Ryssel, R., Ritter, T. & Gemünden, H., 2004). However, other points of view can be found in the literature of communications systems and of information technology and information systems. Communications systems theories emphasize the contextual aspects of use over the system’s quality characteristics. The two important elements of context, task and social influence, are critical to these theories. Most important is social influence, 11.
(32) which affects perceptions of the task, the tools and their qualities, and their relevance to the task (Fulk, J., Schmitz, J. & Steinfield, C., 1990). Particularly when a communication medium is new, other people’s opinions cause a strong influence on new users (Markus, 1990). Early work on information systems use in organizations also recognized the importance of social influence. The support of managers is, for example, a critical social influence on workers’ attitudes to information systems and their use (Lucas, 1978). Social psychologists have long recognized how strongly social influences motivate human behavior (Ajzen, I. & Fishbein, M., 1977). A parent’s approval or disapproval strongly influences a child’s behavior; a teenager’s peer group strongly influences choice of recreational activities and clothing; adults are likely to read books and attend events recommended by friends and colleagues. Klobas & Clyde (1998) demonstrated how social influences affected portal use in a CWIS study in Australia in the early 1990s. Using structural equations modeling, she demonstrated that a limited set of social influences (peers and coworkers) had a strong influence on CWIS used of perceived information quality. Following Ajzen (1985), Kloba’s model (Figure 1) explains networked information resource use as a function of intentions to use the information resource. Intentions are formed from attitudes of outcomes of use, included perceived usefulness and enjoyment of use, and perceived control of use, included perceived accessibility and convenience. These attitudes, in turn, reflect users’ perceptions of the quality of the 12.
(33) information resource. All these influences are affected by the social context of use, including management support, colleague and peer group influences, family and friends expectations, and the media.. Figure 1. Planned behavior model. Source:(Klobas, J. & Clyde, L., 1998). According to Strauss (1992) a successful CWIS must be on-line accessible from anywhere at any time. It must be usable by anyone who wants to use it; designed in such a way that users are not even aware of the software involved; containing an intuitive, user-friendly interface for a variety of platforms. It must be easy to update and maintain; having menus that are structured logically and intuitively so that users can easily find what they want; containing a heterogeneous mix of data drawn from across the university: from the community in which faculty, staff and students live, and from global sources. And it must contain enough 13.
(34) information that is compelling and entertaining to invite people to explore and use the system.. Complexity, Organizations and CWIS Complexity is a qualitative concept; though several attempts have been made by various researchers to provide a more or less useful and general quantitative definition, such as: algorithm complexity (sometimes called Kolmogorov complexity), computational complexity (May, 1976) or logical depth, thermodynamic depth (Palmer & Parker, 2001), and mutual information (Jost, 1998; Frederick, 1998). According to Lagenfors, (1995, p.70) “Complexity is the property of being a thing that can only be perceived piecewise,” and, “A thing is complex when it surpasses human cognitive limitations”; (Lagenfors, 1995, p.87). Ashby (1973, p. 1) regards, “a system’s complexity [as] purely relative to a given observer” and as “something in the eye of the beholder”. Nakagawa & Yasui (1999) have defined the complexity of redundant systems as the number of paths, and entropy represents the vagueness associated with incomplete information. The science of complexity is a broad domain that embraces chaos (Pascale, 1999). The key parameters that the new science deals with are intelligence, information processing and nonlinearity. Systems in which information and information processing ability are intrinsically embedded are intelligent CAS (Caldart & Ricart, 2004). Such intelligent systems have structure and are constantly 14.
(35) consuming information. The intelligent dynamic aspect encompasses learning, adaptation, competition, and co-evolution with the environment (Liang, 2002). Although the linear portion of the world is a very significant part of our existence, the remaining huge component is nonlinear. In many instances, an awareness and understanding of their similarities and differences is vital. Usually, nonlinear phenomena are not easily predictable because a slight difference in initial conditions can lead to a very dissimilar outcome, a characteristic known as the butterfly effect. Business organizations behave with nonlinearity, manifesting the characteristic of complex adaptive systems (Johnson, L. & Burton, K., 1994). According to Bergmann (2000), the four basic assumptions underlying nonlinear dynamic systems are: change is constant, emergent systems are not reducible to their parts, mutual dependence, and complex systems behave in non-proportional ways. Every organization is tied together by information (Lagenfors, 1995). Any such information system will thus have a certain degree of complexity (Sterman, 1994; Vosburg & Kumar, 2001). A certain minimum amount of information is needed to control a process. Given the alternative characterization above, the controller will need at least, the internal variety required to represent the information to control the process. When the complexity of a process increases, the information needed to control that process increases as well (Backlund, 2002). For CWIS some standards were developed to reduce complexity (Actis, 1995): Appropriateness: appropriate information must be defined as information that 15.
(36) may be of general interest to members of CWIS. Currency: information providers must review and update information regularly. Accuracy and quality: documents were to be error-free in terms of spelling and grammar. Copyright: existing copyright and privacy laws must be honored. Format: standards were set for converting wordprocessed documents to standard format. In a human system, complexity, and mainly emergence, tends to create irreversible structures or ideas, relationships and organizational forms; which become part of the history of individuals and institutions and in turn affect the further evolution of those entities. For example, the generation of knowledge and of innovative ideas when a CWIS designing team or a CWIS user team is working together could be described as an emergent property; in the sense that it arises from the interaction of individuals and is not just the sum of existing ideas, but could well be something quite new and possibly unexpected. Once the ideas are articulated, they form part of each individual’s history and part of the shared team’s history (the process is not reversible); and these new ideas and new knowledge can be built upon to generate further new ideas and knowledge.. Summary When an organization is examined as a Complex Adaptive System (CAS) one is able to suggest that they take information from environment, and use this information to adapt themselves and change their own behavior. Two commonly 16.
(37) observed characteristics of complex systems are a large number of interacting elements and emergent properties. The CAS study in Organizational Theory has revealed that systems must operate far from equilibrium; where, by both negative and positive feedback, they are driven to paradoxical states of stability and instability, predictability and unpredictability. A Campus Wide Information System can be defined as a set of interrelated components that collect or retrieve, process, store, and distribute information to support decision making and control in an University or College. Communications Systems theories emphasize there are two important elements of context, task and social influence. Most important is social influence, which affects perceptions of the task, the tools and their qualities, and their relevance to the task. Particularly when a communication medium is new, other people’s opinions cause a strong influence on new users.. 17.
(38) CHAPTER 2. Methodology and Hypothesis. Purpose The purpose of this research is to find patterns of perception of the Campus Wide Information System novice users: perceptions regarding the interactions among them as well as of the relationship between them and CWIS during the introductory period. This research will contribute to a better understating of the intersection of Complex Adaptive Systems (CAS) and Campus Wide Information Systems by showing us how the novice users’ perception affects their introduction to an unfamiliar CWIS. The research was conducted in a private high-tech Mexican University (ranked #1 in 2005 by CUCEA (Centro Universitario de Ciencias Económico-Administrativas or University Centre of Economic and Managerial Sciences in English) Institute, ranked #5 in 2006 Latin-American University by webometrics rank an IT-based rank) with almost 17,000 students, and almost 30% of students with full or partial scholarship. Six groups of people were selected; each group consisted of novice students (1st semester alumni) of a specialty. Students were selected from a range of skills based on each one’s actual specialty. Two groups of students were taken from informatics careers, two groups from business careers, and two groups from technical non-informatics careers. 18.
(39) All first semester alumni have similarities: they are recent members of the organization, and they have fears and limited knowledge about the new environment, they could have similar expectations about the new relationships and the orders they have to follow. People related to informatics tend to be more open to using information technology, people related to business and administration tend to have better relationships with others, people in architecture and engineering tend to be more disciplined and have more formal mental models. Students in technical or informatics areas have a higher degree of scholarships than business areas. Technical and informatics people tend to have greater computer usage than business people, but business people tend to have better information technology resources and services. This research will show that rate of CWIS adoption is a relationship between some of these items: previous experience, kind of careers, self-experimentation, relationships with skill users, usage importance, quality of comments about usage, quality of comments about technical service, and degree of self-confidence.. 19.
(40) Hypothesis Hypothesis to test are grouped in 3 main blocks: People’s characteristics •. Previous experience: could affect (in a positive or negative way); variables related are UsoPrevio (Previous CWIS used), Expertise and Plataforma (actual CWIS used):. H1:. Students with experience with other CWIS have similar rate of CWIS adoption than the others. H1a: Students with experience with other CWIS have better rate of CWIS adoption than the others •. Kind of career: could affect (in a positive or negative way), variables related are Carrera (Career), Expertise, Género (Gender), and Prepa (Highschool):. H2:. Students of different careers have similar rate of CWIS adoption. H2a: Students with careers related to informatics or technical have better rate of CWIS adoption than the others •. Self-experimentation: could affect (in a positive or negative way), variables related are Tauto (Self-experimentation time), Tuso (Time connection), TarNoEnt (Homeworks not delivered), Expertise, Plataforma (actual CWIS used), Edad (Age), Género (Gender), Horario (Hours in school), and Internet (Internet connection type):. 20.
(41) H3:. Self-experimentation does not affect the rate of CWIS adoption in students. H3a: Self-experimentation affects positively the rate of CWIS adoption in students. People’s relationships •. Relationships with skilled users: could affect (in a positive or negative way), variable related are: Vexp (Times of consults with experts), Namigos (Number of helper friends), Npermisma (Helper people from same career), Nperdife (Helper people from another career), Expertise, Plataforma (actual CWIS used), Edad (Age), Género (Gender), and Prepa (Highschool):. H4:. Students with relationships with skilled CWIS users have similar rate of CWIS adoption than the others. H4a: Students with relationships with skilled users of the CWIS have greater rate of CWIS adoption than the others •. Usage importance: could affect (in a positive or negative way), variables related are Imprentrega (importance given to delivery of Homework through CWIS), Tarnoentr (Homework not delivered), and Plataforma (actual CWIS used):. H5:. Usage importance does not affect the rate of CWIS adoption in students. H5a: Usage importance affects the rate of CWIS adoption in students 21.
(42) People and CWIS relationships •. Quality of comments about usage: could affect (in a positive or negative way), variables related are Comuso (Use comments), Tfueralin (Off line total time), Plataforma (actual CWIS used), and Nfallas (Failure times):. H6:. Students believe that the quality of comments about the use of the CWIS from others does not affect their rate of CWIS adoption. H6a: Students believe that the quality of comments about the use of the CWIS from others affects their rate of CWIS adoption •. Quality of comments about technical service: could affect (in a positive or negative way), variables related are Comtec (Technical service comments), Nquejas (number of Complaints), Nusuarios (Number of users), and Plataforma (actual CWIS used):. H7:. Students believe that the quality of comments from others about the CWIS technical service does not affect their rate of CWIS adoption. H7a: Students believe that the quality of comments from others about the CWIS technical service affects their rate of CWIS adoption •. Confidence degree: could affect (in a positive or negative way), variables related are: Confmi (Self-trust), Facayu (Easiness for help assistance), Comuso (Use comments), Comtec (Technical service comments), Plataforma (actual CWIS used), Expertise, Social (Sociableness), Carrera (Career), Edad (Age), and Género (Gender): 22.
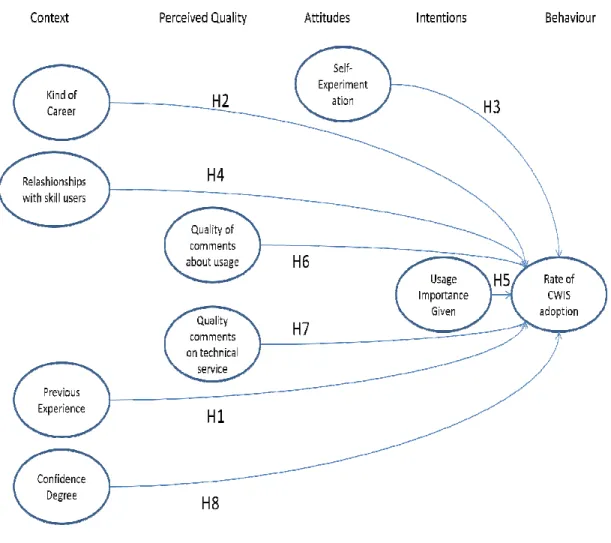
(43) H8:. Confidence degree based upon experience does not affect the rate of CWIS adoption in students. H8a: Confidence degree based upon experience affects the rate of CWIS adoption in students Hypothesis could be accommodated in five stages, Context, Perceived Quality, Attitudes, Intentions, and Behaviour (Klobas, J. & Clyde, L., 1998), as shown in Figure 2.. Figure 2. Model Proposed. 23.
(44) Complexity Framework Connectivity and Interdependence. Complex behavior arises from the interrelationship, interaction, and interconnectivity of elements within a system and between a system and its environment (Anderson, 1999). In a human system, connectivity and interdependence mean that a decision or action by any individual in a human activity system (society, group, organization, or institution), may have an impact on related individuals and systems (Bak, 1996). That impact will not have equal or uniform effect, and will vary depending on the ‘state’ of each related individual and system, at the time. The ‘state’ of an individual or a system will include its history and its constitution, which in turn will include its organization and structure. Connectivity refers to the interrelatedness of individuals within a system, as well as to the relatedness between human social systems, it include systems of artifacts such as information technology or CWIS and intellectual systems of ideas (Ashmos, D., Huonker, J., & McDaniel, R., 1998). In CWIS management the man-machine interface is part of that interconnectivity, as well as the requirements to integrate different information technology systems (Connolly, 1999). Complexity theory does not postulate the need for an ever-increasing connectivity, since high connectivity implies a high degree of interdependence. This means that the greater the interdependence between related systems or entities, the wider the ‘ripples’ of perturbation or disturbance from a move or action by any entity 24.
(45) on all the other related entities (Helfer, 1998). A high degree of interdependence may not always have beneficial effects throughout the system. When one entity tries to improve its position, this may result in a worsening condition for others. Each ‘improvement’ in one entity therefore, may impose associated ‘costs’ on other entities, either within the same system or on other related systems. As every software engineer knows, non-intended interdependence in CWIS, in large complicated systems, is often responsible for unexpected consequences when systems are updated or enhanced (Laudon, K. & Laudon, J., 2004). Intense interconnectivity creates multiple and intricate dependencies throughout the system, which cannot be pulled apart. Hence complexity theory suggests that outcomes are often non-deterministic (Stacey, 1995). As any software engineer knows, interdependence plays an important role in large IT systems, which become apparent when one part is changed; this results in unforeseen and often significant effects in other parts of the system (Sterman, 2000). Hypothesis related to Connectivity and Interdependence: H4:. Students with relationships with skilled CWIS users have similar rate of CWIS adoption than the others. H5:. Usage importance does not affect the rate of CWIS adoption in students. H6:. Students believe that the quality of comments about the use of the CWIS from others does not affect their rate of CWIS adoption. H7:. Students believe that the quality of comments from others about the CWIS technical service does not affect their rate of CWIS adoption 25.
(46) H8:. Confidence degree based upon experience does not affect the rate of CWIS adoption in students. Co-evolution. Connectivity applies not only to elements within a system but also to related systems within an ecosystem. In biology, as entities and organisms interact and adapt within an ecosystem they alter “both the fitness and the fitness landscape of the other organisms” (Kauffman, 1995). In an ecosystem, the way each element influences and is in turn influenced by all other related elements is part of the process of coevolution, which Kauffman describes as “a process of coupled, deforming landscapes where the adaptive moves of each entity alter the landscapes of its neighbors.” (Kauffman, S. & Macready, W., 1995) Another way of describing co-evolution is that the evolution of one domain or entity is partially dependent on the evolution of other related domains or entities (Santosus, 1998); or that one domain or entity changes in the context of the others. Hypothesis related to Co-Evolution: H6:. Students believe that the quality of comments about the use of the CWIS from others does not affect their rate of CWIS adoption. H7:. Students believe that the quality of comments from others about the CWIS technical service does not affect their rate of CWIS adoption. 26.
(47) Far-from-equilibrium. Another key concept in complexity is that of ‘far-from-equilibrium’. When open systems are pushed ‘far-from-equilibrium’, they are able to create new structures and order. Originally, it applied to physical and chemical systems, but it was of such significance in explaining complex behavior that the concept has been adopted in other fields (Levy, 1994). In a social context, ‘far-from-equilibrium’ means moving away from established norms, procedures and ways of working and relating (Fitzgerald, L., & Eijnatten, F., 2002). An observer cannot predict which state will emerge; “only chance will decide, through the dynamics of fluctuations. The system will, in effect, scan the territory and will make a few attempts, perhaps unsuccessful at first, to stabilize. Then a particular fluctuation will take over. By stabilizing it, the system becomes a historical object in the sense that its subsequent evolution depends on this critical choice.” (Nakagawa, T. & Yasui, K., 1999) Hypothesis related to Far-from-Equilibrium: H1:. Students with experience with other CWIS have similar rate of CWIS adoption than the others. H2:. Students of different careers have similar rate of CWIS adoption. H4:. Students with relationships with skilled CWIS users have similar rate of CWIS adoption than the others. H5:. Usage importance does not affect the rate of CWIS adoption in students. 27.
(48) H8:. Confidence degree based upon experience does not affect the rate of CWIS adoption in students. Self-organization, Emergence and the Creation of new Order. Kauffman in the ‘Origins of Order: Self-Organization and Selection’ (1993), brings the importance of self-organization in the evolutionary process. He calls Darwinian natural selection a “single singular force” and argues that, “It is this singleforce view which I believe to be inadequate, for it fails to notice, fails to stress, and fails to incorporate the possibility that simple and complex systems exhibit order spontaneously.” (Kauffman, 1993) That spontaneous order is self-organization: he argues that natural selection is not the sole source of order in organisms and suggests that both natural selection and self-organization are necessary for evolution; he then proceeds to expand evolutionary theory to incorporate both evolutionary forces. Emergent properties, qualities, patterns, or structures, arise from the interaction of individual elements. They are structures or patterns that appear at the next macro level as a result of interaction at a lower micro level. The relationship between the micro-events and macro-structures is iterative. It is a co-evolutionary process whereby, through their interaction, the individual entities and the macro-structures create influence on each other in an ongoing iterative process. Emergence is the process that creates new order together with self-organization. In an organizational context, self-organization may be described as the spontaneous coming together of a group to perform a task (or for some other. 28.
(49) purpose); the group decides what to do, how and when to do it; and no one outside the group directs those activities (Bak, 1996). Emergence in a human system tends to create irreversible structures or ideas, relationships and organizational forms, which become part of the history of individuals and institutions and in turn affect the further evolution of those entities (Frederick, 1998). Hypothesis related to Self-Organization: H3:. Self-experimentation does not affect rate of CWIS adoption in students. H4:. Students with relationships with skilled CWIS users have similar rate of CWIS adoption than the others. H6:. Students believe that the quality of comments about the use of the CWIS from others does not affect their rate of CWIS adoption. H7:. Students believe that the quality of comments from others about the CWIS technical service does not affect their rate of CWIS adoption. H8:. Confidence degree based upon experience does not affect the rate of CWIS adoption in students. Methodology This was a survey study. First, the survey was designed and sent to 9 experts in CWIS (3), Information Systems Design (2), Complexity Theory (1) and Education (3) with the purpose of performing content validity, and logical validity. These experts 29.
(50) were selected based on their background and related fields to the study (Davis, 1992). The number of experts was set it up by the volunteers granted; Lynn (1986) suggested minimum of three, but others (Walz, C., Strickland, O. & Lenz, E., 1991) have suggested a range from 2 to 20 experts. Grant & Davis (1997) noted the number of experts depends on the desired level of expertise and diversity of knowledge. After the items were evaluated in content validity by the experts and corrections were made, one face validity (McGarland, D., Berg-Weger, M., Tebb, S., Lee, E. & Rauch, S., 2003) was set up with 32 first-semester students from an introductory course. Some details were corrected. Data was collected by an anonymous survey sent via e-mail. Questions were asked in three different ways, in Spanish: neutral, positive, and negative way (i.e. “My kind of career does not affect my adoption velocity of a CWIS”, “My kind of career helps me to accelerate my adoption velocity of a CWIS”, and “My kind of career negatively affect my adoption velocity of a CWIS”). Two pilot tests were implemented; first, one showed some problems with neutral questions and misunderstanding, for this, 32 students were asked about the test (face validity). More explanation was added, neutral questioning was deleted and an improved version of the survey was applied to a new 36 students. They reported no problems to understand the survey. Finally survey was sent to a 214 first-semester students; an incentive was set up (movie tickets were gifted), and 175 respond the survey. The survey showed a good correlation between positive and negative questions (Table 1). Positive questions 30.
(51) were selected and values over 3 were set up to 3, then only values 1, 2 and 3 were used. Correlation matrix (Pearson): Variables ExpN CarrN AutoN RelN ImpN UsoN TecN ExpP -0.836 -0.099 -0.108 -0.223 -0.240 -0.322 -0.127 CarrP -0.126 -0.600 -0.113 -0.305 -0.092 -0.338 -0.364 AutoP -0.106 -0.217 -0.766 -0.155 -0.288 -0.028 -0.153 RelP -0.176 -0.331 -0.222 -0.554 -0.215 -0.235 -0.252 ImpP -0.214 0.038 -0.062 -0.090 -0.724 -0.083 -0.071 UsoP -0.272 -0.282 -0.005 -0.050 -0.123 -0.695 -0.093 TecP -0.164 -0.209 -0.192 -0.199 -0.197 -0.140 -0.808 ConfP -0.372 -0.199 -0.228 -0.376 -0.317 -0.084 -0.266 Values in bold are significantly different from 0 with a significance level alpha=0.05 Table 1. Correlations between positive and negative questions. 31. ConfN -0.303 -0.210 -0.285 -0.337 0.025 -0.084 -0.297 -0.566.
(52) CHAPTER 3. Results. Results The targeted population (Table 2) was students in first semester from six careers (two informatics careers, two business careers and two technical careers), the total size was of 214 (N). With a 99% confident level and 5% interval level the sample size must be 160. Stratus. Population Size. Sample Size. Surveys collected. ITC (Informatics). 44. 33. 36. ITE (Informatics). 35. 26. 29. IQS (Technical). 17. 12. 14. IME (Technical). 32. 24. 26. LEC (Business/Management). 42. 32. 34. LRI (Business/Management). 44. 33. 36. 214. 160. 175. TOTAL. Table 2. Population and Sample size. Survey Responses Students answer 36 questions about things they perceived as improving or reducing their rate of CWIS adoption. Eight questions were formulated in a positive form, asking about what things help them to accelerate their rate of CWIS adoption; the last eight questions were formulated in negative form, asking about what things decreased their rate of CWIS adoption. 32.
(53) Questions were about three topics: People’s characteristics: experience with others CWIS (EXP), type of student’s career (CARR), and self-experimentation with CWIS (AUTO). People’s relationships: Relationships with experienced CWIS users (REL), and usage importance given to the CWIS (IMP). People and CWIS relationships: quality of comments on CWIS usage (USO), quality of comments on CWIS technical support (TEC), and self-confidence degree on CWIS usage (CONF). Students used a Likert’s scale from 1 to 7 to answer, where 1 means “agree” and 7 “disagree”. The next synoptic table (Table 3) shows the results: Exp. Carr. Auto. Rel. Imp. Uso. Tec. Conf. Exp. Carr. Auto. Rel. Imp. Uso. Tec. Conf. P. P. P. P. P. P. P. P. N. N. N. N. N. N. N. N. 1. 112. 94. 120. 92. 99. 67. 60. 103. 2. 0. 0. 0. 0. 0. 0. 0. 2. 48. 56. 42. 60. 60. 64. 64. 62. 1. 1. 0. 0. 0. 3. 3. 0. 3. 10. 23. 13. 22. 10. 35. 44. 10. 1. 1. 0. 0. 2. 8. 0. 2. 4. 1. 1. 1. 1. 6. 4. 5. 1. 3. 3. 3. 5. 10. 8. 5. 11. 5. 2. 0. 0. 1. 1. 1. 0. 0. 10. 18. 11. 22. 13. 38. 29. 13. 6. 1. 2. 0. 0. 0. 5. 3. 0. 59. 57. 37. 51. 58. 53. 69. 49. 7. 2. 0. 0. 0. 0. 0. 0. 0. 100. 96. 125. 98. 93. 66. 70. 101. 176. 176. 176 176. 176. 176. 176. 176. 176. 176. 176. 176. 176. 176. 176. 176. Table 3. Results on rate of CWIS adoption. Answers from 4 to 7 were aggregated to value 3 to fall into positive form answers, and responses 1 to 4 were aggregated to value 5 in negative form answers to. 33.
(54) simplify the statistical analysis. After this aggregated action, data (Table 4) ends in this way. Exp. Carr. Auto. Rel. Imp. Uso. Tec. Conf. Exp. Carr. Auto. Rel. Imp. Uso. Tec. Conf. P. P. P. P. P. P. P. P. N. N. N. N. N. N. N. N. 1. 112. 94. 120. 92. 99. 67. 60. 103. 0. 0. 0. 0. 0. 0. 0. 0. 2. 48. 56. 42. 60. 60. 64. 64. 62. 0. 0. 0. 0. 0. 0. 0. 0. 3. 16. 26. 14. 24. 17. 45. 52. 11. 0. 0. 0. 0. 0. 0. 0. 0. 4. 0. 0. 0. 0. 0. 0. 0. 0. 0. 0. 0. 0. 0. 0. 0. 0. 5. 0. 0. 0. 0. 0. 0. 0. 0. 17. 23. 14. 27. 25. 57. 37. 26. 6. 0. 0. 0. 0. 0. 0. 0. 0. 59. 57. 37. 51. 58. 53. 69. 49. 7. 0. 0. 0. 0. 0. 0. 0. 0. 100. 96. 125. 98. 93. 66. 70. 101. 176. 176. 176 176. 176. 176. 176. 176. 176. 176. 176. 176. 176. 176. 176. 176. Table 4. Results on rate of CWIS adoption (simplified). 34.
(55) Sample demographics (Table 5) were labeled in this way: Siglas (Career ID). 1. ITC (Informatics: Bachelor in Computer Technology) ITE (Informatics: Bachelor in Electronic Technology). 2. IQS (Technical: Bachelor in Chemistry and Information Systems) IME (Technical: Bachelor in Electromechanics). 3. LEC (Business: Bachelor in Economy) LRI (Business: Bachelor in International Relationships) Table 5. Sample demographics. Siglas 1.00 2.00 3.00 36.93% n=65. 40.34% n=71. 22.73% n=40. Figure 3. Career ID. 35. Pies show counts.
(56) Edad (Age). 1. 18 or less. 2. 19 to 20. 3. 21 or older. Table 6. Age. 7.3 9% n=13. Edad 1 .00 2 .00 3 .00 36.93% n=6 5. 55.6 8% n=98. Figure 4. Age. 36. Pies show counts.
Figure

+7


Documento similar
This or- ganic approach to model peer-to-peer dynamics in Complex Adaptive Systems is what we have named ‘bacterial-based algorithms’ because agents exchange strategic information
When it comes to the representation of semantics (to describe content, user inter- ests, or user requests), ontologies provide a highly expressive ground for describing units
We present and evaluate our semantic profiling architecture in four ways: (1) the perfor- mance of the Tag Filtering and mapping to Wikipedia entries, (2) the difference between
In [15], a framework to semi-automate the semantic annotation of Web services (i.e. parameter description based on ontology concepts, semantic service classification, etc.)
Following this work, this thesis shows that it is possible to solve non-trivial tasks with both theoretical and practical interest (for example, the design of a curve with a
In that case, the adjustment can be done in terms of power consumption, by measuring both chip input current and sensor output frequency during the normal operation of a
Expanding our earlier work, we compared two approaches for implementation of adaptive navigation support in e-learning systems (a dedicated interface and an
Given a set of service de- scriptions, already classified under some classification taxonomy, and a new service description, we propose a heuristic for automated
