DOI:10.1051/0004-6361/201527806 c
ESO 2016
Astronomy
&
Astrophysics
Comparing the properties of the X-shaped bulges of NGC 4710
and the Milky Way with MUSE
?
O. A. Gonzalez
1,2, D. A. Gadotti
1, V. P. Debattista
3, M. Rejkuba
4,5, E. Valenti
4, M. Zoccali
6,8, L. Coccato
4,
D. Minniti
7,8,9, and M. Ness
101 European Southern Observatory, Ave. Alonso de Cordova 3107, Casilla 19, 19001 Santiago, Chile
e-mail:ogonzale@eso.org
2 Institute for Astronomy, University of Edinburgh, Royal Observatory, Blackford Hill, Edinburgh, EH9 3HJ, UK 3 Jeremiah Horrocks Institute, University of Central Lancashire, Preston PR1 2HE, UK
4 European Southern Observatory, Karl-Schwarzschild Strasse 2, 85748 Garching, Germany 5 Excellence Cluster Universe, Boltzmannstr. 2, 85748 Garching, Germany
6 Instituto de Astrofísica, Facultad de Física, Pontificia Universidad Católica de Chile, Av. Vicuña Mackenna 4860, Santiago 22,
Chile
7 Departamento de Ciencias Físicas, Universidad Andrés Bello, República 220, Santiago, Chile 8 The Milky Way Millennium Nucleus, Av. Vicuña Mackenna 4860, 782-0436 Macul, Santiago, Chile 9 Vatican Observatory, V00120 Vatican City State, Italy
10 Max-Planck-Institut fur Astronomie, Konigstuhl 17, 69117 Heidelberg, Germany
Received 22 November 2015/Accepted 8 March 2016
ABSTRACT
Context.Our view of the structure of the Milky Way and, in particular, its bulge is obscured by the intervening stars, dust, and gas in the disc. While great progress in understanding the bulge has been achieved with past and ongoing observations, the comparison of its global chemodynamical properties with respect to those of bulges seen in external galaxies has yet to be accomplished.
Aims.We used the Multi Unit Spectroscopic Explorer (MUSE) instrument installed on the Very Large Telescope (VLT) to obtain spectral and imaging coverage of NGC 4710. The wide area and excellent sampling of the MUSE integral field spectrograph allows us to investigate the dynamical properties of the X-shaped bulge of NGC 4710 and compare it with the properties of the X-shaped bulge of the Milky Way.
Methods.We measured the radial velocities, velocity dispersion, and stellar populations using a penalised pixel full spectral fitting technique adopting simple stellar populations models, on a 10×
10
area centred on the bulge of NGC 4710. We constructed the velocity maps of the bulge of NGC 4710 and investigated the presence of vertical metallicity gradients. These properties were compared to those of the Milky Way bulge and to a simulated galaxy with a boxy-peanut bulge.
Results.We find the line-of-sight velocity maps and 1D rotation curves of the bulge of NGC 4710 to be remarkably similar to those of the Milky Way bulge. Some specific differences that were identified are in good agreement with the expectations from variations in the bar orientation angle. The bulge of NGC 4710 has a boxy-peanut morphology with a pronounced X-shape, showing no indication of any additional spheroidally distributed bulge population, in which we measure a vertical metallicity gradient of 0.35 dex/kpc. Conclusions.The general properties of NGC 4710 are very similar to those observed in the Milky Way bulge. However, it has been suggested that the Milky Way bulge has an additional component that is comprised of the oldest, most metal-poor stars, which is not part of the boxy-peanut bulge structure. Such a population is not observed in NGC 4710, but could be hidden in the integrated light we observed.
Key words. galaxies: bulges – galaxies: individual: NGC 4710 – galaxies: kinematics and dynamics – Galaxy: bulge
1. Introduction
The understanding of galactic bulges is a basic step to unveiling the formation history and evolution of galaxies. By mapping the kinematics, stellar population, and morphological signatures of the bulge of a given galaxy, it is possible to constrain the history of events that occurred during the assembly of the galaxy.
Bulges are generally classified into three distinct groups: I) classical bulges, which are spheroidal components dominated by velocity dispersion of old, alpha-enhanced stars as expected from a fast and early formation via dissipative collapse or merg-ers (e.g. Brooks & Christensen 2016, and references therein);
? Based on observations collected at the ESO La Silla-Paranal
Observatory within MUSE science verification program 60.A-9307(A).
II) pseudo-bulges, which are disc-like, rotation dominated struc-tures populated by young, metal-rich stars, formed from the in-flow of gas to the centre of the galaxy due to the influence of a bar (Kormendy 2013); and III) boxy-peanut (BP) bulges which are the result of buckling bar instabilities that favour the heating of the stellar orbits along the vertical direction resulting in a thick structure that swells up from the disc in a peanut or X-shape1 (e.g.Combes & Sanders 1981;Athanassoula 2005). Common in disk galaxies, BP bulges are found in nearly half of the edge-on
1 We note that whether these structures appear boxy, peanut or
disc galaxies, with a fraction missed due to unfavourable orien-tation (Lütticke et al. 2000). Even our own Galaxy has recently been proven to host one (Wegg & Gerhard 2013, and references therein). However, the stellar population properties of BP bulges have not yet been entirely defined, mostly because of the diffi cul-ties of disentangling the different bulge components in the anal-ysed samples. As recently pointed out by Laurikainen & Salo (2016), dedicated studies of individual galaxies, where both the structural decomposition and stellar population analysis can be performed, is fundamental to characterise the properties of BP bulges.
In the Milky Way, the presence of a bar in the inner re-gions is now well established (Stanek et al. 1994) and its boxy shape has been mapped by different IR surveys such as the COs-mic Background Explorer (COBE), Two Micron All-Sky Sur-vey (2MASS), and most recently the VISTA Variables in the Via Lactea (VVV) ESO public survey (Minniti et al. 2010). The ra-dial velocity measurements from spectroscopic surveys, based on hundreds of velocities of M-giants in the Bulge Radial Veloc-ity Assay (BRAVA;Howard et al. 2009) and K-giants in Giraffe Inner bulge Survey (GIBS; Zoccali et al. 2014), have provided strong evidence for cylindrical rotation, which is the expected kinematical signature of rotating bars (but see Williams et al. 2011). Furthermore, following the boxy shape of the Galactic bar mapped by COBE and 2MASS, the analysis of the distribu-tion of red clump stars from different datasets has provided in-dependent evidence for the X-shaped morphology of the Milky Way (Nataf et al. 2010;McWilliam & Zoccali 2010;Saito et al. 2011). Recently,Wegg & Gerhard(2013) used photometric data from the VVV survey to map the X-shaped bulge in detail, thus reaffirming the BP nature of the Galactic bulge. Recent stel-lar population studies have revealed a dominating old (10 Gyr) α-enhanced population and the presence of a radial metal-licity gradient (e.g. Zoccali et al. 2003; Gonzalez et al. 2013; Valenti et al. 2013). The presence of young (<5 Gyr), metal-rich stars, particularly at low latitudes, has also been discussed (Bensby et al. 2013;Ness et al. 2014;Dékány et al. 2015). It has been suggested that the observed spatial distribution of [Fe/H], [α/Fe], and possibly also stellar ages in the Galactic bulge, could be the result of a contribution of different components dominat-ing at different distances from the Galactic plane, namely the BP bulge and a classical bulge (Babusiaux et al. 2010;Hill et al. 2011;Dékány et al. 2013).
Large new datasets are therefore providing new observa-tional insights into the bulge of our Galaxy. However, a de-composition of the different components of the Milky Way bulge is highly complicated by our location in the disc of the Galaxy as well as a combination of effects due to extinction (Gonzalez et al. 2012), line-of-sight depth and bar orientation (Wegg & Gerhard 2013), and the overall geometry and kine-matics of different overlapping Galactic components. It is then left to a reconstruction method, based on the interpretation of the different sets of observations described above. Image de-composition, on the other hand, can be used to study the dif-ferent bulge components of other galaxies (e.g. Gadotti 2012; Laurikainen et al. 2005,2010;Méndez-Abreu et al. 2014). It is for this reason that it becomes fundamental to provide a link be-tween the techniques used in the study of the unresolved stellar properties of external galaxies and those used in the Milky Way (seeGonzalez & Gadotti 2016, for a recent review on this mat-ter). In this context, NGC 4710 appears as an ideal candidate to test the interpretations of the Milky Way bulge observations.
According to NED and HyperLeda databases, NGC 4710 is an edge-on, early-type (S0 or SA(r)0) galaxy in the nearby
universe. It is located in the Virgo cluster and is included in the ATLAS3D sample of 260 early-type (E and S0) galaxies.
NGC 4710 is unusually gas rich, has the second highest av-erage CO surface density (Young et al. 2011), and is one of the two galaxies most significantly affected by dust extinc-tion in the sample ofScott et al.(2013).Krajnovi´c et al.(2013) list this galaxy among a sample of 13 “uncertain” galaxies in the early-type ATLAS3Dsample given the strong dust features in the nucleus and uncertain nuclear profile fits. The ionised, molecular gas and stellar kinematics of NGC 4710 are aligned (Davis et al. 2011) and its stellar Vrms =
√
V2+σ2 shows a
butterfly-like shape characteristic of galaxies with small bulges (Cappellari et al. 2013).
NGC 4710 can be found among the galaxies sampled by the SpitzerSurvey of Stellar Structure in Galaxies (S4G) and the re-cent morphological analysis ofButa et al.(2015) classified this galaxy as an exactly edge-on barred galaxy with a X-shaped bulge and visible ansae on each side of the centre. Furthermore, no co-existing, large-scale classical bulge component has been found based on its light-decomposition analysis (Gadotti 2012). Based on the fact that both the Milky Way and NGC 4710 have a BP bulge, it is possible to build a link between the studies of resolved and unresolved properties of stellar populations of this type of bulges, thus bringing to a common ground our de-tailed knowledge of the Milky Way bulge and that of unresolved external galaxies. With this aim, in this article we investigate the kinematics and stellar populations of the BP bulge of NGC 4710 and we compare them directly to those of the Milky Way bulge. This comparison becomes particularly important when consider-ing the recent study byDékány et al.(2013), which suggest that the spatial distribution of the oldest population of the Milky Way bulge, traced by RR Lyrae stars, follows a spheroidal component and possibly co-exists with the BP bulge of the Milky Way (but see also Pietrukowicz et al. 2015). Therefore, we can also ex-plore the presence of any specific signature that is not found in the pure BP bulge of NGC 4710, which can therefore be identi-fied as an additional component in the bulge of the Milky Way.
2. Observations and data reduction
The observations of NGC 4710 were taken as part of the MUSE science verification observing run in June 2014. MUSE (Bacon et al. 2010) is an optical wide-field integral field spectro-graph installed in UT4 at the ESO Very Large Telescope. This instrument uses the image slicing technique to cover a field of view (FOV) of 10×10in wide-field mode (WFM) resulting in a sampling of 0.200×0.200 spaxels (equivalent to 0.016 kpc at a
distance of 16.9 Mpc for NGC 4710). The full field is split up into 24 subfields (each 2.500 ×6000 in WFM) that are fed into
one of the 24 integral field units (IFUs) of the instrument. In addition, MUSE covers an impressive wavelength range from 4650 Å to 9300 Å at a spectral resolution ofR∼2000 at 4600 Å andR∼4000 at 9300 Å.
We observed the bulge of NGC 4710 using MUSE with-out adaptive optics at the nominal wavelength range. The cen-tral coordinates of the observed field (α = 12h49m37.9s,δ =
+15◦10000.800, J2000) had an offset with respect to the centre of the galaxy to avoid contamination from a bright star in the FOV. This configuration allowed us to cover the inner 1500of the X-shape bulge and to extend the coverage to the expected limit of the bulge at the NW side of the galaxy.
10”
E N
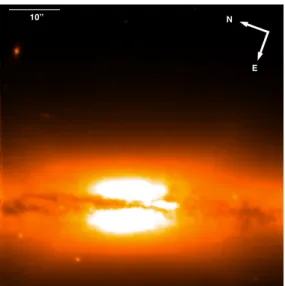
Fig. 1.Reconstructed image of the MUSE cube resulting from the co-addition of four individual exposures mapping the bulge of NGC 4710. The bar in the upper left panel indicates a scale of 1000
.
surveys provided a large set of homogeneously analysed galax-ies, the larger FOV and spatial resolution of MUSE allows for a superior, detailed analysis of the kinematical signatures present in a single galaxy. In this case, the MUSE dataset is superior both with respect to the spatial coverage that allows us to trace the BP bulge to the external regions of NGC 4710 and a spatial resolution of 0.200in the inner regions.
A total of four exposures of 600s were obtained, each of which was followed by a sky exposure obtained in an offset field (α =12h49m48.5s,δ = +15◦06032.100, J2000). We adopted an exposure time of 180 s for the sky exposures. We iterated be-tween two rotator angle positions of −28.8◦ and 90◦−28.8◦ = 61.2◦between each integration. Figure1shows the reconstructed
image of the MUSE cube; the BP bulge of NGC 4710 is clearly visible.
The data were reduced using the MUSE pipeline (v1.0) and using the legacy static calibrations provided by ESO for science observed during science verification runs. The reduction process of the individual scientific exposures was performed executing the specifically designed MUSE pipeline recipes. The final dat-acube analysed here corresponds to the combined outcome of the four individual observations. Sky subtraction was performed using our dedicated sky observations with the subtract-model method and a sky fraction of 85% to account for possible con-tamination from the foreground and faint halo of NGC 4710, which could still be present in our offset field. Astrometric cal-ibrations were calculated by the pipeline using the static cali-bration database. We performed telluric correction and flux nor-malisation via observations of standard star GD153 observed by the MUSE-SV team immediately before the start of our obser-vations. For the present study, we only focused on the spectral region between 4750–6100 Å and for this reason the pipeline reduction procedure was restricted to this region. This limited wavelength coverage facilitated the complicated sky subtrac-tion and telluric correcsubtrac-tion arising when reducing the complete MUSE wavelength region.
Once the final cube was constructed, the next step was to use the Voronoi binning method ofCappellari & Copin(2003) to spatially bin the cube to maximise the spatial resolution while providing a minimum signal-to-noise (S/N) ratio of 50 in each spatial bin. Setting this S/N limit allows for a proper analysis of
Fig. 2.Example spectrum of NGC 4710 corresponding to one bin re-sulting from the Voronoi binning with signal-to-noise 50 (black line). The spectral region shown corresponds to the spectral region used on the penalised pixel fitting. A template spectrum from theVazdekis et al.
(2010) library is also included as a reference (red line).
the stellar kinematics of the bulge of NGC 4710 to be carried with confidence in our entire FOV. Figure2shows an example of the spectra corresponding to one spatial bin of the resulting MUSE cube.
We carried out the kinematic analysis of the resulting spec-tra in each spatial bin using the penalised pixel fitting (pPXF) routines in IDL developed by Cappellari & Emsellem (2004). We used the Single Stellar Population library ofVazdekis et al. (2010) as reference. This template library has the same resolu-tion as the analysed spectral range covered by MUSE (FWHM∼
Fig. 3.Left panel: intensity map of our NGC 4710 MUSE field.Middle and right panels: LOS velocity and velocity dispersion maps, respectively. Each map has the corresponding isophotes overplotted, spaced by one magnitude. The table with LOS velocities is available for download at
http://www.oagonzalez.net/data.html
3. Structural components in NGC 4710
In order to correctly interpret the rotation and velocity dispersion maps, it is crucial to understand the structural composition of the sampled region of NGC 4710. With this approach, we know which component (or components) dominates the spectra in each region. We thus refer to the analysis of Gadotti (2012) where a decomposition of NGC 4710 was performed using BUDDA (de Souza et al. 2004; Gadotti 2008) to decompose the i-band image of NGC 4710 obtained from the Sloan Digital Sky Survey (SDSS) into different structural components.
Figure3shows the best-fit light profile for NGC 4710 from Gadotti(2012). The best model for NGC 4710 includes a ver-tically extended bar structure. On the other hand, the best-fit model includes a small structure with a Sérsic index of 0.7 that contributes only with a very minor fraction, 0.1%, to the total luminosity of the galaxy. Its near-exponential light profile sug-gests an origin that is connected to the main exponential disc, so it is likely to be a structural component built from disc mate-rial. Figure3shows the residual image after the BUDDA model subtraction. The clear X-shape obtained in the residual image strongly corroborates that the bulge of NGC 4710 belongs to the family of BP bulges.
In addition, the residual image in Fig.3also shows clearly a few substructures that may be associated with the bar. Firstly, as seen inGadotti(2012), beyond the dust lane, at each side of the centre, a narrow excess of light indicates the presence of a den-sity enhancement in the disc that could be the bar ansae, spiral arms, or a ring. These structures appear to be common in edge-on galaxies with BP bulges (e.g.Bureau et al. 2006), and in simu-lations of barred galaxies when viewed at an edge-on projection (e.g.Laurikainen & Salo 2016).
Secondly, in the central∼500 of the residual image one
no-tices a small structure that sticks out prominently from the disc plane (although it is still significantly less extended that the BP bulge in the vertical direction). This structure has a pronounced boxy shape, which hints at it being associated with the large-scale BP. Although the model fitted has a component that ac-counts for the BP, this model is designed to account for its av-erage light distribution, so deviations from the avav-erage stand out in the residual image. That would be the case if the central light distribution exceeds what is expected in the global BP model,
hence producing the observed residual image. To test whether this central structure is just part of the BP, similar to the X-shape residual component, we performed a structural analysis using BUDDA on a snapshot of the galaxy simulation of Cole et al. (2014); the same type of analysis that was performed with the SDSS image of NGC 4710. The simulation contains only a disc and bar (plus BP) components, and the snapshot was convolved with a circular Gaussian function to mimic PSF effects. The Gaussian FWHM was chosen to reproduce the same relative PSF as in the SDSS image of NGC 4710. As found for NGC 4710, the best BUDDA model essentially contains only a disc and a bar component. The residual image derived from this fit is shown on the lower right of Fig.3. One clearly sees both the large-scale X-shape residual component and a central smaller structure that is very similar to that found in the residual image of NGC 4710. However, in this case, the central structure is most likely asso-ciated with the BP, as indicated by the conspicuous X-shape it has. We conjecture that the corresponding X-shape of the cen-tral structure is not entirely discernible in the residual image of NGC 4710 because of a combination of projection effects and spatial resolution of the SDSS image. If the galaxy is not seen at a perfect side-on projection the smaller, innermost X-shape structure may appear only as boxy.
Thus, in the case of NGC 4710, the structural analysis in-dicates that our kinematic study traces the dynamical signatures dominated by the disc and bar, in the regions near the plane of the galaxy, and that of the associated BP bulge at increasing height.
4. Kinematic maps of NGC 4710
Fig. 4.Left panel: intensity map of our NGC 4710 MUSE field.Middle and right panels: velocity dispersion and LOS velocity maps, respectively. Each map has the corresponding isophotes overplotted, spaced by one magnitude. The table with LOS velocities is available for download at
http://oagonzalez.net/data.html
and implemented in the IDL routine FIT_KINEMATIC_PA by M. Capellari.
The LOS velocity map shows the signatures of cylindrical rotation, as expected for a BP bulge, which is consistent with the photometric analysis of NGC 4710. In theory, a bulge ro-tating perfectly cylindrically would have a mean LOS velocity, at a given distance from the centre, which is independent of its height above the plane (Saha & Gerhard 2013). A very useful criteria to quantify the deviations from pure cylindrical rotation was provided by Eq. (2) ofSaha & Gerhard(2013) as follows:
δCL(z,Xj)=
RXj
0 Σlos(x,z)Vlos(x,zi)x 2dx
Vlos(Rb,1/2,z'0)
RXj
0 Σlos(x,z)x 2dx
, (1)
whereΣlos(x,z) is the surface density,Vlos(x,z) is the LOS
ve-locity,Xjis the projected distance from the minor axis for a slit
at a height z = zi, and Vlos(Rb,1/2,z ' 0) is the velocity at the
bulge half-mass radius close to the disc mid-plane. We then fit a straight line to the (δCL,z) curve and derive the slope of this
relationmCL.Saha & Gerhard(2013) then defines the degree of
cylindrical rotation in the BP bulge as δn
CL(Xj)=1+mCL, (2)
so that a value ofδn
CL =1 corresponds to perfect cylindrical
ro-tation while values ofδn
CL <0.75 correspond to non-cylindrical
rotation.
We applied this equation to our NGC 4710 dataset measur-ing the surface density and LOS velocity across fixed heights from the plane. Within the half-mass bulge radius of NGC 4710, which corresponds toRb,1/2 =1.35Re=1000(whereRe=7.400,
Gadotti 2012), we obtain a value of δnCL = 0.9. The slight de-viation from cylindrical rotation seen in NGC 4710 could be a consequence of either the presence of a rotating classical bulge or the effect of the bar, and associated BP, orientation angle. Fol-lowing the structural decomposition of NGC 4710 of Gadotti (2012), the presence of a classical bulge in this galaxy can be safely discarded and thus the deviation from cylindrical rotation is likely to be the result of the position angle of the bar. The impact of the bar viewing angle in the measured rotation of the
associated BP bulge was discussed inCombes et al.(1990) and Athanassoula & Misiriotis(2002) and was recently investigated in detail by Iannuzzi & Athanassoula (2015); these results are consistent with the very small deviation from cylindrical rota-tion we see in the BP bulge of NGC 4710.
The general behaviour of the maps is in good agree-ment with the expectations from N-body models presented in Iannuzzi & Athanassoula (2015) for edge-on galaxies hosting BP bulges. The velocity dispersion increases noticeably towards the inner regions of the BP bulge. We note that the velocity dis-persion map shows an asymmetric profile with a higher velocity dispersion towards the north-east side of the galaxy. This most likely is the consequence of the disc of NGC 4710 not being perfectly edge-on.
Additionally, we note a very bright spot-like region located in the disc plane of NGC 4710, which is clearly seen in Fig.4 at (X,Y)=(400,−600). This brighter region could be the result of
a dust-free patch in the disc that might allow us to see deeper through the disc up to the inner regions of the bulge. However, the radial velocity map shows a peak in mean velocity for this region, which can be interpreted as a signature of this region be-ing located in the near side of the disc. Furthermore, the spectra show an increase of emission lines in this region, suggesting that this is a gas-rich region in the disc.
5. Stellar populations in the bulge of NGC 4710
expected for any given component, depending on the character-istics of the processes involved. For example, a wide range of stellar ages can be found even among BP bulges. Stellar bars in massive galaxies, such as those found in NGC 4710 and in the Milky Way, are expected to have already formed at redshift∼1 (Sheth et al. 2012) or earlier (Simmons et al. 2014;Gadotti et al. 2015). The buckling instability of bars, and thus the formation of the BP bulge, can take place on very short timescales (∼1 Gyr, Athanassoula 2008), opening the possibility of having mostly old stellar ages in BP structures. On the other hand, a fraction of younger stars can still be present in BP bulges, provided that star formation has continued in the disc, within the radius at which the bar ends so that these younger stars can be captured by the bar potential. As a consequence, this young population of stars would be expected to be predominantly near the plane (Ness et al. 2014;Dékány et al. 2015).
In this context, NGC 4710, which hosts only a pure BP bulge, is an excellent laboratory to investigate the stellar population properties that can be found in such structures directly. With this aim, we used the full-spectrum fitting capabilities of pPXF2 (Cappellari & Emsellem 2004) to investigate the distribution of the mass fraction in the bulge of NGC 4710 in terms of age and metallicity. A grid of 156 MILES model spectra from Vazdekis et al.(2010; 26 ages, 6 [M/H]) was used in pPXF to obtain a best-fit spectrum for five representative regions of the bulge. pPXF searches for an optimal solution that is based on the weights applied to each template spectrum in the age-metallicity grid using a regularisation parameter. The regularisation con-strains the solution in such a way that the weights assigned to neighbouring age and metallicity templates changes smoothly while being consistent with the observed spectrum. The final representative stellar population of the observed integrated spec-trum is then obtained by calculating a weighted average of the metallicities and ages of the grid using the weights calculated by pPXF. We found that these average values have a negligi-ble sensitivity to the selected regularisation parameter. Thus, we used the default regularisation parameter of 250, which corre-sponds to a parametrisation error that is consistent with the typ-ical weights assigned to the templates.
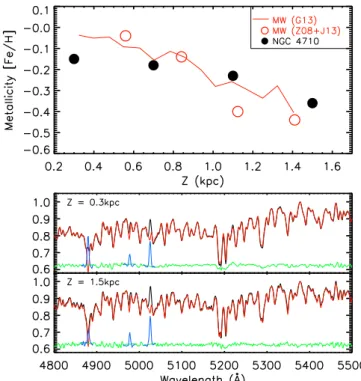
We applied the spectral fitting procedure to the integrated spectra of four fields located along the minor axis of the BP bulge of NGC 4710, specifically at heights from the plane of 0.3, 0.7, 1.1, and 1.5 kpc and derived its dominant age and metallicity. All four fields appear to be consistently dominated by a relatively old population (>5 Gyr) with a mean age of ∼9 Gyr. On the other hand, metallicity decreases as a function of height from the plane of the galaxy. Figure 5 shows the metallicity of the bulge of NGC 4710 in each field compared to the value of the Milky Way bulge at an equivalent height from the plane. As a reference for the minor axis of the Milky Way bulge, we use the photometric metallicity maps ofGonzalez et al.(2013) and the spectroscopic measurements fromZoccali et al.(2008) and Johnson et al.(2013).
The stellar population analysis of the BP bulge of NGC 4710, shown in Fig.5, suggests a scenario where NGC 4710 has rel-atively old stellar ages and a vertical metallicity gradient com-parable to that in the bulge of the Milky Way. The metallicity gradient in the bulge of NGC 4710 is an important observational confirmation of vertical gradients reproduced in the simulations
2 See http://www-astro.physics.ox.ac.uk/~mxc/software/
for a detailed description of pPXF and the implementation of regulari-sation when assigning weights to the library templates when performing the penalised fitting procedure.
Fig. 5.Stellar population solution of pPXF from the full spectral fitting procedure in four regions along the minor axis of NGC 4710. Theupper
panelshows the mean metallicity of the bulge of NGC 4710 at different
distances from the plane (Z) indicated with black filled circles. Mean metallicity measurements for the bulge of the Milky Way are overplot-ted. The photometric measurements from Gonzalez et al. (2013) are shown with red solid lines, while the spectroscopic measurements from Zoccali et al. (2008) and Johnson et al. (2013) are indicated with empty red circles. Thetwo lower panelsshow the observed (black solid line) and best-fit spectrum (red solid line) of the inner and outermost regions of the bulge of NGC 4710, the masked emission line regions (blue solid lines), and the fitting residuals (green).
of pure BP bulges seen edge-on (Bekki & Tsujimoto 2011; Martinez-Valpuesta & Gerhard 2013). The exact value of the gradient must be taken with caution as the innermost field is probably affected by a significant contribution of disc stars. However, we note that the scale height of the disc component in the BUDDA model light decomposition of NGC 4710 is
∼0.8 kpc (10.300 at 16.9 Mpc). Therefore, the disc contamina-tion is expected to be negligible at the heights of the two fields at 1.1 and 1.6 kpc from the plane where a variation in metallicity of 0.14 dex is observed. Detailed maps of [Fe/H],α-element, and stellar ages based on the measurement of line-strength indices, are the subject of a dedicated study (Gonzalez et al., in prep.).
6. Comparison of the bulge of NGC 4710 and the Milky Way
of red clump giant stars (Zoccali 2010;McWilliam et al. 2010; McWilliam & Zoccali 2010;Nataf et al. 2010;Saito et al. 2011; Wegg & Gerhard 2013). Such a detailed star-by-star reconstruc-tion of the properties of the bulge are only possible in the Milky Way. Understanding bulges in external galaxies requires com-bining the interpretation of properties obtained from different techniques, such as image decomposition and spatially resolved kinematics. Thus, providing a link between techniques used in external galaxies and in the Milky Way is of great importance.
Zoccali et al.(2014) derived radial velocities for a sample of 6390 bulge red-clump stars from the GIBS survey. They con-structed rotation curves at four different latitudes (b=−2◦,−4◦, −6◦, and−8◦) and interpolated between their fields to obtain the first rotation and velocity dispersion maps of the Milky Way bulge. We can use our maps of NGC 4710, where the entire kinematics could be measured directly, to compare to those of Zoccali et al.(2014). We thus transformed the radial velocity and velocity dispersion maps of NGC 4710 into a reference frame that is comparable to that of the Galactic bulge as seen from the Sun. We first transformed the photometric centre of NGC 4710 (α=12h49m38.8s,δ = +15◦09056.900;Gadotti 2012) to pixels
using the astrometrical solution of our MUSE reconstructed im-age. The centre of NGC 4710 is found in our image at pixel po-sitionsx=141,y=189. We used these pixel values as the new reference centre and further applied a rotation of 64◦to obtain a new reference frame (x0, y0) centred on NGC 4710, where the
po-sition angle of the major axis of the galaxy is zero. On the other hand, the pixel scale of MUSE of 0.200/pix indicates that each
pixel in our map would be equivalent to 0.016 kpc at the distance of NGC 4710 (16.9 Mpc). In the Milky Way, the bulge is located at approximately 8 kpc from the Sun, such that an angular size of 1 deg corresponds to 0.139 kpc. Thus, if the bulge of NGC 4710 were located at 8 kpc from the Sun, each resolving element of our maps would have 0.016/0.139 = 0.11 deg/pix. Applying this new scale, we constructed new maps for NGC 4710 in a reference frame that can be compared directly to the Galactic coordinate system of the Milky Way.
We also included in this comparison the corresponding kine-matic maps for the BP bulge of the simulation of Cole et al. (2014; see Fig.1and Sect. 3). We applied a scaling factor of 1.2 to the model coordinates to scale its bar size ofRbar =2.9 kpc
to the bar size of the Milky Way3, as described in Ness et al. (2014). For comparison purposes, the corresponding radial ve-locities and velocity dispersions have also been normalised so that the maximum radial velocity of all the bulges is comparable to that of NGC 4710 by applying a scaling factor of 0.48 to the velocities of the model and of 0.77 to the velocities measured for the Milky Way byZoccali et al.(2014). Such spatial and ve-locity scaling transformations changes the reference systems but have no effect on the rotational patterns we aim to investigate.
This simple exercise allows us to visually compare the kine-matical patterns of NGC 4710 with those of the Milky Way ob-tained via the different Milky Way surveys. The position angle of the bar of NGC 4710 with respect to our LOS must be much closer to a side-on projection than for the case of the Milky Way, as suggested by the direct detection of the pronounced X-shaped bulge. This gives us the chance to investigate the effects of the bar orientation angle in the kinematic maps of the Milky Way bulge fromZoccali et al.(2014).
3 We note that the length of the Milky Way bar has been measured to be
4.4 kpc in the Galactic plane. However, since here we are scaling the in-ner parts of the bar that form the BP bulge, we use the length of 3.5 kpc measured at larger distances from the Galactic plane (Wegg et al. 2015).
We can immediately see a similarity between the LOS ve-locity map of the bulge of NGC 4710 and that of the Milky Way in Fig.6. This is particularly true when considering that the apparent higher smoothness of the velocity dispersion map for the Milky Way, presented in Zoccali+14, with respect to that NGC 4710 is a natural consequence of the different adopted techniques. For the Milky Way case, the map was obtained in-terpolating between the GIBS fields grid. In addition, it can be seen that the central peak in velocity dispersion that is found in the central region of the Milky Way bulge map is not seen with the same concentration and vertical elongation in the maps of NGC 4710. As already pointed out by Zoccali+14, while the presence of the central sigma peak is strongly supported by ac-curate velocity measurements of a large and statistically robust sample (450 individual stars), the extension of the peak is how-ever poorly constrained because of the presence of only two fields in that region. Similar changes in the central velocity dis-persion profiles are among the features identified in the LOS kinematics maps of Iannuzzi & Athanassoula (2015) and they are attributed to the effect of bar position angle. We see a similar change in the velocity dispersion maps constructed using diff er-ent bar orier-entation angles in the simulation. Figure6shows how the σ map of the simulated BP bulge becomes less vertically elongated when seen at (or close to) side-on projection, which is the case of NGC 4710. However, in this case the elongated central feature is not as pronounced as seen in the velocity dis-persion map of the Milky Way bulge.
We now look at the 1D LOS velocity and velocity dispersion profiles. In particular, we investigate their variations as a func-tion of height to compare the velocity dispersion of the inner-most fields of the Milky Way and NGC 4710 in a more quantita-tive way. To make this comparison, we scaled the (x0, y0) spatial coordinates of NGC 4710 by a factor 0.88 corresponding to the ratio between the bar sizes of the Milky WayRbar=3.5 kpc and
NGC 4710 ofRbar = 3.9 kpc. With these transformations, we
have all three datasets spatially scaled to the bulge of the Milky Way. The velocity profiles for NGC 4710 are then constructed at the four Milky Way heights presented inZoccali et al.(2014), i.e.ZMW =0.28, 0.56, 0.83, 1.12 kpc, which they used to
inter-polate the velocity maps. The 1D rotation and velocity disper-sion profiles shown in Fig.7 for the corresponding heights in NGC 4710 have a remarkable similarity to those of the Milky Way bulge and the differences seen between the inner regions of theσmaps of the Milky Way and NGC 4710 are not as ev-ident in the 1D curves. This suggests that the vertical elonga-tion observed in central region of theσmap of the Milky Way bulge might not be real, as suggested byZoccali et al.(2014). Instead this elongation it is an artefact from the plane interpola-tion method when including theσpeak observed atb =−2. In this case, theσpeak in the Milky Way bulge would be limited to Galactic latitudes|b| < 2 (∼0.28 kpc). This is also in good agreement with the conclusions of Valenti et al.(2016), where the high stellar density peak of the central Milky Way bulge closely follows a more axisymmetricσpeak than that presented in the GIBS velocity dispersion maps.
Fig. 6.Two upper left panels: LOS velocity and velocity dispersion maps of NGC 4710 projected and oriented as the Milky Way bulge is seen from the Sun.Two lower left panels: corresponding LOS velocity and velocity dispersion maps for the Milky Way bulge constructed evaluating each spatial resolution element of our NGC 4710 maps in Eqs. (1) and (2) inZoccali et al.(2014).Right side panels: corresponding velocity maps for the simulation ofCole et al.(2014) for bar orientation angles of 80◦
(upper panels) and 20◦
(lower panels).
when the bar has a non-zero position angle with respect to the Sun-Galactic centre LOS and should not be immediately inter-preted as evidence for the need of an additional component to reproduce the observed rotation curves. Indeed, the light decom-position of NGC 4710 itself and the very minor deviation from cylindrical rotation found in the previous section show no evi-dence for an additional bulge component besides the BP bulge. Furthermore, the pure-disc N-body models of bars that have been used to evaluate the rotation curves of the bulge show the same behaviour without the need to include a classical bulge component (Shen et al. 2010;Zoccali et al. 2014). Thus, the fact that the rotation curve of the bulge of NGC 4710 and the Milky Way are so similar suggests that both of them are dominated by a similar BP bulge structure. This is strongly supported by the detection of a vertical metallicity gradient along the BP bulge of NGC 4710 that is comparable to the metallicity gradient mea-sured in the Milky Way bulge.
The existence of a spheroidal bulge component in the Milky Way in addition to the BP bulge, has been suggested based on the distance distribution of RR Lyrae (Dékány et al. 2013), the bi-modality in the metallicity distribution (Hill et al. 2011), and the different kinematics seen in metal-poor and metal-rich bulge stars (Babusiaux et al. 2010). Furthermore, Ness et al. (2014), Vásquez et al. (2013), andRojas-Arriagada et al. (2014) found evidence for the X-shape bulge of the Milky Way to be only traced by the metal-rich bulge stars. The properties of the bulge of the Milky Way are in general investigated by selecting red-clump stars from the colour-magnitude diagram at a given LOS. Metallicity and kinematics are then obtained individually from the spectra of each red-clump star and used to construct the total metallicity distribution. If the metal-poor component, which shows different kinematics (and spatial distribution), is much
less significant in number compared to the dominant stars in the BP, then the integrated light properties could be dominated by the BP component and would not be detectable in the integrated spectrum. This highlights the importance of understanding the detailed properties of the Milky Way bulge, where kinematics and chemical abundances can be investigated on a star-by-star basis, which is perhaps hidden in the integrated light of external galaxies. The origin of the apparent different properties between metal-poor and metal-rich stars in the Milky Way bulge, i.e. the presence of a classical bulge, remains to be fully understood. From our results we see that the integrated light of the bulge of NGC 4710, which is dominated by a BP component, is consis-tent with the dominant structure, kinematics, vertical metallicity gradient, and stellar ages of the Milky Way bulge.
7. Summary and conclusions
In this study we investigated the properties of the bulge of the edge-on galaxy NGC 4710 using MUSE spectra. The bulge of this galaxy shows a strong X-shape profile. A light-decomposition study provides no evidence for the presence of a classical bulge in the inner regions of NGC 4710, showing in-stead that the integrated light from this galaxy is dominated by a bar and the associated BP bulge out of the plane of the disc.
We constructed the LOS velocity and velocity dispersion maps of the bulge, finding that the bulge rotates cylindrically, with aδn
CL =0.9, based on the definition from (Saha & Gerhard
2013) where a value ofδnCL =1 corresponding to a bulge with perfect cylindrical rotation and values of δn
CL < 0.75 define
Fig. 7.Filled circles joined by solid lines show the mean LOS velocity and velocity dispersion curves of NGC 4710 at four heights from the plane
Z =0.28, 0.56 , 0.83, and 1.12 kpc. Dashed lines show the corresponding rotation curves of the Milky Way bulge fromZoccali et al.(2014;left
panels) and of a disc galaxy simulation fromCole et al.(2014;right panels). Spatial coordinates of NGC 4710 and the simulation were scaled to
match the Milky Way bulge bar scale length (Rbar=3.5 kpc). The mean velocities and velocity dispersion of NGC 4710 and the simulation were
obtained in bins of 0.2 kpc at the same scale heights of the Milky Way bulge measurements using the spatial scaling factor of 0.88 and 1.2 for NGC 4710 and the simulation, respectively. Velocities of the Milky Way bulge and the simulation were scaled to match the maximum velocity of the bulge of NGC 4710.
velocity dispersion map shows a central peak in velocity disper-sion that appears asymmetric with respect to the major axis of the galaxy, thus suggesting an edge-on view of NGC 4710 that is not perfect.
We investigated the stellar population properties of the BP bulge of NGC 4710 by performing full spectral-fitting in four fields along its the minor axis and find that the dominant population of the BP bulge is∼9 Gyr and shows no variation as a function of distance from the plane. The mean metallicity of the bulge decreases consistently at increasing heights from the plane. We measure a vertical metallicity gradient of 0.35 dex/kpc up to 1.5 kpc from the plane of the galaxy.
We scale the maps of NGC 4710 to a system that can be directly compared with the Milky Way bulge and compare the resulting maps with those constructed by Zoccali et al.(2014) based on interpolation of the GIBS survey rotational curves. In this comparison we found that the rotation map of NGC 4710 and the rotation map of the Milky Way bulge show a remarkable similarity. Although the velocity dispersion map of the bulge of NGC 4710 appears noisier than that of the Milky Way bulge,
σ map of the Milky Way bulge could be an artefact from the plane interpolation method to account for theσpeak observed atb=−2. Instead, theσpeak in the Milky Way bulge would be limited to Galactic latitudes|b|<2 (∼0.28 kpc).
On the other hand, the vertical metallicity gradient of 0.35 dex/kpc measured in the BP bulge of NGC 4710 com-pares well to the vertical metallicity gradient measured in the Milky Way bulge via photometric (Gonzalez et al. 2013) and spectroscopic (Zoccali et al. 2008;Rojas-Arriagada et al. 2014; Ness et al. 2013) surveys of∼0.40 dex/kpc.
In the Milky Way, there is significant evidence showing that the oldest bulge stars do not follow the bar and BP bulge spa-tial distribution. On the other hand, no spheroidal bulge compo-nent is found when performing an integrated light decomposi-tion analysis of NGC 4710, thus this bulge is classified as a pure BP bulge. If present in NGC 4710, a spheroidal bulge compo-nent would have to be much less dominant than the BP to remain hidden from the light decomposition analysis. Despite this, our results show that the global chemodynamical properties of the bulge of NGC 4710, based on its integrated spectrum, are in ex-cellent agreement with those of the resolved stellar populations of the Milky Way bulge, thus suggesting that these properties, i.e. the observed kinematic profiles and vertical metallicity gradi-ent, are intrinsic to their BP bulge component. Certainly, the on-going and planned surveys based on multi-object spectroscopic facilities with high multiplex capabilities (APOGEE, 4MOST, and MOONS) where a large number of metal-poor stars can be mapped, might hold the key to understand the nature of the old-est, most metal-poor stars of the Galactic bulge.
This study compares the global kinematics and morpholog-ical properties of the Milky Way bulge to an external galaxy. This work is demonstrative of the potential to understand our own galaxy in context via comparisons of its detailed stellar pop-ulations and kinematics from the rapidly growing large cover-age spectroscopic and photometric datasets with those of other galaxies observed with IFU instruments, such as MUSE.
Acknowledgements. We are grateful for the useful comments received from the anonymous referee. We warmly thank the ESO Paranal Observatory stafffor per-forming the observations for this programme. M.Z. and D.M. acknowledge fund-ing from the BASAL CATA through grant PFB-06, and the Chilean Ministry of Economy through ICM grant to the Millennium Institute of Astrophysics. M.Z. acknowledges support by Proyecto Fondecyt Regular 1150345. Support for this project is provided by CONICYT’s PCI programme through grant DPI20140066. D.M. acknowledges support by FONDECYT No. 1130196. V.P.D. is supported by STFC Consolidated grant # ST/J001341/1. The simulation used in this study was run at the High Performance Computer Facility of the University of Central Lancashire.
References
Athanassoula, E. 2005,MNRAS, 358, 1477
Athanassoula, E. 2008, in Mapping the Galaxy and Nearby Galaxies, eds. K. Wada, & F. Combes (Springer), Astrophys. Space Sci. Proc., 47 Athanassoula, E., & Misiriotis, A. 2002,MNRAS, 330, 35
Babusiaux, C., Gómez, A., Hill, V., et al. 2010,A&A, 519, A77
Bacon, R., Accardo, M., Adjali, L., et al. 2010, inSPIE Conf. Ser., 7735, 773508 Bekki, K., & Tsujimoto, T. 2011,MNRAS, 416, L60
Bensby, T., Yee, J. C., Feltzing, S., et al. 2013,A&A, 549, A147
Brooks, A., & Christensen, C. 2016, in Galactic Bulges, eds. E. Laurikainen, R. Peletier, & D. Gadotti (Springer International Publishing), Astrophys. Space Sci. Lib., 418, 317
Bureau, M., Aronica, G., Athanassoula, E., et al. 2006,MNRAS, 370, 753 Buta, R. J., Sheth, K., Athanassoula, E., et al. 2015,ApJS, 217, 32 Cappellari, M., & Copin, Y. 2003,MNRAS, 342, 345
Cappellari, M., & Emsellem, E. 2004,PASP, 116, 138
Cappellari, M., McDermid, R. M., Alatalo, K., et al. 2013,MNRAS, 432, 1862 Cole, D. R., Debattista, V. P., Erwin, P., Earp, S. W. F., & Roškar, R. 2014,
MNRAS, 445, 3352
Combes, F., & Sanders, R. H. 1981,A&A, 96, 164
Combes, F., Debbasch, F., Friedli, D., & Pfenniger, D. 1990,A&A, 233, 82 Davis, T. A., Alatalo, K., Sarzi, M., et al. 2011,MNRAS, 417, 882 de Souza, R. E., Gadotti, D. A., & dos Anjos, S. 2004,ApJS, 153, 411 Dékány, I., Minniti, D., Catelan, M., et al. 2013,ApJ, 776, L19 Dékány, I., Minniti, D., Majaess, D., et al. 2015,ApJ, 812, L29 Gadotti, D. A. 2008,MNRAS, 384, 420
Gadotti, D. A. 2012,Astron. Astrophys. Trans., 27, 221
Gadotti, D. A., Seidel, M. K., Sánchez-Blázquez, P., et al. 2015,A&A, 584, A90
Gonzalez, O., & Gadotti, D. 2016, in Galactic Bulges, eds. E. Laurikainen, R. Peletier, & D. Gadotti (Springer International Publishing), Astrophys. Space Sci. Lib., 418, 199
Gonzalez, O. A., Rejkuba, M., Zoccali, M., et al. 2012,A&A, 543, A13 Gonzalez, O. A., Rejkuba, M., Zoccali, M., et al. 2013,A&A, 552, A110 Hill, V., Lecureur, A., Gómez, A., et al. 2011,A&A, 534, A80 Howard, C. D., Rich, R. M., Clarkson, W., et al. 2009,ApJ, 702, L153 Iannuzzi, F., & Athanassoula, E. 2015,MNRAS, 450, 2514
Johnson, C. I., Rich, R. M., Kobayashi, C., et al. 2013,ApJ, 765, 157
Kormendy, J. 2013, Secular Evolution in Disk Galaxies, eds. J. Falcón-Barroso, & J. H. Knapen, 1
Krajnovi´c, D., Cappellari, M., de Zeeuw, P. T., & Copin, Y. 2006,MNRAS, 366, 787
Krajnovi´c, D., Karick, A. M., Davies, R. L., et al. 2013,MNRAS, 433, 2812 Laurikainen, E., & Salo, H. 2016, in Galactic Bulges, eds. E. Laurikainen,
R. Peletier, & D. Gadotti (Springer International Publishing), Astrophys. Space Sci. Lib., 418, 77
Laurikainen, E., Salo, H., & Buta, R. 2005,MNRAS, 362, 1319
Laurikainen, E., Salo, H., Buta, R., Knapen, J. H., & Comerón, S. 2010, MNRAS, 405, 1089
Lütticke, R., Dettmar, R.-J., & Pohlen, M. 2000,A&AS, 145, 405 Martinez-Valpuesta, I., & Gerhard, O. 2013,ApJ, 766, L3 McWilliam, A., & Zoccali, M. 2010,ApJ, 724, 1491
McWilliam, A., Fulbright, J., & Rich, R. M. 2010, in IAU Symp. 265, eds. K. Cunha, M. Spite, & B. Barbuy, 279
Méndez-Abreu, J., Debattista, V. P., Corsini, E. M., & Aguerri, J. A. L. 2014, A&A, 572, A25
Minniti, D., Lucas, P. W., Emerson, J. P., et al. 2010,New Astron., 15, 433 Nataf, D. M., Udalski, A., Gould, A., Fouqué, P., & Stanek, K. Z. 2010,ApJ,
721, L28
Ness, M., Freeman, K., Athanassoula, E., et al. 2013,MNRAS, 430, 836 Ness, M., Debattista, V. P., Bensby, T., et al. 2014,ApJ, 787, L19 Pietrukowicz, P., Kozłowski, S., Skowron, J., et al. 2015,ApJ, 811, 113 Rojas-Arriagada, A., Recio-Blanco, A., Hill, V., et al. 2014,A&A, 569, A103 Saha, K., & Gerhard, O. 2013,MNRAS, 430, 2039
Saito, R. K., Zoccali, M., McWilliam, A., et al. 2011,AJ, 142, 76 Scott, N., Cappellari, M., Davies, R. L., et al. 2013,MNRAS, 432, 1894 Shen, J., Rich, R. M., Kormendy, J., et al. 2010,ApJ, 720, L72 Sheth, K., Melbourne, J., Elmegreen, D. M., et al. 2012,ApJ, 758, 136 Simmons, B. D., Melvin, T., Lintott, C., et al. 2014,MNRAS, 445, 3466 Stanek, K. Z., Mateo, M., Udalski, A., et al. 1994,ApJ, 429, L73 Valenti, E., Zoccali, M., Renzini, A., et al. 2013,A&A, 559, A98 Valenti, E., Zoccali, M., Gonzalez, O. A., et al. 2016,A&A, 587, L6 Vásquez, S., Zoccali, M., Hill, V., et al. 2013,A&A, 555, A91
Vazdekis, A., Sánchez-Blázquez, P., Falcón-Barroso, J., et al. 2010,MNRAS, 404, 1639
Wegg, C., & Gerhard, O. 2013,MNRAS, 435, 1874
Wegg, C., Gerhard, O., & Portail, M. 2015,MNRAS, 450, 4050
Williams, M. J., Zamojski, M. A., Bureau, M., et al. 2011,MNRAS, 414, 2163 Young, L. M., Bureau, M., Davis, T. A., et al. 2011,MNRAS, 414, 940 Zoccali, M. 2010, in IAU Symp. 265, eds. K. Cunha, M. Spite, & B. Barbuy, 271 Zoccali, M., Renzini, A., Ortolani, S., et al. 2003,A&A, 399, 931