Offshore hydrogen production using wave energy
61
0
0
Texto completo
(2) Universidad de Valladolid Dpto. de Ingeniería de Sistemas y Automática ESCUELA DE INGENIERÍAS INDUSTRIALES Prado de la Magdalena s/n. Dr. Fernando Tadeo, Catedrático del Dpto. de Ingeniería de Sistemas y Automática de la Universidad de Valladolid, profesor del Programa de Doctorado “Ingeniería de Procesos y Sistemas” CERTIFICA Que el presente proyecto de investigación del programa de Máster de “Investigación en Ingeniería de Procesos y Sistemas”, se ha realizado bajo su dirección, en el Departamento de Ingeniería de Sistemas y Automática de la Escuela de Ingenierías Industriales de la Universidad de Valladolid.. Valladolid, Julio de 2013. Fdo.: Dr. Fernando Tadeo Rico.
(3) UNIVERSIDAD DE VALLADOLID Departamento de Ingeniería de Sistema y Automática Programa de Máster de “Investigación en Ingeniería de Procesos y Sistemas”. OFFSHORE HYDROGEN PRODUCTION USING WAVE ENERGY INFORME FINAL DEL MASTER DE “INVESTIGACIÓN EN INGENIERÍA DE PROCESOS Y SISTEMAS”. Presentado por:. Álvaro Serna Cantero. Realizado con la asesoría de:. Dr. Fernando Tadeo Rico. ABSTRACT The aim of this thesis is to present and evaluate a proposal for designing an off-grid offshore electrolysis plant powered by wave energy. This plant includes PEM electrolyzers, a Reverse Osmosis system to produce water with adequate conductivity, a compression unit to store the hydrogen for transport, and batteries for temporary storage of electricity for short-time balances. Firstly, a description of the H2OCEAN Project is given. Then, an introduction with previous works and a presentation of the two proposals that will be depicted is presented. After that, the components that comprise the proposed plants are justified and described and simple mathematical models of the different sections of the plant will be calculated. Finally the performance of the plant in a specific location is tested in detailed by using measured data, studying the influence of sizing on the expected performance in the two different proposals.. KEYWORDS: Offshore systems, wave energy, electrolyzers, off-grid systems. iii.
(4) GENERAL INDEX. GENERAL INDEX. LIST OF FIGURES. vi. LIST OF TABLES. viii. LIST OF SYMBOLS AND ABBREVIATIONS. ix. CHAPTER I: H2OCEAN PROJECT 1.1. Definition.. 2. 1.2. Members of H2OCEAN Project.. 3. 1.3. Structure of H2OCEAN Project.. 5. 1.4. Integration of this thesis in the H2OCEAN Project.. 6. CHAPTER II: INTRODUCTION 2.1. State of the art.. 7. 2.2. Offshore fresh water production proposal.. 8. 2.3. Offshore hydrogen production proposal.. 9. CHAPTER III: LIST OF COMPONENTS 3.1. Wave converters.. 11. 3.2. Water production.. 13. 3.2.1 Model.. 14. Electrolysis.. 16. 3.3.1 Model.. 17. 3.4. Compression.. 21. 3.5. Short-term energy storage.. 22. 3.3. CHAPTER IV: FRESH WATER PLANT PROPOSAL 4.1. Fresh water plant proposal.. 25. 4.2. Sizing proposal for the offshore fresh water plant.. 26. 4.3. Control system for the offshore fresh water plant.. 26. 4.4. Application to a case study.. 29 iv.
(5) GENERAL INDEX. 4.5. Conclusions.. 35. CHAPTER V: HYDROGEN PLANT PROPOSAL 5.1. H2 plant proposal.. 36. 5.1.1 Proposed desalination plant for low-conductivity water.. 37. 5.2. Sizing proposal for the offshore hydrogen plant.. 37. 5.3. Control system for the offshore hydrogen plant.. 38. 5.4. Application to a case study.. 40. 5.5. Conclusions.. 44. CONCLUSIONS AND FUTURE WORK. 46. ACKNOWLEDGEMENTS. 48. REFERENCES. 49. v.
(6) LIST OF FIGURES. LIST OF FIGURES. Figure 1.1. H2OCEAN Project Logo.. 2. Figure 1.2. Diagram of the H2OCEAN Platform.. 3. Figure 1.3. Geographic Distribution of the Participants in H2OCEAN.. 4. Figure 1.4. List of Work Packages in H2OCEAN Project.. 5. Figure 2.1. Process Diagram of the Offshore Fresh Water Production Proposal.. 9. Figure 2.2. Process Diagram of the Offshore Hydrogen Production Proposal.. 10. Figure 3.1. Scheme of the WEC.. 12. Figure 3.2. WEC Power Matrix.. 12. Figure 3.3. WEC Power Matrix in 3D.. 13. Figure 3.4. Transport of Water through a RO Membrane. 14. by Porosity and/or Diffusion. Figure 3.5. PEM Electrolyzer.. 17. Figure 3.6. Scheme of the Hydrolysis Reaction.. 17. Figure 3.7. Comparison between Experimental V-i Curves.. 21. Figure 3.8. Hydrogen Industrial Compression.. 22. Figure 3.9. Power Obtained by the WEC. Proof.. 23. Figure 3.10. DOD of the Battery. Proof.. 24. Figure 4.1. Structure of the Proposed Desalination Plant.. 25. Figure 4.2. Control System for the Fresh Water Plant Proposal.. 27. Figure 4.3. Sequential Function Chart of the Control Logic of the RO.. 28. Figure 4.4. Detail of the Sequential Function Chart (Stage A).. 29. Figure 4.5. Effect of Battery Capacity on System Performance. 30. (VS = 5500 m3). Figure 4.6. Effect of Seawater Tank Volume on System Performance. 31. (Cp = 2400 Ah). Figure 4.7. Power Produced by the WEC.. 32. Figure 4.8. Fresh Water Produced in each RO Section.. 32. Figure 4.9. Total Fresh Water Produced by the RO Sections.. 32. Figure 4.10. Total Power Consumed by the RO Sections and SWPs.. 33. Figure 4.11. Stored Seawater in the Seawater Tank.. 33. Figure 4.12. % Battery Charge (100% - DOD in Percentage).. 33. Figure 4.13. Power Produced by the WEC. Detail.. 33. vi.
(7) LIST OF FIGURES. Figure 4.14. Fresh Water Produced in each RO Section. Detail.. 34. Figure 4.15. Total Fresh Water Produced by the RO Sections. Detail.. 34. Figure 4.16. Total Power Consumed by the RO Sections and SWPs. Detail.. 34. Figure 4.17. Stored Seawater in the Seawater Tank. Detail.. 34. Figure 4.18. % Battery Charge (100%-DOD in Percentage). Detail.. 35. Figure 5.1. Process Diagram of the H2 Plant Proposal.. 36. Figure 5.2. Proposed Structure of the Desalination Plant. 37. for Low-Conductivity Water. Figure 5.3. Control System for the H2 Plant Proposal.. 39. Figure 5.4. Sequential Function Chart of the Control Logic. 40. of the H2 Plant Proposal Figure 5.5. Power Produced by the WEC of the Case Study.. 43. Figure 5.6. Hydrogen Produced by the Electrolyzers of the Case Study.. 43. Figure 5.7. Power Consumed in each Section of the Platform of the Case Study.. 43. Figure 5.8. Power Balance of the Case Study.. 43. Figure 5.9. Evolution of the Depth-of-Discharge of the Battery of the Case Study.. 44. Figure 5.10. Evolution of the Level of the Low Conductivity Water Tank.. 44. vii.
(8) LIST OF TABLES. LIST OF TABLES. Table 1.1. List of Participants in H2OCEAN.. 4. Table 4.1. Selected Operating Point.. 31. Table 5.1. Results of the Total Parameters and Consumptions in the Case Study.. 44. viii.
(9) LIST OF SYMBOLS AND ABBREVIATIONS. LIST OF SYMBOLS AND ABBREVIATIONS. BHR. VirtualPiE LTD. CHL. Chlamys SRL. CRAN. Cranfield University. DAP. D´Appolonia SPA. DOD. Depth of Discharge. DTU. Danmarks Tekniske Universitet. EUR. Euros. F-HBA. Floating-Heave Buoy Array. FML. Fusion Marine Limited. Fraunhofer. Fraunhofer-Gesellschaft zur Foerder Rung der Angewandten Forschung E.V. GIS. Geographic Information System. HAZOP. Hazard and Operability Study. ICT. Information and Communications Technology. ISL. Institut fuer Seeverkehr Swirtschaft und Logistik. ITP. IT Power LTD. MET. Meteosim Truewind S.L. PEM. Proton Exchange Membrane. RD. Research and Development. RO. Reverse Osmosis. SETA. SETA Sociedad Española de Tratamiento de Aguas S.L.. SME. Small-Medium Enterprise. ST. Sustainable Technologies. SWP. Seawater Pump. TREE. Treelogic. Telemática y Lógica Racional para la Empresa Europea S.L.. UNIOVI. Universidad de Oviedo. UVA. Universidad de Valladolid. VFF. Viking Fish Farms LTD. WP. Work Package. WEC. Wave Energy Converter. VFF. Viking Fish Farms LTD. ix.
(10) 1. H2OCEAN PROJECT. CHAPTER I H2OCEAN PROJECT 1.1. - Definition This thesis is comprised within a European Project named H2OCEAN which aim is the development of a wind-wave power open-sea platform equipped for hydrogen generation with support for multiple users of energy. The H2OCEAN Consortium is composed of 17 partners from 5 European countries (Spain, United Kingdom, Denmark, Germany and Italy). The partnership builds up on the expertise and experience of a well-balanced group of 10 innovative SMEs, 1 Large Enterprise and 6 leading Public Research Organizations (4 Universities and 2 Institutes).. Figure 1.1- H2OCEAN Project Logo.. The team shows a strong multi-sectorial profile, including renewable energy technologies, fluid mechanics engineering, off-shore engineering, desalination engineering, hydrogen generation, electrolysis engineering, offshore aquaculture, aquaculture equipment and management, maritime transport and economics, logistics systems, safety and risk assessment, environmental and economic impact and ICT. The trans-disciplinary work approach adopted within the H2OCEAN Consortium is based on the close collaboration of research organizations and industrial partners in the different activities under consideration and with a clear focus on developing innovative and exploitable results. The unique feature of the H2OCEAN concept, besides the integration of different activities into a shared multi-use platform, lies in the novel approach for the transmission of offshore-generated renewable electrical energy through hydrogen.. 2.
(11) 1. H2OCEAN PROJECT. Figure 1.2- Diagram of the H2OCEAN Platform.. This concept allows effective transport and storage of the energy, decoupling energy production and consumption, thus avoiding the grid imbalance problem inherent to current offshore renewable energy systems. Additionally, this concept also circumvents the need for a cable transmission system which takes up a significant investment share for offshore energy generation infrastructures, increasing the price of energy. The integrated concept will permit to take advantage of several synergies between the activities within the platform significantly boosting the Environmental, Social and Economic potential impact of new maritime activities, increasing employment and strengthening European competitiveness in key economic areas.. 1.2. - Members of H2OCEAN Project H2OCEAN builds on already on-going R&D and commercial activities of a partnership involving European leading industrial and academic partners from 5 countries within the fields of renewable energy, hydrogen generation, fish farming, maritime transports and related research disciplines. H2OCEAN started its activities on the 1st of January, 2012 and will end on the 31st of December, 2014. The Project shall have a cost of 6 million EUR and the European Union has granted a financial contribution of 4.5 million EUR (FP7-OCEAN.2011-1 “Multi-use offshore platforms”).. 3.
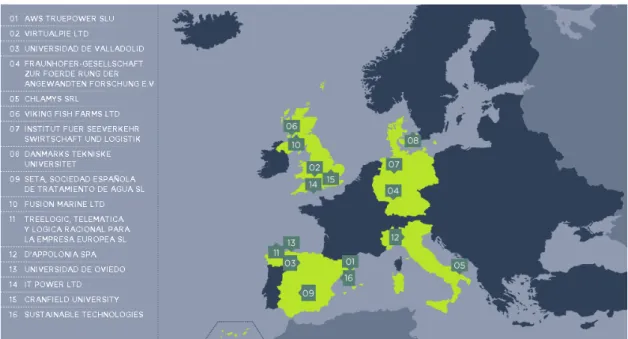
(12) 1. H2OCEAN PROJECT. Name of the Institution Abbreviation Country Meteosim Truewind S.L MET Spain VirtualPiE LTD BHR UK Universidad de Valladolid UVA Spain Fraunhofer-Gesellschaft zur Foerder Rung der Fraunhofer Germany Angewandten Forschung E.V Chlamys SRL CHL Italy Viking Fish Farms LTD VFF UK Institut fuer Seeverkehr Swirtschaft und ISL Germany Logistik Danmarks Tekniske Universitet DTU Denmark SETA Sociedad Española de Tratamiento de SETA Spain Agua S.L. Fusion Marine Limited FML UK Treelogic. Telemática y Lógica Racional para TREE Spain la Empresa Europea S.L. D´Appolonia SPA DAP Italy Universidad de Oviedo UNIOVI Spain IT Power LTD ITP UK Cranfield University CRAN UK Sustainable Technologies ST Spain Table 1.1- List of Participants in H2OCEAN.. Figure 1.3- Geographic Distribution of the Participants in H2OCEAN Project.. 4.
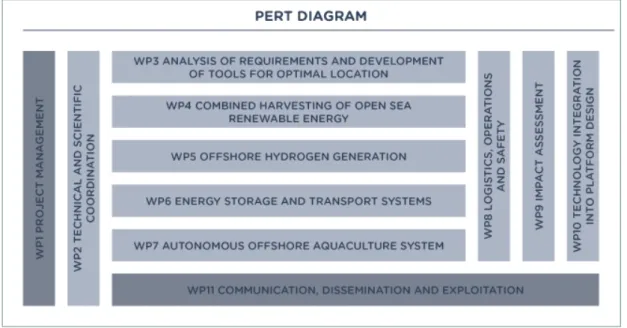
(13) 1. H2OCEAN PROJECT. 1.3. - Structure of H2OCEAN Project. The H2OCEAN work plan is structured around three interdependent and multidisciplinary components: the design of the platform concept, the development of technical solutions and the assessment of impact at different levels. The work structure has been designed to ensure the appropriate involvement and contribution from all Partners, the accurate integration of the different activities and the assessment of the platform as a whole (see PERT diagram). The work plan consists of 11 work packages: 9 WPs to perform the Research and Technology activity, including WP2 for Technical and Scientific Coordination to ensure technical coherence of the RTD actions and to provide a risk and contingency plan; WP11 for the Communication, Dissemination and Exploitation of results and WP1 for the overall Project Management.. Figure 1.4- List of Work Packages in H2OCEAN Project. Universidad de Valladolid is the leader of WP5, on the design of the desalination unit for hydrogen electrolyzers to be deployed offshore, and the development of a control system to balance the energy consumption of the desalination (reverse osmosis) unit. The goals of WP5 are the development and dimensioning of a hydrogen generator for installation on the different platforms/locations will be performed, including: -. Evaluation of electrolyzing technologies for marine environment,. -. Design of offshore desalination units for hydrogen generator and secondary uses, 5.
(14) 1. H2OCEAN PROJECT. -. Development and fluid dynamics testing of a scale physical model of the hydrogen generator. -. Development of advanced control system to minimize energy consumption and balance production and consumption of energy.. 1.4. - Integration of this thesis in the H2OCEAN Project The aim of the chapters of the thesis that will be presented below is to propose and design a simulated plant that comprises the different sections of WP5 in which Universidad de Valladolid works. These sections consist of an energy supply (wave energy), water generation by reverse osmosis technique, hydrogen production by electrolysis and the storage of this hydrogen. All these different sections will be specified in detail with their models and two different performances of the plant in a given location will be tested by using measured data, studying the influence of sizing on the expected performance.. 6.
(15) 2. INTRODUCTION. CHAPTER II INTRODUCTION. 2.1.-State of the art Offshore desalination plants powered by renewable energies are being proposed as an alternative for a coastal desalination facility, for those locations where the lack of suitable land makes a land-based desalination plant inadequate [1,2]. Different techniques of desalination have been studied in previous works. Among the most developed are reverse osmosis and vapor compression desalination [3]. The first part of the thesis (offshore fresh water production) studies a proposal to use an offshore wave platform as the sole energy source of a reverse osmosis (RO) plant to produce drinkable water, which is then transported offshore (through pipes, water tank ships or bladders) [4]. Some economic studies have been published about the advantages of autonomous wave-powered desalination plants. These works have discussed whether the real value of the system is enhanced due to its flexibility for deployment and reduced environmental impact [5,6]. As renewable energy is the only source of energy, a central problem would be to balance energy consumption with energy production: as energy production is variable and the electrical system is isolated from the grid, the desalination plant has to be designed with variable production in mind [7,8]. Most of the works on wave energy conversion have focused on electricity production. Any such converter could, in principle, be coupled to an electrically-driven desalination plant, either with or without connection to the local electricity grid. Various concepts have associated wave energy converters and RO [9]. The second part of the thesis refers also to a renewable energy offshore plant but it this case hydrogen is produced as the final product. It is well known that hydrogen is a clean energy carrier independent of energy sources [10]. The full benefits of hydrogen will be obtained when is produced from renewable energy sources. Different renewable energy sources have already been studied for electrolyzation, such as wind [11,12] and. 7.
(16) 2. INTRODUCTION. solar energy [13,14]; the feasibility of these sources to produce hydrogen has been demonstrated, with the main drawback the variability of these sources (see, for example, [14] for a detailed feasibility and economical study), and the significant cost of solar hydrogen [15]. There are some published works on using reverse osmosis to obtain hydrogen from seawater, involving wave energy for generating the energy for the process [16,17]. There are even patents available that take into account this idea [18,19]. This thesis concentrates on offshore systems. In both proposals the source considered in this work is wave energy. Offshore power links are known to be significantly expensive [20,21], so the system is here assumed to be fully isolated from the grid: it is parallel to the grid independent wind-hydrogen generation presented in [15]. Thus, power consumption adapts to power production by connecting or disconnecting sections of the electrolyzation plant (following a Smart Grid approach for the microgrid in the plant), and using a temporary storage of electricity for short-time balances and increase of autonomy (that is a relevant issue in offshore installations). Automatic cleanings and maintenance operations are scheduled in the sections that are temporarily disconnected, to improve overall efficiency. Compared with previous proposals [17,18,19], this thesis concentrates on using commercially available components that are already tested in the marine environment. Special attention is given to the modeling for sizing of the components, the production of low-conductivity water for the electrolysis and the control system.. 2.2-Offshore fresh water production proposal The proposal presented here is based on dividing the desalination plant into a few sections, which would be switched on or shutdown, depending on the available energy [22,23]. All of this requires a specific control system, which is discussed later. Wave energy converters are studied as they provide lower variability in energy production in comparison with other sources [24]. Thus, power consumption adapts to power production by connecting or disconnecting sections of the plant. As has already been mentioned, WEC energy production changes with time, which requires the production of water (and thus the power consumption) to adapt to the. 8.
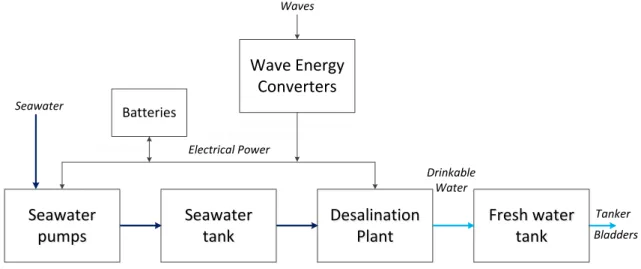
(17) 2. INTRODUCTION. available power. This is challenging for RO plants, as they are normally designed to operate at an optimal working point. Changing the working point of the plant (thus, changing the flow/pressure combination from a specific value) makes it possible to adapt the RO electrical load to the demand. A specific control system, discussed later in section 4.3, would be responsible for adapting power consumption to demand, always trying to operate the plant at the best possible overall efficiency. The process diagram in Figure 2.1 presents the main blocks of the first proposal (fresh water production): the wave energy converters (WECs), the seawater pumps (SWPs), the seawater tank, the desalination plant, the fresh water tank and the water transport facility (by tankers, bladders or pipes). An overall idea of this proposal is presented in section 4.1. Section 4.2 gives some guidelines for the system sizing methodology. A control system is proposed in section 4.3 and section 4.4 depicts an application to a case study. Finally, some conclusions and future work are provided in section 4.5. Waves. Wave Energy Converters Seawater. Batteries Electrical Power Drinkable Water. Seawater pumps. Seawater tank. Desalination Plant. Fresh water tank. Tanker Bladders. Figure 2.1-Process Diagram of the Offshore Fresh Water Production Proposal.. 2.3-Offshore hydrogen production proposal The proposal presented in this section of the thesis is composed also of a primary energy source, wave energy, which provides electricity in order to produce hydrogen using PEM electrolyzers. Water for these electrolyzers is obtained from seawater using membrane technologies based on Reverse Osmosis (RO, [22]). A temporary storage system, consisting of a set of batteries for balancing production and 9.
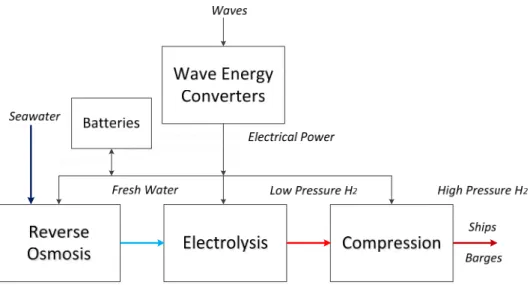
(18) 2. INTRODUCTION. demand is also installed. The hydrogen is then transported to the final users by ships (barges), after compression. It has been previously shown ([25]) that Energy Management Systems are important components in these off-grid electrolyzation facilities, to improve efficiency of the process under variable production. A simple strategy is proposed here, to connect/disconnect components, depending on the amount of energy available, the state of charge of the batteries, and the amounts of water available for the electrolyzers and the desalination system. The process diagram in Figure 2.2 presents the four main blocks of the second proposal (hydrogen production): the wave converters, the Reverse Osmosis plant, the electrolysis unit and the compression unit. The proposed models of the different components of the plant are described in sections 3. A description of the hydrogen production is presented in section 5.1, and a desalination plant for this proposal is provided in section 5.1.1. Section 5.2 gives some guidelines for the system sizing methodology. A control system is proposed in section 5.3. In section 5.4, an application to a case study is proposed. Finally, some conclusions and future work of this proposal are presented in section 5.5.. Figure 2.2-Process Diagram of the Offshore Hydrogen Production Proposal.. 10.
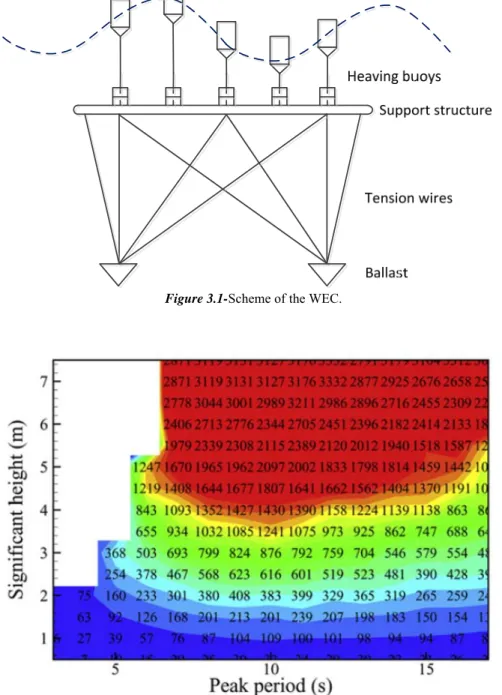
(19) 3. LIST OF COMPONENTS. CHAPTER III LIST OF COMPONENTS. 3.1- Wave converters The number of companies that design a device capable of exploiting wave energy is increasing every day. The output energy of a mechanism is basically determined by the system characteristics and the wave weather in the area [26]. We assume in this thesis the use of a multibody floating wave energy converter (WEC). For offshore installations the energy is extracted by the relative motion of different parts of the structure. The main advantage of these devices is that, in deep water (>40m), there is a greater energy potential because the waves have not yet experienced losses. The device used in the system is a floating heave-buoy array (F-HBA). It is represented in Figure 3.1. It is a multibody floating WEC, composed of many heaving buoys connected to a common reference structure. This structure is composed of an arrangement of a single support structure and a series of ballast baskets, connected through tension wires. The total buoyancy force from the buoys is balanced by net gravity forces of the bridge and the ballast baskets. The buoys are connected to the submerged structure via a hydraulic Power Take-Off (PTO) system, which converts the mechanical energy of the device into electricity. In the case of wave activated body WECs, they can be based on hydraulic components (hydraulic rams and motors) combined with an electrical generator [27], or they can be fully electric [28,29]. The second proposal was assumed in this work due to the special conditions in offshore plants. One of the key points in the structural design and energy extraction capacity of the device is the response to different periods and wave heights (Figure 3.2). To evaluate the energy produced by the WEC, water waves are considered to travel along the surface of the sea with an approximate sinusoidal profile, characterized in terms of the time between successive crests and the size of these crests [30].. 11.
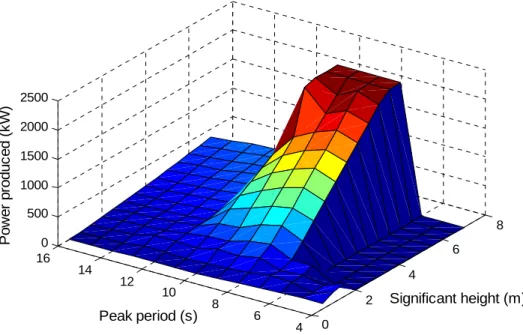
(20) 3. LIST OF COMPONENTS. Wave height and period are represented by statistical measurements, the most common being the significant wave height, Hs(t) (around four time the root-mean square of the surface elevation during a given window), and the wave period Tp(t). The devices have a maximum range of operation: The energy that can be used by a device is limited to a maximum wave height and a minimum wave period. Multiplying the WEC power matrix (Figure 3.3) by the buoy-measured data of the sea location, the mean absorbed power during a specific time period of the device can be derived (Pw).. Figure 3.1-Scheme of the WEC.. Figure 3.2-WEC Power Matrix.. 12.
(21) 3. LIST OF COMPONENTS. Power produced (kW). 2500 2000 1500 1000 500 8 0 16. 6 14. 12. 4 10. Peak period (s). 8. 2 6. 4. Significant height (m). 0. Figure 3.3-WEC Power Matrix in 3D.. 3.2- Water production Different techniques for fresh water production have been developed. Nowadays, reverse osmosis and distillation processes are the most used technologies. The required plant capacity, the annual and daily distribution of fresh water demand, the product cost, the technology maturity and any problem related to the coupling of the renewable energy and the desalination systems determine this selection [31]. The plant proposed in this thesis is an offshore floating plant, which makes the implementation of distillation processes difficult due to the strict limitations on space and movements. Thus, RO was selected as the desalination technique as there is wide experience in this process in marine installations. PEM electrolyzers have strict requirements in terms of the inlet water to guarantee long-term performance: ionic conductivity must be very low (in the order of a few µS, with the number depending on the PEM membrane characteristics) [32]. Taking into account the fact that the facility would be installed offshore, desalination of seawater is the natural solution; from the available desalination techniques, Reverse Osmosis (RO) is selected, as it already being used in many marine applications, it can be significantly automated, and can be easily adapted to different flow and conductivity requirements. Seawater RO water (with conductivity smaller than 5µS) has already being used for PEM electrolyzation without a significant effect on performance [33].. 13.
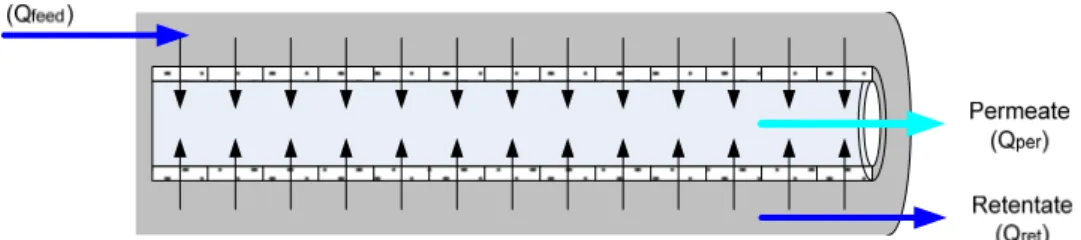
(22) 3. LIST OF COMPONENTS. RO is based on transport of water through a membrane by porosity and/or diffusion (see scheme in Figure 3.4). The chemical and physical nature of the RO membrane determines its ability to allow for preferential transport of solvent (water) over solute (salt ions). To ensure water flow through the RO membrane a difference of pressure is needed between the feed and permeate sides of the membrane, that must be significantly greater than the osmotic pressure: for seawater this gives operating pressures around 60 bars [34]; the pressure at the retentate (water with salinity greater than the feed) is frequently recovered using specific devices, to improve energy efficiency.. Figure 3.4-Transport of Water through a RO Membrane by Porosity and/or Diffusion.. 3.2.1- Model A simplified model presented in [35] is used here, based on the complete one. The equations are similar for the two RO stages that are proposed in this thesis. If a mass balance in steady state is made in the membrane inlet and outlets (see Figure 3.4), the equation is: Q. ∙C. where Q. Q. ∙C. and Q. Q. ∙ρ. (1). are the flow rates in the first section of the feed and the. permeate, respectively, in m3/h, C and in the permeate in kg/m3, Q. and C. are the salt concentrations in the feed. is the salt flow, and ρ. is the density of this flow.. The flow rate of the concentrate through the membrane is defined by: Q. B ∙ C. C. (2). where B is the membrane permeability coefficient for salt. It represents a unique constant for each membrane type, and C. C. transfer of salts. 14. is the driving force for the mass.
(23) 3. LIST OF COMPONENTS. The rate of water passage through a semi-permeable membrane (Q. ) is. defined in equation (3). Q where p. A ∙ p. p. π. is the feed pressure, p. (3) is the pressure in the permeate, π is the. osmotic pressure differential across the membrane, and A1 is the membrane permeability coefficient for water. The term A1 represents a unique constant for each membrane material type, and the terms of pressure within the parentheses is the net driving pressure or net driving force for the mass transfer of water across the membrane. The equation defining the osmotic pressure is as follows: π. α∙ C. C. ∙T. (4). where α is the osmotic coefficient, and T is the temperature in K. The salinity of the permeate, C. , depends on the relative rates of water and. salt transport through the reverse osmosis membrane, as equation (5) describes: C. (5). The fact that water and salt have different mass transfer rates through a given membrane creates the phenomenon of salt rejection. No membrane is ideal, in the sense that it absolutely rejects salts; rather, the different transport rates create an apparent rejection. The equations (2) and (3) explain important design considerations in RO systems. For example, an increase in operating pressure will increase water flow without changing salt flow, thus resulting in lower permeate salinity. There must be appropriate values of concentrations at the outlet of the permeate flux, because the water electrolyzers work with very low conductivity salt (< 2 μS/cm). Knowing the flow rate in the input and output of the reverse osmosis plant, the hydraulic power consumed for each pump (P where ρ. ) can be calculated with equation (6),. is the density of the flow rate and H is the dynamic head of the pump. (that is a function of pressure [35]).. 15.
(24) 3. LIST OF COMPONENTS. P. ρ. ∙g∙H ∙Q. (6). For the second section, a parallel set of equations can be easily derived, to estimate P. .. Finally, the value of the electrical power consumed by the two pumps in the process, P , is obtained with equation (7). P. P. ∙ϑ. ∙ϑ. P. ∙ϑ. ∙ϑ. (7). where ϑ are the efficiencies of pumps and their engines. 3.3- Electrolysis Electrolyzation is a mature, market-available technique that can operate intermittently, producing large volumes of hydrogen without greenhouse gases emissions, as long as the electricity is provided by renewable sources [36]. In this proposal we focus on PEM electrolyzers, as they have advantages in terms of safety when compared with alternative technologies (See [36] and references therein); moreover, they have already been successfully tested in marine environments [33]. In the case of an acidic PEM cell, it is assumed that liquid water splitting occurs according to the following half-cell reactions [38]: anode:. H2O(liq)1⁄2O2(g) + 2H+ + 2e-. cathode:. 2H+ + 2e- H2(g). full reaction: H2O(liq)H2(g) + 1⁄2O2(g). 16.
(25) 3. LIST OF COMPONENTS. Figure 3.5-PEM Electrolyzer.. Solvated protons formed at the oxygen-evolving anode of the PEM cell migrate through the membrane to the cathode where they are reduced to molecular hydrogen.. Figure 3.6-Scheme of the Hydrolysis Reaction.. 3.3.1- Model PEM technology is one of the most promising water electrolysis technology for direct coupling with renewable electrical sources [39,40]. The purpose here is to use a simple PEM water electrolyzer model that predicts energy and water consumptions and hydrogen production, so a simplified electrochemical submodel will be described based on [41].. 17.
(26) 3. LIST OF COMPONENTS. From a thermodynamic point of view, the minimum voltage to start the water electrolysis reaction corresponds to the sum of the reversible potential for each semi reaction described before at both electrodes. These minimum potentials are affected by pressure and temperature conditions of the reactions. Moreover, in real systems higher potential must be applied due to kinetics losses at the bipolar plates, electrodes and internal resistances in the cell. Hence, when current is flowing through the electrodes the operating voltage for a single ) is given by the reversible voltage and the sum of different over potentials.. cell (V. For PEM electrolytic cells: V. U. η. η. ηΩ. (8). a) Reversible voltage The reversible voltage or open circuit voltage at the cell (U. ) in equation (8),. depends on the temperature and pressure of reaction. This dependence can be theoretically estimated from thermodynamic calculations on the change of the Gibbs free energy or from the electrochemical point of view using the Nernst equation for water electrolysis (9). Assuming H2 and O2 as ideal gases, water as an incompressible fluid and ideal gas-liquid phases mixture can simplify the calculations of thermodynamic variables and activity coefficients (a U. ∙ ln. T, p. ,a ,a ). (9). /. ∙. Therefore, for low-pressure or atmospheric applications the effect of the pressure can be neglected in order to simplify the model. Reversible voltage for water electrolysis at constant atmospheric pressure is empirically given by [42]: U. T. 1.5184. 1.5421 ∙ 10. 9.523 ∙ 10 TlnT. 9.84 ∙ 10 T. (10). b) Electrodes overpotential When current flows through the electrolytic cell, charge transfer and mass transport phenomena in the electrode must be considered. These limitations on the semi reactions are known as activation and concentration over potentials respectively. On 18.
(27) 3. LIST OF COMPONENTS. each electrode, one of the branches (oxidation at the anode and reduction at the cathode) will dominate during operation. Therefore, the anodic and cathodic activation over potentials (η and η respectively) in equation (8) can be written as: η. ∙ ln. η. ∙ ln. (11). ,. (12). ,. where αc and αa are defined as the charge transfer coefficients for the cathode and the anode respectively. Many reactions tend towards symmetry, so with no information available it is usual to assume both charge transfer coefficients as 0.5. In water electrolysis z = 2. i. ,. and i. ,. are the exchange current densities for each. electrode. The activation overpotential is highly affected for these values, which depend on the used electrocatalyst, electrode morphology, age, pressure, temperature and other factors. A value of i. at reference temperature must be chosen from literature or from. ,. manufacture’s information, then:. i. i. ,. where E. ∙ exp. (13). can be defined as the activation energy for the electrode reaction.. During the global reaction, each electrode has its own contribution to the activation over potential (i.e, η. = η. ,. + η. ,. ). However this contribution is not symmetric,. typically the values of the exchange current density at the anode electrode are much lower at the cathode side (e.g 10-7 A/cm2 in Pt-Ir anode and 10-3 A/cm2 in Pt cathode at 80ºC [43]. In this sense the cathode contribution to the activation overpotential can be neglected. At high current densities transport limitations cannot be neglected. c) Resistive overpotential The ohmic over potential in equation (8) could be expressed by: ηΩ. R. R. i. Ri. (14). 19.
(28) 3. LIST OF COMPONENTS. where R. and R. are the electronic and ionic contribution to the resistive. losses. The addition of the two contributions can be defined as the normalized interfacial resistance (R [Ω·cm2]). R. increases with the operation temperature, it is due to the electrical resistance. of the cell components with the exception of the electrolyte (bipolar and current collector plates, gas diffusion layers, and electrode layers). The ionic resistance of the membrane (R. ) is due to the resistance to the. protons transport in the polymeric membrane. Thus ionic resistance can be expressed as a function of the thickness (t ) and the conductivity (σ) of the membrane. R. (15). The temperature dependence of the membrane conductivity is modeled using an Arrhenius expression [44]:. σ T. σ. ∙ exp. where E. (16). is a temperature independent parameter which represents the. activation energy for proton transport in the membrane. In practice, the main contribution to the resistive losses is expected to arise from R. , since conductivity of. the membrane is usually much lower than conductivity of the rest of components. Thus neglecting the R. contribution does not imply a significant error.. Finally, equation (17) gives the power consumed for a single cell (P ) where I. is the current of the cell: P. V. ∙I. (17). Figure 3.7 shows graphically the comparison between experimental V-i curves at different temperatures and the simulation applying the described model. It can be seen that the cell voltage increases with the current density and decreases with the temperature for a certain value of current density.. 20.
(29) 3. LIST OF COMPONENTS. 1,8 1,75. Cell Voltage (V). 1,7 1,65 1,6. 293K. 1,55. 303K. 1,5. 313K. 1,45. 323K. 1,4. 333K. 1,35 1,3 0. 0,2. 0,4. 0,6. 0,8. 1. 1,2. 1,4. Current density (A/cm2) Figure 3.7-Comparison between experimental V-i curves.. 3.4- Compression For real gases far above their boiling temperature, the thermodynamic process of compression can be described by the adiabatic compression equation (18):. P. m. ∙. ∙p ∙V ∙. 1. (18). where P is the power consumed in the compression process, p the initial pressure, p the final pressure, V the initial specific volume, γ the ratio of specific heats, and m. is the hydrogen production rate (kg/h) [45].. In both isothermal and adiabatic compression, the compression work is the difference between the final and initial energy states of the gas. At identical final pressures, the different compression processes yield different temperatures of the compressed medium. In the ideal isothermal case, the temperature would remain constant, while it rises considerably under adiabatic conditions. Moreover, the compression work depends on the nature of the gas. In this thesis it is assumed atmospheric pressure as initial pressure and 200 bar as final pressure because that conditions are the most common in the hydrogen industrial compression. 21.
(30) 3. LIST OF COMPONENTS. Figure. 3.8- Hydrogen Industrial Compression.. 3.5- Short-term energy storage The proposed system is off-grid, so energy production and demand must be constantly balanced. Short-term energy storage is used to provide energy to the different sections of the plant [46]. Several technologies have been proposed for temporarily storage (see, for example, [15] for a review of technologies). In this case, as reliability is an important issue, we will assume a standard Pb battery rack system, as there is wide experience in marine applications. The lead-acid battery cell stores electrical energy in the form of chemical energy, releasing this stored energy into an electrical circuit as the battery discharges. Operation of the lead-acid cell can be described by the chemical reaction (19) where the cell´s positive active material (lead dioxide – PbO2) and its negative active material (sponge lead - Pb) both react with the sulfuric acid electrolyte to form lead sulfate (PbSO4) and water. PbO. Pb. 2H SO ↔ 2PbSO. 2H O. (19). From left to right this equation represents discharge, and from right to left, charge. When the terminals of the charged lead-acid cell are connected through an external circuit, an electrical current will flow caused by a stream of electrons flowing between the cell´s positive and negative electrodes. During charge the electrons are provided by an external power source. The nominal voltage of the lead-acid cell is 2.0 volts [47].. 22.
(31) 3. LIST OF COMPONENTS. The batteries are used to provide energy to the reverse osmosis plant and electrolyzers when not enough power is provided by the wave converters. I. (20). where I is the amperage of the battery, V is the battery voltage and P with different subscripts are the power supplied by the wave converter (P ) and the power consumed in the reverse osmosis plant (P ), electrolyzers (P ) and compression unit (P ). The equation relating the capacity of the battery and the amperage is as follows (21): η. (21). where C is the rated capacity at that discharge rate, t the time, k is Peukert´s coefficient and η is the efficiency of the battery. The key decision variable, the depth of discharge (DOD) of a battery, is the percentage of capacity to which it is discharged. Values approaching 1 correspond to the battery being almost discharged. The DOD is given by the expression below, where C is Peukert´s capacity. DOD. 1. (22). A simulation proof of the battery model has been done in order to check if the model is right or not. It can be seen that for an increase in the power generated (Figure 3.9), the value of the parameter DOD of the battery decreases so the battery is being charged (Figure 3.10). Power obtained-Proof. Power obtained (kW). 1400 1200 1000 800 600 400 0. 1. 2. 3. 4. 5. 6. 7. Time (days). Figure. 3.9- Power Obtained by the WEC. Proof. 23. 8. 9. 10. 11.
(32) 3. LIST OF COMPONENTS. DOD-Proof 1.05. 1. DOD. 0.95. 0.9. 0.85. 0.8. 0.75. 0. 1. 2. 3. 4. 5. 6. 7. 8. 9. 10. 11. Time (days). Figure. 3.10- DOD of the Battery. Proof.. It is important to remark the fact that the constant discharging and charging of the batteries leads to them becoming quickly ineffective, so DOD is an important parameter that will be used inside the control system, as in [48,49]. Therefore, the battery capacity that has finally been chosen in the simulations in sections 4.4 and 5.4 aims to be the least harmful to the system.. 24.
(33) 4. FRESH WATER PLANT PROPOSAL. CHAPTER IV FRESH WATER PLANT PROPOSAL. 4.1- Fresh water plant proposal It was decided to partition the high pressure part of the RO plant into three sections (A, B and C) [4]: The three sections operate as a standard RO plant (producing water with maximum efficiency, at a fixed working point). Sections can operate on an individual basis or together with one or more of the different sections. Seawater is taken from the sea by the SWPs before being stored in a seawater tank as can be seen in Figure 4.1. It is then desalinated and stored in a fresh water tank in order to transport it offshore through pipes and/or water tank ships or bladders.. Figure 4.1- Structure of the Proposed Desalination Plant.. 25.
(34) 4. FRESH WATER PLANT PROPOSAL. 4.2- Sizing proposal for the offshore fresh water plant In the proposed facility, a central aspect of the design for a specific location is the selection of the sizes of components, in order to ensure autonomous operation of the facility without excessive capital or operation costs. In particular, the following parameters should be selected [23]: The fresh water produced, QT (m3). The RO plant capacity FT (m3/h). The total rated power consumption of the process, P (kW). The volume of the seawater tank, VS (m3). The battery capacity, CP (Ah). In this kind of renewable energy installations, it is important to take into account the variability of the source: for this, forecasts are usually needed. In this case, we assume that a significant record of data measured in the location where the WECs would be placed is available. Sizing of the proposed facility can be carried out based on the Rated Power (PW) of the WECs and the measured data. The proposed methodology to select the plant parameters is then the following: Using the measured data, the evolution of the power produced by the WECs (Pw) is estimated. The total rated power consumption of the process P is selected to ensure that one or more of the different sections of the RO for at least λ % of the time. The tank size VS is selected to ensure autonomy at all times. The battery capacity CP is selected to ensure Wa hours of autonomy at all times and DOD always between given limits DOD. DOD.. 4.3- Control system for the offshore fresh water plant A central component to ensure smooth operation of the facility is the control system that should balance electricity production and consumption, by adapting the consumed loads: power of the seawater pumps (SWPs) and the pumps working in the different sections of the RO. It is assumed that the control system is based on the two following. ideas:. Six. control. variables 26. are. used,. that. correspond. to. the.
(35) 4. FRESH WATER PLANT PROPOSAL. connection/disconnection of each sections A, B and C in the RO and each SWP (See Figure 4.2). When the production is higher than the consumption, the energy is stored until the temporary storage system is nearly full; then different sections of the RO and the SWPs are switched on. When the storage system is almost empty, sections of the RO and the SWPs are switched off (these sections are then automatically cleaned and maintenance operation carried out). A control subsystem decides the connection/disconnection of the three SWPs in specific cases of safety. When the level of the seawater tank is higher than a certain value, the three SWPs are switched off simultaneously until the level is again between safety limits. When the level of the seawater tank is lower than a certain value, the three SWPs are switched on simultaneously until the level is again between safety limits.. Figure 4.2- Control System for the Fresh Water Plant Proposal.. 27.
(36) 4. FRESH WATER PLANT PROPOSAL. The control logic is summarized in the Sequential Function Chart in Figure 4.3, where the different stages in the desalination process can be seen. There is one different combination of RO sections (A, B and C) in each stage. Therefore, for each range of DOD values, there is a certain operating stage. Furthermore, in each stage, the three SWPs are switched on/off one by one, depending on the value of the DOD, as can be seen in Figure 4.4. In this case, a detail of the Sequential Function Chart in the stage A is shown.. Idle. DOD ≤ 0.8. B. DOD ≥ 0.85 DOD ≤ 0.6 DOD ≥ 0.65. C+B. DOD ≤ 0.45. A. DOD ≥ 0.5. DOD ≤ 0.3 DOD ≥ 0.35. A+C. DOD ≤ 0.2 DOD ≥ 0.25. A+B. DOD ≤ 0.05. A+B+C. DOD ≥ 0.2. Figure 4.3- Sequential Function Chart of the Control Logic of the RO.. 28.
(37) 4. FRESH WATER PLANT PROPOSAL. Figure 4.4-Detail of the Sequential Function Chart (Stage A).. 4.4- Application to a case study To validate the proposed offshore platform and the sizing methodology, a casestudy was carried out for a specific location in the Atlantic Ocean, selected for its good wave regime. For this location, buoy data was measured for 165 days (wave heights, periods, water salinity and temperature, etc.). Based on this data, a platform was designed using the proposed sizing methodology. This design was then tested assuming different platform parameters. The simulation was modeled and performed using MATLAB ® and Simulink ®.. 29.
(38) 4. FRESH WATER PLANT PROPOSAL. . Figure 4.5 shows the effect of battery capacity on system performance: RO plant capacity and switch on-off times of the SWPs and the different sections of the RO for a tank volume (VS) of 5500 m3. It shows that the amount of fresh water produced increases until a battery capacity value of 2400 Ah. It remains constant after this value. The value of the number of times that the SWPs are switched onoff is independent with the battery capacity. The number of times that the RO is switched on-off decreases with the increase of the battery capacity. Therefore, a battery capacity of 2400 Ah will be chosen to evaluate the effect of tank size on system performance. Figure 4.6 shows the effect of the seawater tank volume with the same system parameters. It shows that the amount of fresh water produced is independent with the seawater tank volume. The same behavior has been seen with the number of times that the sections of the RO are switched on-off. As expected, the number of times that the SWPs are switched on-off decreases with the battery capacity.. 120000. 90. 118000. 80. 116000. 70. 114000. 60. 112000. 50. 110000. 40. 108000. 30. 106000 104000. 20. 102000. 10. 100000. 0 0. 500. 1000. 1500. 2000. 2500. 3000. 3500. Battery capacity (Ah) Water produced (m3/month). On‐Off SWP. On‐Off RO. Figure 4.5 -Effect of Battery Capacity on System Performance (VS = 5500 m3).. 30. On‐Off SWP/RO. Effect of battery capacity on system performance. Fresh water m3/month. .
(39) 4. FRESH WATER PLANT PROPOSAL. Effect of tank volume on system performance 120000. 30. 118000. Fresh water m3/month. 114000. 20. 112000 110000. 15. 108000 10. 106000 104000. On‐Off SWP/RO. 25. 116000. 5. 102000 0. 100000 0. 2000. 4000. 6000. 8000. 10000. Tank volume (m3). Water produced m3/month. On‐Off SWP. On‐Off RO. Figure 4.6-Effect of Seawater Tank Volume on System Performance (Cp = 2400 Ah).. Finally, an operating point was selected, that is presented in Table 4.1: Battery capacity (Ah) 2400. Tank volume (m3) 7700. Fresh water (m3/month) 106693. On-Off SWPs On-Off RO (times/month) (times/month) 4.8 20.6. Table4.1-Selected Operating Point.. Figures 4.7 to 4.12 show different parameters at the operating point on 165 days with buoy measurements. It can be seen that the proposed system operates adequately: Figure 4.7 represents the power produced by the WEC. Power produced depends on the values of the wave´s height and period (see Figure 3.3). Figure 4.8 shows that the value of the fresh water produced in each RO section varies along time according to the stages of the RO illustrated in Figure 4.3. Figure 4.9 shows the total fresh water produced, which is the sum of sections A, B and C. It can be seen that this value increases if the value of power produced (Figure 7.7) is high. Figure 4.10 depicts the total power consumed. It is proportional to the total fresh water produced plus the power consumed by the SWPs.. 31.
(40) 4. FRESH WATER PLANT PROPOSAL. Figure 4.11 shows the stored seawater. The value is between the minimum and maximum safety level. Finally, Figure 4.12 depicts the value of % Battery charge. As expected, this value varies between 30% and 100%, therefore it never gets discharged. Figures 4.13 to 4.18 present a detail of the responses during 20 days. Power produced. Power produced (kW). 1500. 1000. 500. 0. 0. 20. 40. 60. 80 Time (days). 100. 120. 140. 160. Figure 4.7-Power Produced by the WEC. Fresh water produced. Flow rate (m3/h). 150. Section A Section B Section C. 100. 50. 0. 0. 20. 40. 60. 80. 100. 120. 140. 160. 140. 160. Time (days). Figure 4.8-Fresh Water Produced in each RO Section. Total fresh water produced 300. Flow rate (m3/h). 250 200 150 100 50 0. 0. 20. 40. 60. 80. 100. 120. Time (days). Figure 4.9-Total Fresh Water Produced by the RO sections.. 32.
(41) 4. FRESH WATER PLANT PROPOSAL. Total power consumed Power consumed (kW). 800. 600. 400. 200. 0. 0. 20. 40. 60. 80. 100. 120. 140. 160. Time (days). Figure 4.10- Total Power Consumed by the RO Sections and SWPs. Stored seawater Stored seawater (m3). 8000 6000 4000 2000 0. 0. 20. 40. 60. 80. 100. 120. 140. 160. Time (days). Figure 4.11-Stored Seawater in the Seawater Tank. % Battery charge. % Battery charge. 100. 80. 60. 40. 20. 0. 0. 20. 40. 60. 80. 100. 120. 140. 160. Time (days). Figure 4.12- % Battery Charge (100%-DOD in Percentage).. Power produced P o w e r p ro d u ce d (kW ). 1500. 1000. 500. 0 60. 62. 64. 66. 68. 70. 72. 74. Time (days) Figure 4.13- Power Produced by the WEC. Detail.. 33. 76. 78. 80.
(42) 4. FRESH WATER PLANT PROPOSAL. Fresh water produced Section A Section B Section C. 100. 50. 0 60. 62. 64. 66. 68. 70. 72. 74. 76. 78. 80. Time (days). Figure 4.14- Fresh Water Produced in each RO Section. Detail.. Total fresh water produced. Flow rate (m3/h). 300. 250. 200. 150. 100 60. 62. 64. 66. 68. 70. 72. 74. 76. 78. 80. 78. 80. Time (days). Figure 4.15- Total Fresh Water Produced by the RO sections. Detail. Total power consumed Power consumed (kW). 700 600 500 400 300 200 100 60. 62. 64. 66. 68. 70. 72. 74. 76. Time (days). Figure 4.16- Total Power Consumed by the RO Sections and SWPs. Detail. Stored Seawater 8000. Stored seawater (m3). Flow rate (m3/h). 150. 7000 6000 5000 4000 3000 2000 1000 60. 62. 64. 66. 68. 70. 72. 74. Time (days). Figure 4.17- Stored Seawater in the Seawater Tank. Detail.. 34. 76. 78. 80.
(43) 4. FRESH WATER PLANT PROPOSAL. % Battery charge. % Battery charge. 100. 80. 60. 40. 20. 0 60. 62. 64. 66. 68. 70. 72. 74. 76. 78. 80. Time (days). Figure 4.18- % Battery Charge (100%-DOD in Percentage).Detail.. 4.5- Conclusions Using wave energy to produce desalinated water in offshore plants is studied, based on a system completely isolated from the electrical grid. Power consumption adapts to power production by connecting or disconnecting sections of the reverse osmosis and the seawater pumps. After presenting the proposed facility which consists of a desalination system, a seawater supply and short-term energy storage, a controller has been proposed, and some guidelines for sizing the plant for a specific location have been given. Using buoy data at the proposed location and a multi-component modelbased simulation makes possible to predict the water production. This proposal has been evaluated for one specific location (Atlantic Ocean), using buoy-measured data for sizing and predicting the production at this location. The design was then evaluated showing how the proposed design methodology makes it possible to desalinate water in a sustainable way.. 35.
(44) 5. HYDROGEN PLANT PROPOSAL. CHAPTER V HYDROGEN PLANT PROPOSAL 5.1- H2 Plant proposal For the proposed electrolysis application, a design such as the one in Figure 5.1 is proposed, that is adapted from a previous design for automated desalination in remote areas with renewable energies (see [22] for details); however, as the energy consumption of the desalination is much smaller than that of electrolyzers, the electricity consumption of the RO plant does not need to be directly balanced with the electricity production, so operation at different flows is not needed. Thus, frequency variators and automatically control dosifiers are not included in the proposed design. As has been explained in the introduction, power consumption adapts to power production by connecting or disconnecting sections of the electrolyzation plant (following a Smart Grid approach for the microgrid in the plant), and using a temporary storage of electricity for short-time balances and increase of autonomy (that is a relevant issue in offshore installations).. Wave Energy Batteries. Sea Water. Wave Converter. Electricity Section 1. Reverse Osmosis. Low conductivity Water. Section 2. . . .. Compressor 1 Low pressure Hydrogen. Section N. Electrolysis Figure 5.1-Process Diagram of the H2 Plant Proposal.. 36. Compressor 2. .. . Compressor N. Compression. High pressure Hydrogen.
(45) 5. HYDROGEN PLANT PROPOSAL. 5.1.1- Proposed desalination plant for low-conductivity water A typical concentration value of the seawater input is around 40000 μS/cm. There is a first stage that reduces the salt concentration to 170 μS/cm, and a second stage to achieve a concentration of less than 2 μS/cm, the concentration selected for the electrolyzers (other values of conductivity can be easily accommodated: the structure, energy consumption and cost of the desalination plant will not significantly vary as long as the output conductivity is in the order of a few μS/cm). One important parameter is the cost energy per m3 of water produced. In this plant, it is estimated to be about 2 kWh/m3.. Figure 5.2- Proposed Structure of the Desalination Plant for Low-Conductivity Water.. 5.2- Sizing proposal for the offshore hydrogen plant In the proposed facility a central aspect of the design for a specific location is the selection of sizes of components, in order to ensure autonomous operation of the facility without excessive capital or operation costs. In particular the following parameters should be selected: The rated power consumption of the electrolyzers P. (see section 3.3.1).. The rated flow of low-conductivity water that must be produced by the desalination plant Q. , and the corresponding flow of inlet seawater, Q. The volumes of seawater and low-conductivity water tanks (V respectively). The rated battery capacity C .. 37. . and V ,.
(46) 5. HYDROGEN PLANT PROPOSAL. In this kind of renewable energy installations it is important to take into account the variability of the source: for this, forecasts are usually needed. We assume that a significant record of data measured in the location where the wave converters would be placed is available (using buoys). Thus, the sizing of the proposed facility can be carried out based on the peak power P. of the wave converter and the measured data. As the. impact of the electrolyzer investment cost on the final cost of the H2 produced is high ([50]), it has already been mentioned ([51]) that in order to reduce the production costs, not all the energy captured should be transformed into hydrogen, as this would imply huge investment costs to consume the last Watt hours. Thus, it is assumed here that the rated energy consumption of the electrolyzers is smaller than the peak production of the Wave Energy Converters: the balance would be stored temporarily in batteries (or discharged if they were fully charged). The proposed methodology to select the plant parameters is then the following: i.. Using the measured data, the evolution of the power produced by the wave converters PW (t) is estimated.. ii.. The rated power consumption of the electrolyzers P. (see section 3.3.1), is. selected to ensure that the set of electrolyzers is fully in operation for at least λ % of the time (this parameter would be a trade-off between the cost of the electrolyzers and the cost of the wave converters, as part of the produced energy will not be used.). iii.. The required flow of water produced by the desalination system Q. can then. be calculated from the water that is required by the electrolyzers when all the set is in operation. The corresponding flow of inlet seawater Q. can be. directly calculated from the recovery ratio of the RO system. iv.. The tanks volumes are selected to ensure Da hours of autonomy at all times.. v.. The battery capacity C is selected to ensure W hours of autonomy at all times and DOD (see section 3.5) always between given limitsDOD. DOD.. 5.3- Control system for the offshore hydrogen plant A central component to ensure smooth operation of the facility is the control system that should constantly balance electricity production and consumption, by. 38.
(47) 5. HYDROGEN PLANT PROPOSAL. adapting the consumed loads (power of the pumps working in the reverse osmosis plant, the electrolyzers and the hydrogen compression). It is assumed that the control system is based on the following ideas: . When the production is higher than the consumption the energy is stored until the temporary storage system is nearly full; then sections of the electrolyzer and compression systems are switched on.. . When the storage system is almost empty sections of the electrolyzers and compression systems are switched off (these sections are then automatically cleaned and maintenance operation carried out).. . The desalination is just switched on/off depending on the amount of lowconductivity water stored in the tanks.. Figure 5.3- Control System for the H2 Plant Proposal.. 39.
(48) 5. HYDROGEN PLANT PROPOSAL. The control logic is summarized in the Sequential Function Chart in Figure 5.4, where the different stages in electrolysis process can be seen. Each electrolyzer produces 25 Nm3H2/h. Therefore, for each range of DOD values, there is a certain operating stage.. Figure 5.4- Sequential Function Chart of the Control Logic of the H2 Plant Proposal.. 5.4- Application to a case study To validate the proposed offshore hydrogen platform and the sizing methodology, a case-study was carried out for a specific location in the Atlantic Sea, selected by its good wave regime and proximity to potential hydrogen consumers. For this location, buoy data was measured for 165 days (wave heights, periods, water salinity and temperature, etc.). Based on this data, a platform was designed using the proposed sizing methodology with the following parameters in the models:. 40.
(49) 5. HYDROGEN PLANT PROPOSAL. . Reverse Osmosis plant: -. Q. = 11.4 m3/h. -. C. = 18 kg/m3. -. B =B = 0.01 m3/h·bar. -. A = A = 0.2 m3/h·bar. -. p. 52 bar. -. p. 1.5 bar. -. α = 0.003 bar·m3/Kg·K. -. ρ. -. g = 9.8 m/s2. -. ϑ. -. ϑ. . = 1000 kg/m3 =ϑ =ϑ. 0.54 = 0.55. Electrolysis: -. T. = 320 K. -. T. 293 K. -. σ. = 10000 S/m. -. i = 10000 A/m2. -. i. -. E. = 53990 J/mol. -. E. = 18912 J/mol. -. t = 0.0002 m. -. I. -. R. 8.314 J/mol·K. -. F. 96485 C/mol. . ,. = 10 A/m2. = 55000 A. Compression: -. γ = 1.41. -. V = 11.1 m3/kg. -. p. 1 bar. -. p. 200 bar. . Batteries: -. V=12 V. -. k = 1.12. -. η = 0.9 41.
(50) 5. HYDROGEN PLANT PROPOSAL. Based on the measurements and these parameters, the results of the sizing of the components following the procedure proposal in section 5.2 are the following: . P. . Q. = 11.4 m3/h.. . Q. = 0.066 m3/h.. . V = 45 m3.. . V = 1 m3.. . C = 3000 Ah (15·200 Ah).. 0.44 MW.. Figures 5.5 to 5.10 show the expected operation for the nominal parameters on 165 days with buoy measurements. It can be seen that the proposed system operates adequately: . As can be seen in Figure 5.5, the value of power provided by the wave converter varies between 0 and 1 MW due to the uniqueness of the wave conditions.. . Figure 5.6 shows the flow of hydrogen produced: it can be seen that the proposed controller adapts production to the available energy.. . Figure 5.7 depicts the used power. As expected, the electrolysis process consumes most of the power (four sections of 95 kW were assumed); compression consumes between 10 and 40 kW and RO consumes 20 kW when it is connected.. . It can be seen in Figure 5.8 the power balance of the plant (power supplied minus power consumed).. . The battery’s Depth of Discharge (DOD) changes along time as depicted in Figure 5.9: it evolves between the required range, without fully discharging or overcharging (which is known to significantly decrease battery life).. . Finally, Figure 5.10 depicts the amount of low-conductivity water stored.. 42.
(51) 5. HYDROGEN PLANT PROPOSAL. Wave power along time Maximun power (kW). 1000 800 600 400 200 0. 0. 20. 40. 60. 80. 100. 120. 140. 160. 140. 160. Time (days). Figure 5.5-Power Produced by the WEC of the Case Study.. Hydrogen flow (Nm3/h). Hydrogen 100 80 60 40 20 0. 0. 20. 40. 60. 80. 100. 120. Time (days). Figure 5.6 -Hydrogen Produced by the Electrolyzers of the Case Study.. Power consumed (kW). Converted power along time 400 RO Compression Electrolysis. 300 200 100 0. 0. 20. 40. 60. 80. 100. 120. 140. 160. Time (days) Figure 5.7-Power Consumed in each Section of the Platform of the Case Study.. Power supplied minus consumed. Power (kW). 1000. 500. 0. -500. 0. 20. 40. 60. 80. 100. Time (days). Figure 5.8-Power Balance of the Case Study.. 43. 120. 140. 160.
(52) 5. HYDROGEN PLANT PROPOSAL. DOD along time 1. DOD. 0.8 0.6 0.4 0.2 0. 0. 20. 40. 60. 80. 100. 120. 140. 160. Time (days). Figure 5.9-Evolution of the Depth-of-Discharge of the Battery of the Case Study. Tank level 3. Level (m). 2.5 2 1.5 1. 0. 20. 40. 60. 80. 100. 120. 140. 160. Time (days). Figure 5.10-Evolution of the Level of the Low Conductivity Water Tank.. Table 5.1 summarizes the total parameters and consumptions. This corresponds to a mean production of 1595 Nm3H2/day, consuming 4.2 kWh/Nm3H2 (that conforms to the 4.3 kWh/Nm3H2 reported in [46]): 88% is used in the electrolyzers, 9% in compression and 3% for desalination and other uses.. H2 produced (Nm3) 262000. Energy consumed in electrolysis (MWh) 1102. Energy produced by WEC (MWh) 1336. Fresh water produced (m3) 260. Seawater consumed (m3) 45030. Table 5.1-Results of the Total Parameters and Consumptions in the Case Study.. 5.5- Conclusions A proposal for using wave energy to produce hydrogen in offshore plants is studied in this section, based on a system completely isolated from the electrical grid, so a grid independent system is used, based on adapting power consumption to power production by connecting or disconnecting sections of the electrolyzation plant, and using a temporary storage of electricity for short-time balances. After presenting the. 44.
(53) 5. HYDROGEN PLANT PROPOSAL. proposal design of the facility, which consists of a desalination system, PEM electrolyzers and hydrogen compression, a controller has been proposed, and some guidelines for sizing the plant for specific locations have been given. These sizing is based on using buoy data at the proposed location (Atlantic Ocean), and a multi-component model-based simulation, which makes possible to reproduce the effect of measured sea conditions (height or wave period) on the hydrogen production. To demonstrate the feasibility of the proposed platform, this proposal has been evaluated for one specific location, using buoy-measured data for sizing the proposed platform at this location. The selected design was then evaluated in terms of hydrogen production and evolution of the platform parameters, such as the Depth-of-Discharge or the power consumed in each section of the plant, showing how the proposed design methodology makes possible to produce hydrogen in a sustainable way. Further work must be done to optimize the sizing of components based on an advanced control system. There are still many other open problems, such as the design of the structure that would contain the RO plant over the wave converter, and the selection of the most adequate method to transport water to the coast (water tanker, bladder).. 45.
(54) CONCLUSIONS AND FUTURE WORK. CONCLUSIONS AND FUTURE WORK This thesis studies two proposals for using wave energy to produce respectively fresh water and hydrogen in offshore plants, based on a system completely isolated from the electrical grid. A grid independent system is used based on adapting power consumption to power production by connecting or disconnecting sections of the electrolyzation plant and the high pressure pump of the Reverse Osmosis, using a temporary storage of electricity for short-time balances Both proposals have been evaluated for one specific location (Atlantic Ocean) to demonstrate the feasibility of the proposed platform, using buoy-measured data for sizing and predicting the production at this location. These sizing is based on using buoy data at the proposed location and a multi-component model-based simulation, which makes possible to reproduce the effect of measured sea conditions (height or wave period) on the selected which are fresh water and hydrogen production It is also analyzed the evolution of the platform parameters, such as the Depth-of-Discharge or the power consumed in each section of the plant. It is shown how the proposed design methodology makes possible to produce hydrogen in a sustainable way. An overall idea of H2OCEAN Project with its components, structure and the integration of this thesis into the Project is presented in chapter 1. Chapter 2 gives some information about previous works related with this thesis, and a description of the two proposals that will be proposed in the following chapters is done. A list of the different components that integrate the proposals (wave energy converters, water production, electrolysis, compression and short-term energy storage) with their models is proposed in chapter 3. Chapter 4 depicts the first proposal, fresh water production, which comprises a sizing methodology, a control system and an application to a case study. Finally, a description of the second proposal (hydrogen production) is presented in chapter 5, which has the same structure than the chapter before. The fresh water plant proposal is based on the article “Offshore desalination using wave energy” written by A. Serna and F. Tadeo which was published in the journal Advances in Mechanical Engineering. The hydrogen plant proposal is based on the paper “Offshore hydrogen production from wave energy” written by A. Serna and F. Tadeo which was published in The International Journal of Hydrogen Energy, while the. 46.
(55) CONCLUSIONS AND FUTURE WORK. proposed desalination plant for low-conductivity water is based on an article named “Evaluation of wave energy for a near-the-coast offshore desalination plant” written by A. Serna, D. Torrijos, F.Tadeo and K. Touati that was accepted in the World Congress on Desalination and Water Reuse (IDA) in Tianjin, China 2013 Moreover, this thesis has been awarded a Prometeo grant given by Universidad de Valladolid due to the innovative idea of the project, which prize consists of the record of the modeling of the proposals. Further work must be done to optimize the sizing of components based on an advanced control system, as it is indicated in one task in WP5 H2OCEAN. This advanced control system will be a MPC (Model Predictive Control), because it is the most adequate to minimize energy consumption and to balance production and consumption energy. Moreover, there is an extensive experience working with this kind of controllers in the Systems and Processes Engineering Department in Universidad de Valladolid.. 47.
(56) ACKNOWLEDGMENTS. ACKNOWLEDGMENTS This work was partly supported by MiCInn (DPI2010-21589-c05-05) and the European Commission (7th Framework Programme, grant agreement 288145, Ocean of Tomorrow Joint Call 2011). We also acknowledge GRUPO SETA S.L. for designing the Reverse Osmosis system and the Marine Institute of Ireland for collaboration in buoy measurements.. 48.
(57) REFERENCES [1] Davies PA. Wave-powered desalination: resource assessment and review of technology. Desalination, 186, 97-109, 2005. [2] Hicks DC, Mitcheson GR, Pleass CM, Salevan JF. Delbouy: Ocean wave-powered seawater reverse osmosis desalination systems. Desalination, 73, 81-94, 1989. [3] Crerar AJ, Low RE, Pritchard CL. Wave powered desalination. Desalination, 67, 127-137, 1987. [4] Serna A, Torrijos D, Tadeo F, Touati K. Evaluation of wave energy for a near-thecoast offshore desalination plant. World Congress on Desalination and Water Reuse (IDA). Tianjin, China 2013 (accepted). [5] Folley M, Whittaker T. The cost of water from an autonomous wave-powered desalination plant. Renewable Energy, 34 (1), 75-81, 2009. [6] Folley M, Peñate Suarez B, Whittaker T. An autonomous wave-powered desalination system. Desalination, 220 (1), 412-421, 2008. [7] Tadeo F, Val R, Palacin LG, de Prada C, Salazar J. Control of reverse osmosis plants using renewable energies, control and application. Proc. UKACC’09, Cambridge, UK, 2009. [8] Seibert U, Vogt G, Brennig C, Gebhard R, Holz H. Autonomous, desalination system concepts for seawater and brackish water in rural areas with renewable energies. Desalination, 168, 29–37, 2004. [9] Charcosset, C. A review of membrane processes and renewable energies for desalination. Desalination, 245(1), 214-231, 2009. [10] Bockris JO´M, Veziroglu TN, Smith D. Solar Hydrogen Energy: The Power to Save the Earth. London: Optima; 1991. [11] Sherif SA, Barbir F, Veziroglu TN, Wind energy and the hydrogen economy— review of the technology, Solar Energy 2005, 78, 647-660. [12] Dutton AG, Bleijs JAM, Dienhart H, Falchetta M, Hug W, Prischich D, Ruddell, AJ. Experience in the design, sizing, economics, and implementation of autonomous wind-powered hydrogen production systems. International Journal of Hydrogen Energy, 2000, 25, 705-722.. 49.
(58) [13] Ghribi D, Khelifa A, Diaf S, Belhamel M. Study of hydrogen production system by using PV solar energy and PEM electrolyser in Algeria.International Journal of Hydrogen Energy. 2012. In press. [14] Joshi AS, Dincer I, Reddy BV. Solar hydrogen production: A comparative performance Assessment. International Journal of Hydrogen Energy 2011, 36, 11246-11257. [15] Antonia O, Saur G. Wind to Hydrogen in California: Case Study, National Renewable Energy Laboratory, Technical Report NREL/TP, 5600-53045, 2012. [16] Clément A, McCullen P, Falcão A, Fiorentino A, Gardner F, Hammarlund K, et al. Wave energy in Europe: current status and perspectives. Renewable and Sustainable Energy Reviews 2002 6 (5), 405-431. [17] Temeev AA, Belokopytov VP, Temeev SA. An integrated system of the floating wave energy converter and electrolytic hydrogen producer. Renewable energy 2006, 31 (2), 225-239. [18] Morse AP. U.S. Patent No. 7872363. Washington, DC: U.S. Patent and Trademark Office 2011. [19] Morse AP. U.S. Patent No. 7228812. Washington, DC: U.S. Patent and Trademark Office 2007. [20] Musial W, Butterfield S, Boone A. Feasibility of floating platform systems for wind turbines. In A Collection of the 2004 ASME Wind Energy Symposium Technical Papers Presented at the 42nd AIAA Aerospace Sciences Meeting and Exhibit, 5–7 January 2004, Reno Nevada, USA 476-486. [21] Jovcic D, Strachan N. Offshore wind farm with centralised power conversion and DC interconnection. Generation, Transmission & Distribution, IET 2009; 3 (6), 586-595. [22] Palacin LG, Tadeo F, de Prada C, Elfil H, Salazar J., Operation of desalination plants using hybrid control, Desalination and Water Treatment. Volume 25 119126, 2011. [23] Serna A, Tadeo F. Offshore hydrogen production from wave energy. International Journal. of. Hydrogen. Energy,. 10.1016/j.ijhydene.2013.04.113]. 50. 2013.. [In. press. DOI:.
(59) [24] E. D. Stoutenburg, N. Jenkins, M. Z. Jacobson, “Power output variations of colocated offshore wind turbines and wave energy converters in California,” Renewable Energy, 35, 2781-2791, 2010. [25] Ziogou C, Ipsakis D, Seferlis P, Bezergianni S, Papadopoulou S, Voutetakis S. Optimal production of renewable hydrogen based on an efficient energy management strategy. 2013 Energy. (In press). [26] Babarit A, Hals J, Muliawan MJ, Kurniawan A, Moan T, Krokstad J. Numerical benchmarking study of a selection of wave energy converters. Renewable Energy 45 44-63, 2012. [27] Henderson R. Design, simulation and testing of a novel hydraulic power take-off system for the pelamis wave energy converter. Renewable Energy 31 (2), 271-83, 2006. [28] Eriksson M. Modelling and experimental verification of direct drive wave energy conversion –Buoy- generator dynamics, PhD thesis, Uppsala Universitet; 2007. [29] Ruellan M, Ben Ahmed H, Multon B, Josset C, Babarit A, Clément AH. Design methodology for a SEAREV wave energy converter. IEEE Transactions on Energy Conversion 25 (3), 760-7, 2010. [30] Thorpe TW.A Brief Review of Wave Energy. A report produced for the UK Department of Trade and Industry, ETSU-R120:24-25. Harwell, UK. 1999. [31] Garcı́a-Rodrı́guez L. Renewable energy applications in desalination: state of the art. Solar energy, 75 (5), 381-393, 2003. [32] Lomholt HN, Shim S. Milestone 6 report. Selection of the electrolyzing technology for design phase based on preliminary results. DTU Energy Conversion/FCH Test Center, March 2013. [33] Di Blasi A, Andaloro L, Siracusano S, Briguglio N, Brunaccini G, Stassi A, et al. Evaluation of materials and components degradation of a PEM electrolyzer for marine applications. International Journal of Hydrogen Energy 2012. In press. [34] Wilf M. The Guidebook to Membrane Desalination Technology, Balaban Desalination Publication, L’Aquila, Italy, 2007.. 51.
Figure

+7

Documento similar
As seen previously on subsection 3.3.1 the storms were characterized and classified based on the storm energy content, which was acquired using a combination of wave height
For most of the oxidative pathway mutants studied in this work (gltA; acnA, B; icdA, C), the specific hydrogen production (Y H2/X ) was significantly lower than for the wild type
The goal of this PhD thesis is to propose energy-aware control algorithms in EH powered vSCs for efficient utilization of harvested energy and lowering the grid energy consumption
The sensitivity of a long-baseline experiment using Hyper-K and the J-PARC neutrino beam is studied using a binned likelihood analysis based on the reconstructed neutrino
In the edition where the SPOC materials were available, we have observed a correlation between the students’ final marks and their percentage rate of
In order to get accurate vibrational wave functions and en- ergies, the potential energy curves corresponding to the different electronic states of H + 2 were obtained using the
In order to extract dynamical information about the excited wave packet associated to the 2pσ u state, we will study the energy-differential ionization probabilities for
Abstract: The inclusive b-jet production cross section in pp collisions at a center-of- mass energy of 7 TeV is measured using data collected by the CMS experiment at the LHC..
