Performance analysis of scheduling algorithms in Next Generation Networks
6
0
0
Texto completo
(2) > REPLACE THIS LINE WITH YOUR PAPER IDENTIFICATION NUMBER (DOUBLE-CLICK HERE TO EDIT) <. 1. Performance Analysis of Scheduling Algorithms in Next Generation Networks Juan C. Cuéllar Q. MSc(C) - Andrés Navarro C.,PhD. Dpto. Tecnologías de Información y Comunicaciones. Universidad Icesi Abstract— QoS in Convergent networks is widely discussed item in IP networks. But with the implementation of the Next Generation Networks by most operators around the world, QoS for different services and applications must fulfill. In order to deal with this problem, we simulate end to end QoS parameters, according to ITU Y.1540 and Y.1541 recommendations and different scheduling algorithms proposed by manufacturers and the literature. In this paper we show the results for such simulations for voice over IP service in different load conditions. Index Terms—QoS, Y.1540, Y.1541, IPTD, IPDV, CQ, PQ.. I. INTRODUCTION. C. ongestion in a core network implies service degradation and final user dissatisfaction. Few years ago, most transport networks carry only data and such parameters like end-to-end delay or packet losses was not so stringent. With convergent networks concept and new applications like VoIP (Voice over IP), videoconference, video streaming and so on, situation has changed notoriously. Nowadays, most core networks carry different kinds of traffic over the same bit stream, with different requirements about delay, packet loss and others that can guarantee an adequate operation from the user point of view. Most communications networks are transforming into Next Generation Networks (NGN) or convergent networks, using the same protocols to carry different kind of services and applications. This scenario demands some quality of service (QoS) mechanisms that can guarantee the correct operation of the network with multiple services. On the access networks side, such mechanisms have been proposed by different standardization organisms such as DSL Forum (Now Broadband Forum) [2][3] and Cable Labs[1]1], according to their respective communications Architectures, DSL and HFC respectively. On the core network side, both MPLS ([4][5]and [6]) and Carrier Ethernet ([7]), offers QoS mechanisms according to their specific architecture. Besides the inherent behavior of access technology and core technology, network devices must be configured according to manufacturer recommendations, in order to provide an adequate operation of the entire network ([8] [9][10][11]). Once the QoS mechanism has been set both in access network and Core network, it is important to define an end to end QoS. standardized parameters, which allows verifying quantitatively the performance for each service in the network. Such issue has been defined by the International Telecommunications Union, Telecommunications Standardization Sector (ITU-T) defined recommendations Y.1540[12] and Y.1541[13]. Recommendation Y.1540 defines QoS parameters for IP networks, while recommendation Y.1541 defines numerical values for such parameters in Y.1540. Also, Broadband forum introduces the concept of Quality of Experience (QoE) in its technical report TR-126[14], in order to measure application performance from the user viewpoint. Then, using aforementioned recommendations, we can measure or simulate quantitatively the behavior of any service or application on an NGN network. QoS mechanisms currently in use by most operators are “by default” in each connectivity device, mainly because available bandwidths in the core are larger enough and no congestion is experienced with the services used by users. However, with the implementation of new services like IPTV, Streaming, Video on Demand and the migration of voice services to IP networks, perhaps the QoS behavior change drastically. This new scenario is our motivation to analyze and compare QoS mechanisms and scheduling algorithms, according to the parameters established in Y.1540 and Y.1541 recommendations. In order to reach our goal, we define a simulation scenario with different configurations, using OPNET Modeler 14.5[15], and implementing scheduling algorithms in the tool. The paper is organized as follows: In section II we describe ITU-T recommendations Y.1540 and Y.1541, in section III, simulation scenario is described; in section IV. we show results and in section V. some conclusion are exposed. II. ITU-T RECOMMENDATIONS Y.1540 Y Y.1541 ITU recommendation Y.1540 defines parameters to specify QoS according to velocity, precision, operation safety and transfer availability in IP networks. Specified parameters are established for end to end connection, point to point and specific networks segments. Four parameters are defined in the recommendation:[12][16] IPTD (IP Packet Transfer Delay ) : Refers to the time used by an IP packet to traverse trough a network element..
(3) > REPLACE THIS LINE WITH YOUR PAPER IDENTIFICATION NUMBER (DOUBLE-CLICK HERE TO EDIT) < This element can be a router, host, or a network segment. It is a critical parameter in a NGN network. IPDV (IP Packet Delay Variation): It refers to jitter or the expected time of arrival for an IP packet. IPLR (IP Packet Loss Ratio): It refers to the ration between the total transmitted packets and the lost packets on a specific data flow. IPER (IP Packet Error Ratio): Refers to the number of packets in error. It is obtained dividing the total transmitted packets between the packets with errors in a data flow. Recommendation Y.1541 defines different Types of Services for NGN networks and also specifies the accepted values for each parameter on recommendation Y.1540, according to each Type of Service. Defined values in Y.1541 are shown in Table 1.. 2. III. NETWORK TOPOLOGY Network layout implemented for the simulations is shown in Figure 1. In this paper, we do not analyze routing protocol convergence time [17][18] neither control information impact[19],[20] or implementation aspects about routing protocols[21]. We will focus on scheduling algorithms analysis and comparison in congestion conditions. Algorithm behavior is analyzed using IPTD and IPDV parameters, according to the values specified in Y.1541 recommendation for the services simulated. Network architecture consists of three MPLS routers [22], responsible for labeling and routing of packets. WAN links have a bandwidth of 1544Kbps. We choose MPLS, because is a well know technology, frequently used by core network operators and allows QoS management.. For each Type of Service defined in Y.1541, some applications and services are defined, as shown next: Class 0-1: Real time applications, delay sensitive and with high user interaction such as VoIP, videoconference and real audio. Class 2-3: Interactive Transactional data applications like web browsing. Class 4: Loss tolerant applications and delay tolerant, like video streaming, file transfer, etc. Table 1. QoS parameters defined in Y.1541 [13]. Figure 1 Network layout implemented for simulations.. Each LAN consists of 10 workstations capable of ftp, http, VoIP and Video. Each service has a Uniform traffic distribution, with settings that are shown in Table 2. Uniform distribution was selected in order to reach the maximum capacity of each link in the core. For ftp traffic we use a file size of 700Kbytes. For VoIP we use a G.711 codec and the simulation time was 10 minutes for each simulation. Table 2 Traffic characteristics for each application.. Depending of each application type, network administrator can allocate the specific or required Type of Service that guarantees the performance. According to those ITU recommendations, we define the simulation parameters and analyze results for each defined parameter, according to Table 1.. We configured the simulation giving priority to VoIP and Video, because such applications have stringent requirements of QoS and are very popular in current networks. In Table 3 is shown the Type of Service identification tag used, according to Y.1541..
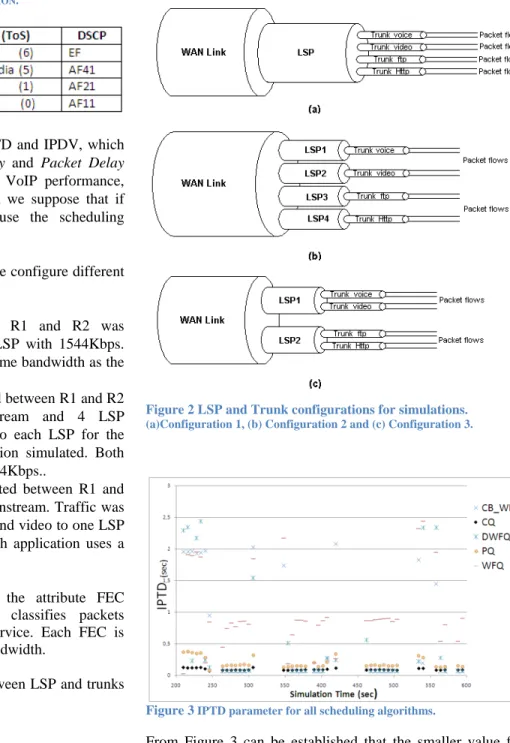
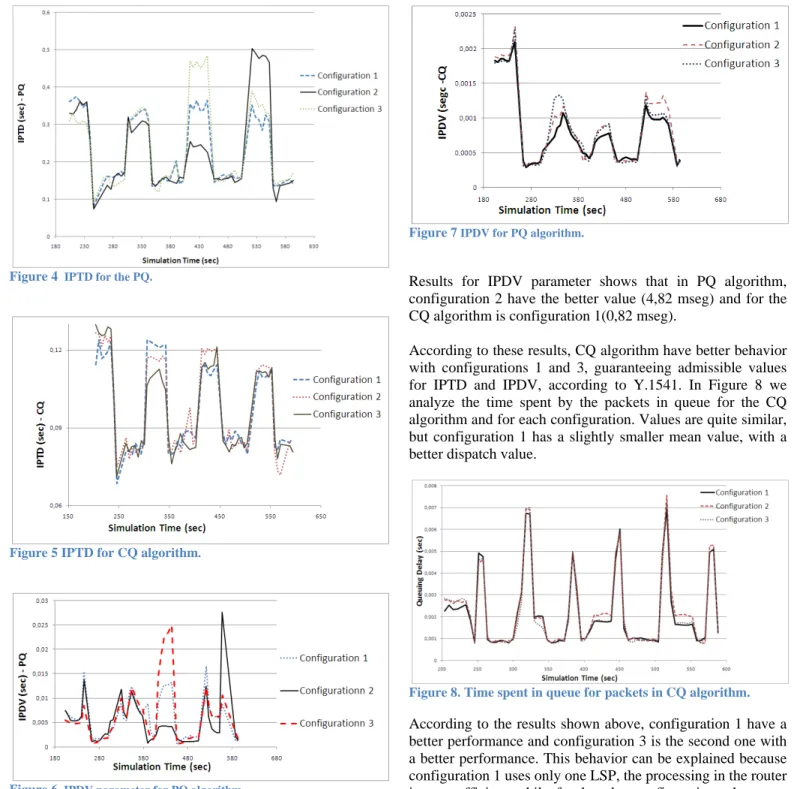
(4) > REPLACE THIS LINE WITH YOUR PAPER IDENTIFICATION NUMBER (DOUBLE-CLICK HERE TO EDIT) <. 3. Table 3 TRAFFIC LABELING FOR EACH APPLICATION.. Parameters of Y.1541 analyzed were IPTD and IPDV, which corresponds to Packet End-to-End Delay and Packet Delay Variation in OPNET. We analyze only VoIP performance, because is perhaps the most critical and we suppose that if voice have a good behavior is because the scheduling algorithm is doing its work. For the architecture shown in Figure 1, we configure different scenarios, according to Figure 2. - Configuration 1: Between routers R1 and R2 was configured a forward LSP and Back LSP with 1544Kbps. Each application has a trunk with the same bandwidth as the LSP. - Configuration 2: One LSP was created between R1 and R2 for each application (4 LSP upstream and 4 LSP Downstream). A trunk was assigned to each LSP for the application, i.e. one trunk for application simulated. Both trunk and LSP bandwidth was set to 1544Kbps.. - Configuration 3: Two LSP was created between R1 and R2, Two for upstream and two for downstream. Traffic was divided between LSP, assigning voice and video to one LSP and ftp and http to the other LSP. Each application uses a trunk of 1544Kbps.. Figure 2 LSP and Trunk configurations for simulations. (a)Configuration 1, (b) Configuration 2 and (c) Configuration 3.. OPNET modeler allows to configure the attribute FEC (Forwarding Equivalence Class), that classifies packets according to IP address or Type of Service. Each FEC is assigned to one trunk with established bandwidth. In Figure 2 is shown the relationship between LSP and trunks for each configuration explained above. IV. RESULTS Algorithms analyzed in each configuration were: WFQ (Weighted Fair Queueing), CB-WFQ (Class-Based Weighted Fair Queueing), DWFQ (Class-based Distributed Weighted Fair Queueing, CQ (Custom Queueing), PQ (Priority Queueing). After the simulations, we can observe that the better values of IPTD and IPDV was obtained for PQ and CQ scheduling mechanisms, according to results presented in [8], where a variation of PQ is suggested (LLQ) for VoIP and videoconference. In Figure 3 is shown IPTD results for all the scheduling algorithms analyzed for Configuration 1, for voice service.. Figure 3 IPTD parameter for all scheduling algorithms.. From Figure 3 can be established that the smaller value for IPTD is obtained for PQ and CQ. According to this results, we will show only the results for CQ and PQ in each configuration simulated, for voice service. In our case, we have assigned bigger priority to voice than video. On Figure 4 we show the IPTD parameter for all three configurations with PQ algorithm, and in Figure 5 results for CQ algorithm. In Figure 6 we show IPTD results for all the three configurations for the PQ algorithm. In Figure 7, the same results for CQ algorithm are shown..
(5) > REPLACE THIS LINE WITH YOUR PAPER IDENTIFICATION NUMBER (DOUBLE-CLICK HERE TO EDIT) <. 4. Figure 7 IPDV for PQ algorithm. Figure 4 IPTD for the PQ.. Results for IPDV parameter shows that in PQ algorithm, configuration 2 have the better value (4,82 mseg) and for the CQ algorithm is configuration 1(0,82 mseg). According to these results, CQ algorithm have better behavior with configurations 1 and 3, guaranteeing admissible values for IPTD and IPDV, according to Y.1541. In Figure 8 we analyze the time spent by the packets in queue for the CQ algorithm and for each configuration. Values are quite similar, but configuration 1 has a slightly smaller mean value, with a better dispatch value.. Figure 5 IPTD for CQ algorithm.. Figure 8. Time spent in queue for packets in CQ algorithm.. Figure 6. IPDV parameter for PQ algorithm.. From the results for IPTD parameter, it can be observed that Configuration 2 outperforms the rest for PQ (with a mean of 230,36 mseg), but for CQ analysis configuration 3 performs better than the rest (with a mean of 96,93mseg). CQ algorithm has the minimum value of IPTD and guarantee the value established in Y.1541.. According to the results shown above, configuration 1 have a better performance and configuration 3 is the second one with a better performance. This behavior can be explained because configuration 1 uses only one LSP, the processing in the router is more efficient, whilst for the other configurations, the router must to process more information and send more signaling. From the point of view of an operator, it is advised to separate different types of traffic on different LSPs, at least one LSP for real time traffic, and another for non real time. Additionally, the CQ configuration could impact the performance of other applications. The operator must fin the tradeoff for an adequate configuration of CQ parameters for each service. Another consideration is to keep the load of WAN links below 80%, in order to guarantee the service for real time applications under high congestion conditions..
(6) > REPLACE THIS LINE WITH YOUR PAPER IDENTIFICATION NUMBER (DOUBLE-CLICK HERE TO EDIT) < V. CONCLUSIONS QoS in an NGN network depends not only of the scheduling algorithm, but also the network topology and devices. QoS in access network and Core network must be configured separately, but according to Y.1541 recommendation. For access networks, not only Y.1541 must be considered, but also technical report TR-126, that specifies different subjective and objective tests associated with QoS, like MOS (Mean Opinion Score)[23] and PESQ (Perceptual Evaluation of Speech Quality ). As objective tests ITU E-Model [24] is very useful and utilizes 15 parameters in order to estimate R ( Transmission Rating ), which simplify comparisons between different kinds and voice quality parameters. MPLS performs well under Y.1541 parameters and supports NGN core, with an adequate configuration of trunks and LSP. According to results shown in this paper, it is recommended to use LP for each kind of traffic, making a separation between real time and non-real time.. REFERENCES [1] [2]. [3] [4] [5]. [6] [7]. [8] [9]. [10]. [11] [12] [13] [14] [15] [16] [17]. [18]. [19]. [20]. D. Fellows, D. Jones. DOCSIS Cable Modem Tecnology. IEEE Communications Magazine March 2001. Techinical Report DSL Forum TR-059. DSL Evolution – Architecture Requeriments for the Support of QoS- Enabled IP Services. Septiembre 2003. S. Wright.,T. Anschutz. QoS Requeriments in DSL Networks. 0-78037975-6/03. 2003 X. Xiao, A. Hannan , B. Bailey , L. Ni Traffiici Engineering with MPLS in the Internet. IEEE Network. March/ April 2000. T. Onali, L. Atzori. Traffic Classification and Bandwidth Management in DiffServ-aware Traffic Engineering Architectures. IEEE ICC 2008 Proceedings. S. Alvarez , QoS for IP/MPLS Networks. Cisco Press. 2006. L. Fang , R. Zhang, M. Taylor. Services – Requirements and Deployment Case Studies. IEEE Communications Magazine. March 2008. Cisco Systems. Cisco IOS Quality of Service Solutions Configuration Guide. 2003. Understanding and Configuring MDRR/WRED on the Cisco 12000 Series Internet Router. Doc ID 18841, http://www.cisco.com/warp/public/63/mdrr_wred_overview.html. Huawei Documentation. Version 07(2008-09-17). SmartAX MA5600/MA5603 Multi-service Access Module Electronic Documentation. Cisco Systems. Implementing Cisco Quality of Service v2.1. 2004. ITU-T Rec. Y.1540, IP Packet Transfer and Availability Performance Parameters. Dec. 2002. ITU-T Rec. Y.1541, Network Performance Objetives for IP-Based Services” Feb 2006. Technical Report TR-126. Triple-play Services Quality of Expirience (QoE) Requirements. BroadBand Forum. Dec. 2006. http://www.opnet.com Medición de la Calidad del Servicio. Grupo de Expertos NGN – CINTEL Colombia. Interactic Feb 2009. J.L Sobrinho, Algebra and Algorithms for QoS path computation and hop-by-hop rounyting in the Internet. IEEE/ACM Trans. Netw, vol 10, No.4.pp 541-550.Aug 2002. J.L Sobrinho, “Network Rounting with path vector protocols:Theory and applications. Proc. ACM SIGCOMM 2003, Karlsruhe, Germany, Aug 2003, pp 40-60. G. Apostolopoulos, R. Guérin, S, Kamat, and S.K Tripathi. Quality of Service based routing: A performance perpestive. Proc. ACM SIGCOMM 1999 Cambridge, MA. Aug 1999, pp 215-226. A. Shaikh, J. Rexford, and K. Shin, Load-sensitive routing of long-lived IP flows, Proc. ACM SIGCOMM 1999 Cambridge, MA. Aug 1999, pp 215-226.. View publication stats. [21] G. Apostolopoulos, D. Williams, S.Kamat, R.Guerin, A. Orda and T. Przygiend. QoS routing mechanisms and OSPF extensions. RFC 2676 Aug. 1999. [22] J. Evans. C. Filsfils. Deploying IP and MPLS QoS for Multiservice Network. Morgan Kaufmann Publishers. 2007 [23] ITU-T Rec. P.800.1 July 2006. [24] ITU-T Rec. G.107. Aug 2008.. 5.
(7)
Figure
![Table 1. QoS parameters defined in Y.1541 [13]](https://thumb-us.123doks.com/thumbv2/123dok_es/3527684.622043/3.918.495.825.373.647/table-qos-parameters-defined-in.webp)
Documento similar
Continuous Petri nets can be seen as a relaxation of discrete models allowing more efficient (in some cases polynomial time) analysis and synthesis algorithms..
Basic properties include monotonicity, so dimension 1 classes are maximal and dimension 0 ones are minimal, and the fact that dimension is defined for every class X, making
Interoperability between software systems, based on distributed-object tech- nology, is enabled and supported by communication middleware mechanisms such as the Common Object
High-performance liquid chromatography- ultraviolet detection method for the simultaneous determination of typical biogenic amines and precursor amino acids. applications in
Bouvry, “Assessing performance of Internet of Things-based mobile crowdsensing systems for sensing as a service applications in smart cities,” in IEEE International Conference on
The following fields are filled in for each programme: title, day, time and duration of the broadcast, channel it was shown on, news associated with the programme
The pragmatic analysis has shown the communicative impact of colour idioms in the British press, as evidenced in their high occurrence and degree of variation.. At the same
Given the importance of the minutiae extraction process with latent fingerprints in forensic applications, in this work we compare and analyze the performance of automatic and
