FraMCoS-X G. Pijaudier-Cabot, P. Grassl and C. La Borderie (Eds)
SHEAR BEHAVIOUR OF POLYOLEFIN AND STEEL FIBRE-REINFORCED
CONCRETE
M.G. ALBERTI†, A. PICAZO††, A. ENFEDAQUE† AND J.C. GÁLVEZ† †
Escuela Técnica Superior de Ingenieros de Caminos, Canales y Puertos, Universidad Politécnica de Madrid. C/ Profesor Aranguren, 3, 28040, Madrid, Spain
††
Escuela Técnica Superior de Edificación, Universidad Politécnica de Madrid. Avda. Juan de Herrera, 6, 28040 Madrid, Spain
e-mail: marcos.garcia@upm.es e-mail: a.picazo@upm.es e-mail: alejandro.enfedaque@upm.es
e-mail: jaime.galvez@upm.es
Keywords: Shear strength, fibre-reinforced concrete,push-off test, digital image correlation
Abstract: Since the first appearance of concrete, various approaches have been taken in order to
improve the behaviour of the material when subjected to tensile and bending stresses. Such approaches have provided enhancements in the ductility of the composite material. One of such approaches entails the addition of fibres in the concrete bulk mass. This has been employed in everyday practice in slabs, precast tunnel linings and pipes for more than 50 years. The contribution of fibres to the mechanical properties of concrete enable, if certain requirements are complied with, a reduction or even substitution of the steel bars found in reinforced concrete.
The contribution of fibres to structural design can be contemplated only if several conditions are met. Such conditions are established by certain recommendations, with the Model Code 2010 (MC2010) being the most widely accepted. MC2010 describes the residual stresses that should be borne by the fibre-reinforced concrete (FRC) when performing three-point bending tests on notched specimens, assessed according to EN-14651.
Shear stresses should also be taken into account in the structural design. In addition, fibres might contribute to the shear strength of the FRC. However, at the time of writing there has been little published research regarding this. This contribution seeks to improve the current state of the art concerning the behaviour of FRC with steel (SFRF) and polyolefin (PFRC) fibres subjected to fracture under mode II condition. Both fibres are considered as structural ones in several concrete national codes and regulations.
In order to do so, an experimental campaign was designed based on shear push-off tests. Conventional monitoring techniques were complemented with digital image correlation (DIC) systems. DIC permitted detection of the onset and development of cracks during the tests, featuring the cracking patterns of SFRC and PFRC subjected to shear stresses.
The results showed that changes in the fibre type modified the mechanical behaviour of the materials studied. Moreover, the ductility of SFRC and PFRC alike were assessed and the fracture energy obtained. The combination of the conventional measuring techniques and DIC allowed correlation of the cracking development with the mechanical behaviour during the test.
1 INTRODUCTION
While plain concrete boasts remarkable compressive strength, both tensile and bending strength are low. In addition, concrete shows a reduced ductility and can be considered as a quasi-brittle material [1]. In order to improve the behaviour of concrete under such circumstances, steel bars have conventionally been used. Another option employed entails adding a certain amount of short fibres, randomly distributed in the bulk fresh concrete. Such fibres can be manufactured by using steel, glass, carbon, aramid or polymers. Since the birth of this reinforcement technique, published research has highlighted the contribution that fibres might have to the structural reinforcement of concrete. Some of the first studies dealt with the contribution and use of steel fibres [2, 3]. More recently, fibres manufactured with other raw materials have been developed, with them being capable of improving the mechanical behaviour of plain concrete [4, 5]. Among these fibres are the synthetic ones recently developed by the plastic industry. When added in certain amounts to concrete, they have been able to meet the requirements set in MC2010 [6] and might be considered as a structural reinforcement. Polymeric fibres confer to concrete post-cracking residual strength while reducing the wear in concrete-placing machinery. Moreover, due to their non-metallic nature they are numb to the corrosion process [7]. Based on the previous arguments, both MC2010 [6] and the Spanish recommendation for structural concrete EHE-08 [8] consider the option of using polymeric fibres as structural ones.
Several studies have shown that polymer fibres, when added to concrete in certain dosages, might reduce or even eliminate the steel stirrups used to sustain the shear stresses [9-11].
If the fibres are to be considered as a structural reinforcement [12], the FRC manufactured is required to meet certain residual strength values set by certain regulations. One of the most used
recommendations is EN-14651 [13]. The residual strength values previously mentioned are obtained by subjecting the sample to a flexural stress state (it should be highlighted that such strength values are also considered apt for the shear structural design of the concrete element). However, recent research has shown that this approach is imprecise.
Although research regarding the concrete behaviour subjected to fracture Mode II has been carried out, there remain some aspects that merit analysis. One of the main questions entails quantifying the mechanisms involved in concrete shear failure, tangential tensions in the non-cracked area of concrete, aggregate interlock, dowel action, the arch effect and residual stresses of traction in the cracks [14].
Lastly, it should be noted that use of fibres in concrete prevents the opening of the cracks as a consequence of multi-cracking. This behaviour improves the performance of the material when subjected to bending and shear stresses. It is also significant to note that conventional stirrup reinforcement has greater toughness and strength than FRC [15]. Nevertheless, the absence of handling and reinforcement placement places the FRC in an advantageous position regarding the final cost of the structure [16].
2 OBJECTIVES
The main objectives of this work are to study the behaviour of FRC in fracture Mode II and compare the residual strengths obtained with the ones derived from the flexural tests prescribed in the recommendations. For this purpose, push-off specimens were obtained from the halves resulting from tests performed following EN-14651. The push-off specimen can be defined as a prism with two notches that form a ligament zone, in which the shear force is applied that causes the failure on Mode II [17]. Figure 1 shows a push-off test. During the test the applied load and the sliding, a shear crack opening is registered. By evaluating these parameters and the surface of the ligament, the influence of the concrete types and effect of the fibres can be assessed.
Carga
Carga
Load
Load
Figure 1: Push-off test.
Another objective of the present study was to determine the cracking patterns through a digital image correlation (DIC) system. Such patterns will be combined with the data regarding the mechanical response in the material in future research. It is worth noting that DIC does not interfere with the test, since there is no contact with the specimen. Similar systems have been employed with notable success in previous studies found in the literature [18, 19].
This contribution is a continuation of a study regarding the influence of the fibres on the flexural response of FRC. Such a study was performed by designing and manufacturing two types of concrete and afterwards testing them following the recommendation EN-14651. Consequently, the fresh, hardened and flexural properties were known prior to the present analysis [20]. The two polyolefin-fibre-reinforced concretes (PFRC) tested were a low-performance one and a medium-compressive-strength one. The low-performance one was reinforced with 48 mm long polyolefin fibres (PFRC6) and a volumetric fraction (Vf) of 0.66%. The other
was a self-compacting concrete reinforced with 60 mm long polyolefin fibres (PFRC10) and Vf =1.11%. Complementary to these two
mixes, another two combinations of medium- performance concrete were studied: with 35 and 50 mm long steel fibres (SFRC50 and SFRC70), with high-compression strength and
Vf of 0.64% and 0.89%. Table 1 shows the
length of the fibres and dosage, as well as the concrete compressive strength. With these four concretes, information regarding the shear behaviour of Mode II of the FRC was obtained, both in the initial load branch and in residual stress post-cracking.
Table 1: Fibre dosage (kg/m3), length of the fibres (mm) and concrete compressive strength (MPa)
F.Dosage F.Length fcm PFRC6 6 48 21.7 PFRC10 10 60 51.5 SFRC50 50 35 62.2 SFRC70 35+35 35 & 50 66.8 3 EXPERIMENTAL CAMPAIGN
The specimens used in the experimental campaign were obtained from the remaining halves that resulted from the EN-14651 tests of a previous research study. Given that these halves were machined to remove the area that might have been damaged during the flexural tests, the mechanical properties of the material were those of the non-tested specimens. The prisms obtained were machined by using a water-cooled circular saw in order to obtain two 75 mm notches. The cantilevers of the upper and bottom zones of the specimens were reinforced by gluing carbon fibre with epoxy to the front and rear surfaces. Such laminates prevented the appearance of cracks during the test and allowed the failure in the ligament caused by the shear stresses to be assured. In order to measure the relative movement of the lips of the notches, two linear variable differential transformers (LVDTs) were placed in the sides of the specimen which allowed detection of any rotation during the test. Moreover, the front and rear surfaces were painted with a random-monochrome-dotted pattern [21], to allow DIC to detect the appearance and development of cracks during tests.
Tests were conducted by using a universal testing machine with a maximum load capacity of 500 kN. They were controlled by the displacement of the actuator which was set at a speed of one micron per second. The load was applied to two steel bars with a section of
10x10 mm2 placed on the top and on the bottom of the specimen. Such bars concentrated the stresses in the ligament section, ensuring the shear failure of the ligament. The perfect alignment of the steel bars was of capital importance in order to obtain the desired stress state. Consequently, the tips of both notches and the steel bars were aligned with the assistance of a laser level and with extreme care. In addition, two high-definition five-megapixel video cameras were used to record the front and rear faces of the specimens during testing.
4 RESULTS AND ANALYSIS
The main data recorded during the push-off tests were the load and shear displacement. With these results and by knowing the surface of the ligament, the average shear stress was obtained by following equation (1). L stands for the load applied (N) and S for the area of ligament (mm2). By using the average shear stress, a comparison among the behaviours of the four concretes tested was carried out.
med = L / S (1)
Figure 2 provides the stress-displacement data obtained for all the mixes of concrete analysed. The curves shown are the average of at least two tests. It should be noted that as the scattering of the experimental results was scarce, the average curves can be considered as statistically representative. All the concretes showed a linear ascending branch at the beginning of the test which was related to the matrix properties of a plain concrete. In the case of the SFRC mixes, the final value of the branch was also influenced by the fibre content. It can be also perceived that in PFRC6 the final part of this branch might be related to the compressive strength of the concrete matrix.
After the aforementioned region, the concrete matrix cracks and the load is progressively transferred to the fibres. In this case, the steel fibres boast a higher load capacity than polyolefin fibres if only reduced crack openings are compared. The descending branch that follows the peak load is less abrupt
in the case of the SFRC mixes than in the case of PFRC10 which has the same plain concrete mix. In addition, the behaviour of PFRC6, which boasted a reduced compressive strength, showed a remarkable load-bearing capacity in the post-cracking region.
0 5 10 15 20 0.0 0.5 1.0 1.5 PFRC6 PFRC10 SFRC50 SFRC70 A ve r age S h e a r (M P a) Shear slide (mm)
Figure 2: Average shear strength vs shear slide up to 1.5 mm.
It should be pointed out that the differences in behaviour among the concretes analysed disappear for displacements greater than 1 mm, as can be seen in Figure 3. A residual shear tension, which ensures the ductile concrete behaviour (even with low proportions of fibres) is maintained in each case. From 2 mm of shear displacement, both mixes with polyolefin fibres show a residual behaviour that exceeds the corresponding one of SFRC50, which has a Vf = 0.64%. This is
consistent with the experimental results of three-point bending tests where for high-crack openings the behaviour of PFRC exceeds that of SFRC with medium contents of steel fibres. These features can be observed in Figure 3.
0.0 0.5 1.0 1.5 2.0 2.5 3.5 4.5 5.5 6.5 PFRC6 PFRC10 SFRC50 SFRC70 A ve r age S h e a r (M P a) Shear slide (mm)
Figure 3: Average shear strength vs shear slide, from 2.5 up to 7 mm.
In order to analyse the data obtained in the tests, Table 2 has been prepared. It shows the maximum shear strength and shear residual
strength at a shear slide of 2.5 and 3.5 mm for the concretes tested. It is noteworthy that the specimens showed residual strength up to shear displacement over 7 mm, which would provide an important safety factor to concrete structures.
Table 2: Tested specimen and average shear strength (MPa); maximum, at 2.5 and 3.5 mm shear
displacement MAX 2.5 3.5 PFRC6 (MPa) 5.19 1.04 0.90 PFRC10(MPa) 9.70 1.15 0.83 SFRC50 (MPa) 12.16 0.89 0.69 SFRC70 (MPa) 17.37 1.61 1.32
Equally relevant is the study of the fracture energy of the concrete when subjected to shear stresses. Table 3 shows the values of energy dissipated in the tests for a shear displacement from 6 mm. In addition, the number of fibres present in the fracture surface is included.
Table 3: Fracture energy and number of fibres
Concrete GF (N/m) # Fibres
PFRC6 7621 47
PFRC10 7913 57
SFRC50 10400 45
SFRC70 17554 67
5 DIGITAL IMAGE CORRELATION
To study the mechanisms of fracture in Mode II, DIC was used. Such a methodology allows detection of the onset and development of the cracks produced during tests. The tests were recorded with two cameras and the images taken at a rate of one frame per second. This enabled the synchronisation of the images and the data recorded by the testing machine.
By analysing the PFRC6 cracking pattern, it was possible to determine that it began either at the tip of the upper notch or at the tip of the lower one. The cracks grew vertically between the tips of the notches and, at the same time, small fissures with a certain inclination appeared. This behaviour can be seen in Figure 4, which shows a test specimen when the initial cracks appear. The inclination of the micro cracks can also be appreciated in the areas shown in red.
Figure 4: PFRC6 specimen at the moment of cracking.
In the case of the PFRC10, the onset of the fracture was generated in the central area of the section of ligament. In addition, a few cracks in the central area of the cantilever appeared. During the course of the tests, these cracks closed and were undetectable when examined by using DIC.
Regarding SFRC, it can be perceived that a different cracking pattern emerged. During the first loading stage, the appearance of the first crack produces a slight variation of the slope of the load-displacement curve until the maximum shear strength is reached. Figure 5 shows the appearance of a crack that was the origin of the fracture plane of the specimen. Such a crack caused a reduction in the stiffness of the specimen. However, at this point the material was capable of sustaining higher loads until the maximum load was reached. As the tests progressed, the crack grew to link the tips of the notches, generating the fracture plane of the specimen. Furthermore, the same cracks that appeared in the cantilever in the PFRC formulations surged in the case of SFRC. Similarly, they reduced their opening as the tests advanced.
Figure 5: SFRC50 specimen at the moment of cracking.
6 EXPERIMENTAL VS. STANDARDS
As noted in the introduction, FRC may have a structural character, depending on the fulfilment of certain requirements based on residual strength obtained in bending tests. CM-2010 set two conditions, expressed according to the equations (2) and (3).
fR1 / fLOP > 0.4 (2)
fR3k / fR1k > 0.5 (3)
However, the condition of the structural character under shear stresses depends on results obtained in bending tests. For this reason, a comparison of the analytical proposal, according to equation (4) of the MC-2010, and the experimental results obtained has been carried out.
(4) In equation (4):
c is the partial safety factor for the concrete.
k = 1+(200/d)^(1/2) 2.0.
d [mm] is the effective depth of the cross
section.
1 is the reinforcement ratio for longitudinal
reinforcement, 0.02.
fFtuk [MPa] is the characteristic value of the
ultimate residual tensile strength for FRC, considering that wu = 1.5 mm.
If a rigid plastic model is supposed, as does
the Spanish standard (EHE-08), the value stated is fFTu = fR3/3 where:
fR3 is the tensile residual strength of the
FRC at 2.5 mm CMOD.
fctk [MPa] is the characteristic value of the
tensile strength. fctk = 0.3fck^(2/3).
fck [MPa] is the characteristic value of
cylindrical compressive strength.
cp [MPa] is the average stress acting on the
concrete cross section, Ac [mm2], for an axial force NEd [N], due to loading or prestressing
actions. cp = NEd / Ac
bw [mm] is the smallest width of the cross
section in the tensile area.
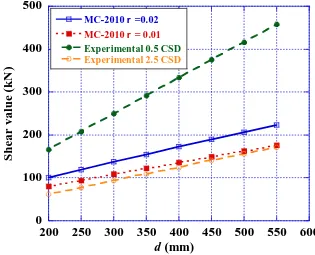
The theoretical previously mentioned behaviour and the experimental curves are plotted in Figure 6. Such curves correspond to the behaviour obtained for the PFRC6, longitudinal steel amounts to 0.01 and 0.02 (in addition, the effective depth of the cross section (d) has been parametrised). It can be seen that the MC2010 proposal for small shear slides (0.5 mm) is remarkably below the experimental values, neglecting the PFRC shear-resistant capacity. For a crack opening of 2.5 mm, standard values are slightly higher than the experimental ones.
0 100 200 300 400 500 200 250 300 350 400 450 500 550 600 MC-2010 r =0.02 MC-2010 r = 0.01 Experimental 0.5 CSD Experimental 2.5 CSD S hea r val u e (kN ) d (mm)
Figure 6: Shear values according to MC-2010 and from Push-off tests for PFRC6.
7 CONCLUSIONS
Push-off tests allowed relevant data on the behaviour of FRC subjected to fracture in Mode II to be obtained. As the specimens were
obtained from specimens already tested under bending, the comparison of the behaviour of the same material under fracture in Mode I and II was enabled.
The behaviour of the FRC showed ductile fracture processes compatible with its structural use. It should be underlined that notable values of shear displacement can occur without causing the collapse of the material.
Cracking patterns, due to the DIC technique were obtained and the differences among such patterns in the concrete formulations determined.
8 ACKNOWLEDGEMENTS
The authors gratefully acknowledge the financial support provided by Ministry of Economy, Industry and Competitiveness of Spain by means of the Research Fund Project BIA2016-78742-C2-2-R.
REFERENCES
[1] S. C. Malatesta, "Caracterización de la fractura del hormigón y de vigas de hormigón armado," Informes de la
Construcción, vol. 48, no. 448, p. 60,
1997.
[2] P. Soroushian and C.-D. Lee, "Distribution and orientation of fibers in steel fiber reinforced concrete," Materials
Journal, vol. 87, no. 5, pp. 433-439, 1990.
[3] F. Laranjeira, S. Grünewald, J. Walraven, C. Blom, C. Molins, and A. Aguado, "Characterization of the orientation profile of steel fiber reinforced concrete,"
Materials and structures, vol. 44, no. 6,
pp. 1093-1111, 2011.
[4] M. G. Alberti, A. Enfedaque, and J. C. Gálvez, "On the mechanical properties and fracture behavior of polyolefin fiber-reinforced self-compacting concrete,"
Construction and Building Materials, vol.
55, pp. 274-288, 2014.
[5] M. Soutsos, T. Le, and A. Lampropoulos, "Flexural performance of fibre reinforced
concrete made with steel and synthetic fibres," Construction and building materials, vol. 36, pp. 704-710, 2012.
[6] International Federation for Structural Concrete (fib), The fib Model Code for
Concrete Structures 2010. Lausanne,
Switzerland: International Federation for Structural Concrete, 2010.
[7] M. G. Alberti, A. Enfedaque, J. C. Gálvez, and L. Pinillos, "Structural Cast-in-Place Application of Polyolefin Fiber– Reinforced Concrete in a Water Pipeline Supporting Elements," Journal of Pipeline
Systems Engineering and Practice, vol. 8,
no. 4, p. 05017002, 2017.
[8] Spanish Minister of Public Works,
Spanish Structural Concrete Code EHE-08. Madrid, Spain: Spanish Minister of
Public Works, 2008.
[9] V. C. Li, R. Ward, and A. M. Hamza, "Steel and synthetic fibers as shear reinforcement," 1992.
[10] Y. L. Voo, W. K. Poon, and S. J. Foster, "Shear strength of steel fiber-reinforced ultrahigh-performance concrete beams without stirrups," Journal of structural
engineering, vol. 136, no. 11, pp.
1393-1400, 2010.
[11] S. Altoubat, A. Yazdanbakhsh, and K.-A. Rieder, "Shear behavior of macro-synthetic fiber-reinforced concrete beams without stirrups," ACI Materials Journal, vol. 106, no. 4, p. 381, 2009.
[12] M. di Prisco, M. Colombo, and D. Dozio, "Fibre‐ reinforced concrete in fib Model Code 2010: principles, models and test validation," Structural Concrete, vol. 14, no. 4, pp. 342-361, 2013.
[13] C. European Committee for Standardization, "Test Method for Metallic Fiber Concrete. Measuring the Flexural Tensile Strength (Limit of
Proportionality (LOP), Residual); EN14651:2007+A1," 2007.
[14] H. P. Taylor, "The fundamental behavior of reinforced concrete beams in bending and shear," Special Publication, vol. 42, pp. 43-78, 1974.
[15] J. Turmo, N. Banthia, R. Gettu, and B. Barragán, "Study of the shear behaviour of fibre reinforced concrete beams,"
Materiales de construcción, vol. 58, no.
292, pp. 5-13, 2008.
[16] P. Pujadas et al., "Plastic fibres as the only reinforcement for flat suspended slabs: Parametric study and design considerations," Construction and Building Materials, vol. 70, pp. 88-96,
2014.
[17] J. Echegaray, "Upgrading the push-off test to analyze the contribution of steel fiber on shear transfer mechanisms," 2014. [18] K. De Wilder, P. Lava, D. Debruyne, Y.
Wang, G. De Roeck, and L. Vandewalle, "Experimental investigation on the shear capacity of prestressed concrete beams using digital image correlation,"
Engineering Structures, vol. 82, pp.
82-92, 2015.
[19] S. Zeranka, "Steel fibre-reinforced concrete: multi-scale characterisation towards numerical modelling," Stellenbosch: Stellenbosch University, 2017.
[20] Á. Picazo, J. C. Gálvez, M. G. Alberti, and A. Enfedaque, "Assessment of the shear behaviour of polyolefin fibre reinforced concrete and verification by means of digital image correlation,"
Construction and Building Materials, vol.
181, pp. 565-578, 8/30/ 2018.
[21] P.-C. Hung and A. Voloshin, "In-plane strain measurement by digital image correlation," Journal of the Brazilian
Society of Mechanical Sciences and Engineering, vol. 25, no. 3, pp. 215-221,