TítuloImpact of physical and psychosocial factors on disability caused by lumbar pain amongst fishing sector workers
12
0
0
Texto completo
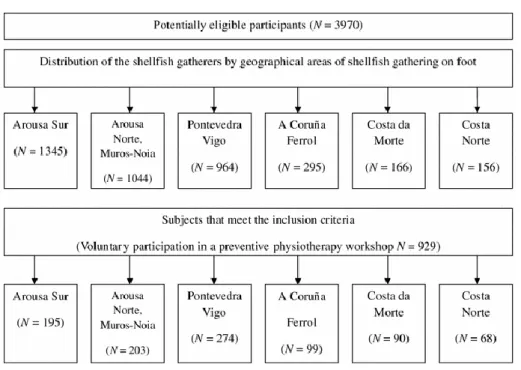
(2) flexion of the trunk, either from a standing or from a kneeling position), the manual handling of loads and repetitive movements. They use tools similar to those employed in agriculture, but adapted for use in the water. They are manual workers who, in general, have a low level both of education and income. They are self-employed and belong to a special group within the Spanish National Insurance System, the “Special Regime for Sea Workers”, one third of which is funded by the state, due to the special hardships associated with the type of work they perform [14, 15]. Although evidence reveals that psychological and physical factors are associated with disability in people with LBP, less is known about this relationship in non-clinical settings, and to our knowledge, no information regarding this connection amongst this group of workers has been published. The aim of this study is to analyse the role that demographic, lifestyle and psychological factors (Mental Health in the SF-36) as well as certain physical factors (intensity, location and generalisation of pain) play in predicting functional disability caused by lumbar pain amongst a group of blue collar workers. Method Design overview This is a cross-sectional survey of workers in the fishing sector in Galicia (Northwest Spain). Data collection for the study was conducted between January 2008 and February 2009. Selection criteria required participants to be shellfish gatherers that voluntarily took part in a workshop on preventive physiotherapy and excluded all of those who did not wish to participate in the study. Informed written consent was obtained from the subjects, and the study was approved by the ethical review board (ERB) of the Autonomous Region of Galicia (CEIC, ID number 2009/298). The research carried out is in compliance with the Helsinki Declaration. Setting and participants The study took into account all the Fishermen’s Guilds in the Autonomous Region of Galicia where shellfish gathering activities are carried out on foot. This includes a total of 44 Guilds, representing a total population of 3,970 workers in Galicia alone, 93.95 % of whom are women [16]. The sample was taken using voluntary participation in a workshop of preventive physiotherapy, and the exclusion criterion was the desire not to take part in the study. In order to encourage participation in this workshop, the research team produced material to publicise it (posters and a DVD), containing details of the aims of the workshop and the actions required of those shellfish gatherers wishing to take part. This information was included for the first time at the “International Conference on Prevention and Safety Measures in Shallow-water Fishing” and the Technical Session of the “European Musculoskeletal Disorders Week”. Both events were held in Galicia in 2007 and included participation by the Presidents of the Women’s Shellfish Gatherers’ Associations. In order to publicise these workshops more widely, Galician fishing promotion agents from each area where shellfish is gathered delivered materials to the members of each association and reached an agreement on the date, place and time when the workshops would be held, in order to guarantee maximum attendance, and whereby a maximum of 20 people would take part in each session. A total of 929 employees and 34 fishermen’s guilds participated in the study. Figure 1 shows a flow chart describing the numbers of total shellfish gatherers per area and the number of participants in the study for each area. This sample size allowed us to estimate the parameters of interest with a certainty rate of 95 % (α = 0.05) and an accuracy of ±3.2 %..
(3) Fig. 1. Flow diagram for participant recruitment. Measures A self-administered, paper-based questionnaire was distributed by the researchers during the physiotherapy workshop explaining the purpose of the research and clarifying any queries participants had. The dependent variable is functional disability caused by lumbar pain, and the independent variables are demographic and lifestyle factors, comorbidity, mental health and certain musculoskeletal pain characteristics. Roland-Morris Disability Questionnaire (RMDQ) The RMDQ is a self-administered questionnaire that assesses functional disability related to lumbar pain. It is one of the most highly recommended and commonly used scale in both clinical and research spheres [17]. It is also the preferred instrument for use in those persons mild to moderately affected by LBP [13]. It is a quick, simple and intuitive questionnaire that can be completed individually. The score ranges from 0 (no functional disability) to 24 (severe functional disability) points. The higher the score, the greater the degree of functional disability. The measure offers excellent reliability, validity and responsiveness [18]. We used the Spanish version of the RMDQ [19]. Demographic factors and comorbidity The workers were asked to detail their sociodemographic characteristics and answer questions on their lifestyle (smoking, physical activity during leisure time—minimum 30 min/3 times per week) and on comorbidity. Comorbidity was ascertained by 6 dichotomised questions about rheumatic disorders, depressive syndrome, diabetes, neoplasms, back surgery and other conditions. Medical Outcomes Study 36-item Short-Form Health Survey (SF-36) The SF-36 is made up of 36 items that assess health across 8 dimensions. These dimensions may be reduced to 2 scores (i.e. physical and mental component summary (MCS) scores). In order to measure workers’ mental health, we used the Mental Health dimension (MH) and the MCS of the SF-36. SF-36 Mental Health is a measure that captures how persons perceive their mental health, including depression, anxiety, conduct control and general well-being, and shares close ties with the Hospital Anxiety and Depression Scale (HADS) components in spine disease [20]. The lowest score corresponds to permanent feelings of anguish and depression and the highest score to a constant sense of calm and happiness. All 8 health domain scales contribute to the assessment process in the MCS, although the key factors are Vitality, Social Functioning, Role-Emotional and Mental Health. The SF-36 has been used in a.
(4) considerable number of studies into LBP [21–23]. For the purpose of our study, we used the Spanish version 2, which is currently recommended, as well as the standard version that records health status during the final 4 weeks [24, 25]. The psychometric characteristics of the SF-36 have been studied extensively and have been found to be reliable, valid and sensitive in their both original and Spanish versions [25, 26]. Low back and musculoskeletal pain Musculoskeletal pain was assessed by means of the following question: Where do you regularly have pain? The options included multiple answers relating to 11 different body regions. To obtain an overall picture of concurrent MSP in the whole body, the original eleven anatomical sites were later combined to make up five larger anatomical areas [27]: neck, shoulder or higher part of the back; lower part of the back; elbow or wrist/hand; hip or knee; and leg or ankle/foot. A total score of the number of painful sites was also calculated. If the participants experienced pain in any of the regions, they were asked to specify the intensity on the Verbal Numerical Scale (VNS) [28]. For VNS, the worker was asked to “score” her/his pain between 0 representing “no pain” and 10 representing “the worst pain imaginable”. Data analysis Descriptive statistics were used to present the basic features of the participants. Means, standard deviations (SD), medians and ranges were computed for variables rated on a continuous scale, and absolute value, percentage and 95 % confidence interval (CI) for categorical variables. To compare means, Student t test or Mann–Whitney U test were performed depending on which was more appropriate, after verifying normality with the Kolmogorov–Smirnov test. Correlations between variables were computed with correlation coefficients (Spearman’s Rho). Roland-Morris disability scores were dichotomised according to the median values (RMDQ > 3), and the scores 0 versus ≥1. ROC (receiver operative characteristic) curves were calculated to predict disability (RMDQ > median). In order to control variables that could result in confusion, a logistic regression analysis was performed. The regression models were in turn repeated, replacing the Mental Health variable for the MCS of the SF-36. All statistics were computed using the SPSS for Windows version 17 (SPSS, Chicago, IL, USA). Results The descriptive characteristics of the subjects included in the study are shown in Table 1. The mean age of the workers was 50.6 years (SD = 8.8, range = 18–69 years), and the sample is predominantly female (98.7 % women). The mean duration of employment as shellfish gatherers was 21.8 years (SD = 13.0). The most frequently reported comorbidity was rheumatic disorders (17.2 %) and depressive syndrome (16.1 %). The prevalence of regularly perceived lumbar pain was 65.5 %, and the mean pain intensity score was 6.1 points (SD = 1.8, range = 2-10 points). The median of pain site localisations was 3 sites (range = 0–11 sites)..
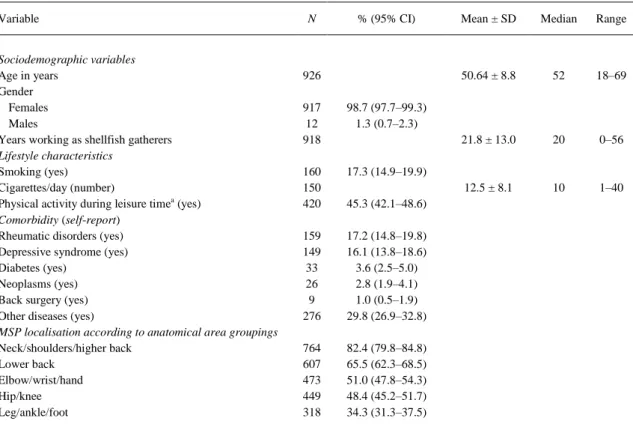
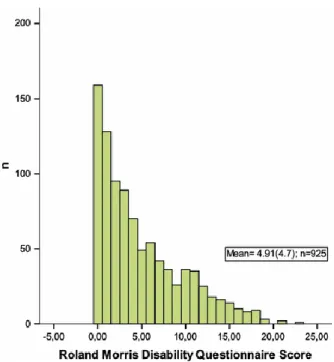
(5) Table 1. Descriptive characteristics of the shellfish gatherers (N = 929) Variable Sociodemographic variables Age in years Gender Females Males Years working as shellfish gatherers Lifestyle characteristics Smoking (yes) Cigarettes/day (number) Physical activity during leisure timea (yes) Comorbidity (self-report) Rheumatic disorders (yes) Depressive syndrome (yes) Diabetes (yes) Neoplasms (yes) Back surgery (yes) Other diseases (yes) MSP localisation according to anatomical area groupings Neck/shoulders/higher back Lower back Elbow/wrist/hand Hip/knee Leg/ankle/foot. N. % (95% CI). 926 917 12 918. 98.7 (97.7–99.3) 1.3 (0.7–2.3). 160 150 420. 17.3 (14.9–19.9). 159 149 33 26 9 276. 17.2 (14.8–19.8) 16.1 (13.8–18.6) 3.6 (2.5–5.0) 2.8 (1.9–4.1) 1.0 (0.5–1.9) 29.8 (26.9–32.8). 764 607 473 449 318. 82.4 (79.8–84.8) 65.5 (62.3–68.5) 51.0 (47.8–54.3) 48.4 (45.2–51.7) 34.3 (31.3–37.5). Mean ± SD. Median. Range. 50.64 ± 8.8. 52. 18–69. 21.8 ± 13.0. 20. 0–56. 12.5 ± 8.1. 10. 1–40. 45.3 (42.1–48.6). CI confidence interval, SD Standard deviation, MSP musculoskeletal pain a Physical activity during leisure time (minimum 30 min/3 times per week). The mean Roland-Morris disability score was 4.9 (SD = 4.7) points, the median 3, whilst the point range varied between 0 and 23 (Fig. 2). The most frequent functional disability variables were as follows: “I change position frequently to try to make my back feel comfortable” (68.2 %); “I don’t sleep so well because of my back” (37.8 %) and “I find it difficult to turn over in bed because of my back” (37.2 %)..
(6) Fig. 2. Distribution of the shellfish gatherers in accordance with the Roland-Morris Disability Questionnaire [Roland-Morris Disability Questionnaire. Scores ranged from 0 (no disability) to 24 (severe functional disability)] scores. The univariate analysis (Table 2) revealed that functional disability is greater amongst women (RMDQ score) than men (4.9 compared to 3.2), although the difference is not statistically significant. Smokers scored lower than non-smokers (4.1 vs. 5.1, P = 0.03), and shellfish gatherers with rheumatic disorders and depressive syndromes obtained higher scores on the RMDQ than those without this comorbidity (7.8 vs. 4.3, P ≤ 0.001 and 7.1 vs. 4.5, P ≤ 0.001, respectively). Those participants with MSP in any of the 5 anatomical region studies have a higher degree of functional disability than the shellfish gatherers without MSP in these regions (P ≤ 0.001)..
(7) Table 2. Mean score of the Roland-Morris Disability Questionnaire according to various covariables Scores of RMDQa Variable. Gender Females Males Smoking Yes No Physical activity during leisure time Yes No Rheumatic disorders Yes No Depressive syndrome Yes No Diabetes Yes No MSP localisation according to anatomical area groupings Neck/shoulders/higher back Yes No Lower back Yes No Elbow/wrist/hand Yes No Hip/knee Yes No Leg/ankle/foot Yes No. N. Mean ± SD. 914 11. 4.9 ± 4.7 3.2 ± 4.3. 158 767. 4.1 ± 4.1 5.1 ± 4.9. 419 506. 4.7 ± 4.7 5.1 ± 4.8. 159 766. 7.8 ± 5.5 4.3 ± 4.3. 149 776. 7.1 ± 5.5 4.5 ± 4.5. 33 892. 6.2 ± 5.4 4.9 ± 4.7. 764 161. 5.3 ± 4.8 3.2 ± 4.1. 607 318. 5.8 ± 4.9 3.2 ± 3.8. 472 543. 5.8 ± 5.0 4.0 ± 4.3. 448 477. 6.6 ± 5.2 3.3 ± 3.7. 318 607. 6.8 ± 5.2 3.9 ± 4.1. P. 0.15. 0.03. 0.24. ≤0.001. ≤0.001. 0.19. ≤0.001. ≤0.001. ≤0.001. ≤0.001. ≤0.001. Calculated with Student t test or a Mann–Whitney U test SD standard deviation, MSP musculoskeletal pain, RMDQ Roland-Morris Disability Questionnaire a Scores ranged from 0 (no disability) to 24 (severe functional disability).
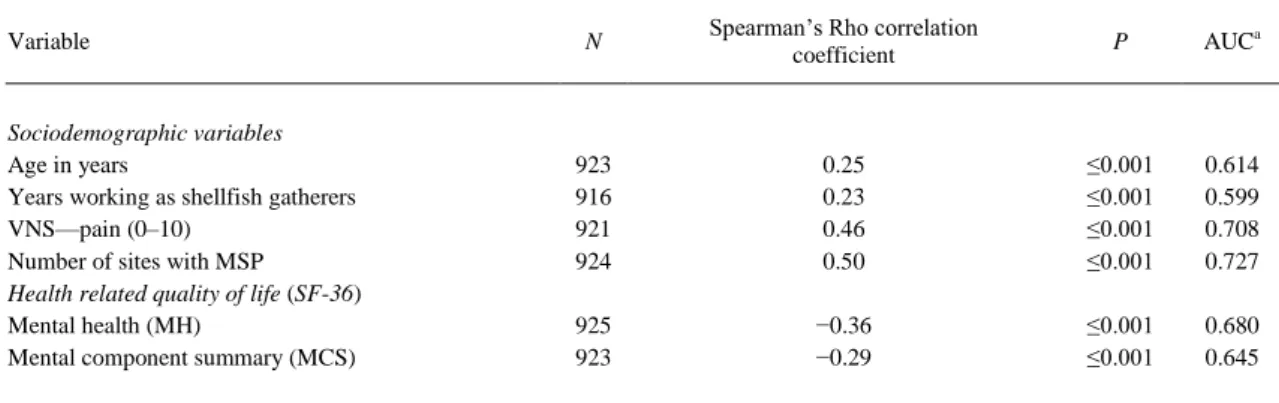
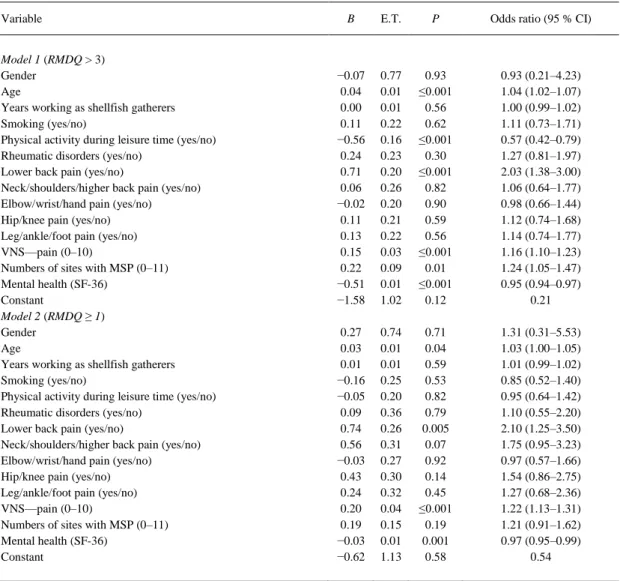
(8) Likewise, we observed that Roland-Morris disability scores show a positive correlation with the age, years worked, pain intensity and number of regions with MSP, and a significantly negative one with Mental Health and the MCS of the SF-36 (Table 3). The highest Spearman’s Rank Correlation corresponds to the number of regions with MSP (r = 0.50) and the lowest to the number of years worked in shellfish gathering (r = 0.23). The Areas Under the Curve (ROC curves) values to predict disability are also shown in Table 3. The highest value corresponds to number of regions with MSP variable.. Table 3. Correlation between Roland-Morris disability scores and different variables and Area Under the Curve (AUC) to predict disability (RMDQ) Variable. Sociodemographic variables Age in years Years working as shellfish gatherers VNS—pain (0–10) Number of sites with MSP Health related quality of life (SF-36) Mental health (MH) Mental component summary (MCS). N. Spearman’s Rho correlation coefficient. P. AUCa. 923 916 921 924. 0.25 0.23 0.46 0.50. ≤0.001 ≤0.001 ≤0.001 ≤0.001. 0.614 0.599 0.708 0.727. 925 923. −0.36 −0.29. ≤0.001 ≤0.001. 0.680 0.645. Correlation coefficients (Spearman’s Rho) for Roland-Morris disability scores and sociodemographic, characteristics of musculoskeletal pain and SF-36 scores (MH and MCS) AUC area under the curve (ROC curves) to predict disability (Roland-Morris disability scores >3), RMDQ Roland-Morris Disability Questionnaire, VNS Verbal Numerical Scale (0–10), MSP musculoskeletal pain, SF-36 Medical Outcomes Study 36-Item ShortForm Health Survey questionnaire. The logistic regression model for predicting functional disability based on a score higher than the median (RMDQ > 3) (Model 1) is shown in Table 4. This model identifies the variables with an independent effect on predicting disability caused by lumbar pain as age, physical exercise, the presence of lumbar pain, the degree of intensity of this pain, the number of regions with MSP and the Mental Health dimension of the SF-36. In addition, Table 4 (Model 2) shows the logistic regression model for predicting any form of disability (RMDQ ≥ 1). This model identifies the predictive variables as age, the presence of lumbar pain, the degree of intensity of this pain and the Mental Health dimension of the SF36..
(9) Table 4. Logistic regression models to predict disability caused by lumbar pain through the inclusion of a number of covariables Variable Model 1 (RMDQ > 3) Gender Age Years working as shellfish gatherers Smoking (yes/no) Physical activity during leisure time (yes/no) Rheumatic disorders (yes/no) Lower back pain (yes/no) Neck/shoulders/higher back pain (yes/no) Elbow/wrist/hand pain (yes/no) Hip/knee pain (yes/no) Leg/ankle/foot pain (yes/no) VNS—pain (0–10) Numbers of sites with MSP (0–11) Mental health (SF-36) Constant Model 2 (RMDQ ≥ 1) Gender Age Years working as shellfish gatherers Smoking (yes/no) Physical activity during leisure time (yes/no) Rheumatic disorders (yes/no) Lower back pain (yes/no) Neck/shoulders/higher back pain (yes/no) Elbow/wrist/hand pain (yes/no) Hip/knee pain (yes/no) Leg/ankle/foot pain (yes/no) VNS—pain (0–10) Numbers of sites with MSP (0–11) Mental health (SF-36) Constant. B. E.T.. P. Odds ratio (95 % CI). −0.07 0.04 0.00 0.11 −0.56 0.24 0.71 0.06 −0.02 0.11 0.13 0.15 0.22 −0.51 −1.58. 0.77 0.01 0.01 0.22 0.16 0.23 0.20 0.26 0.20 0.21 0.22 0.03 0.09 0.01 1.02. 0.93 ≤0.001 0.56 0.62 ≤0.001 0.30 ≤0.001 0.82 0.90 0.59 0.56 ≤0.001 0.01 ≤0.001 0.12. 0.93 (0.21–4.23) 1.04 (1.02–1.07) 1.00 (0.99–1.02) 1.11 (0.73–1.71) 0.57 (0.42–0.79) 1.27 (0.81–1.97) 2.03 (1.38–3.00) 1.06 (0.64–1.77) 0.98 (0.66–1.44) 1.12 (0.74–1.68) 1.14 (0.74–1.77) 1.16 (1.10–1.23) 1.24 (1.05–1.47) 0.95 (0.94–0.97) 0.21. 0.27 0.03 0.01 −0.16 −0.05 0.09 0.74 0.56 −0.03 0.43 0.24 0.20 0.19 −0.03 −0.62. 0.74 0.01 0.01 0.25 0.20 0.36 0.26 0.31 0.27 0.30 0.32 0.04 0.15 0.01 1.13. 0.71 0.04 0.59 0.53 0.82 0.79 0.005 0.07 0.92 0.14 0.45 ≤0.001 0.19 0.001 0.58. 1.31 (0.31–5.53) 1.03 (1.00–1.05) 1.01 (0.99–1.02) 0.85 (0.52–1.40) 0.95 (0.64–1.42) 1.10 (0.55–2.20) 2.10 (1.25–3.50) 1.75 (0.95–3.23) 0.97 (0.57–1.66) 1.54 (0.86–2.75) 1.27 (0.68–2.36) 1.22 (1.13–1.31) 1.21 (0.91–1.62) 0.97 (0.95–0.99) 0.54. Model 1 presents results of regression analyses for predicting disability (RMDQ > 3), and Model 2 presents results of regression analyses for predicting disability (RMDQ ≥ 1) CI confidence interval, RMDQ Roland-Morris Disability Questionnaire, VNS Verbal Numerical Scale (0–10), MSP musculoskeletal pain. We repeated the models, but this time replacing the SF-36 Mental Health variable with the SF-36 MCS. In this case, the predictive variables remained unchanged. Discussion This study provides information concerning functional disability caused by lumbar pain amongst shellfish gatherers in Galicia and the determining factors. There are no significant sociodemographic differences between participants and non-participants. Of the total population of shellfish gatherers, 94 % are women and 67 % are aged between 40 and 60 [16]. Our sample was also predominantly female (98 % are women), middle aged (51) and with a mean value of 22 years’ experience in shellfish gathering. The results indicated that this sub-group of blue collar workers have only slight functional disability despite the high incidence of lumbar pain (65.5 % claim to suffer regularly from lumbar pain). This finding, about the high prevalence of lumbar pain, is consistent with other studies about workers in the agricultural-farming-fishing sectors [29–31]. The factors associated with disability caused by lumbar pain were age, physical activity, lumbar pain, pain intensity, generalised pain (MSP in multiple regions) and poor mental health (SF-36 MH or MCS)..
(10) The mean score on the RMDQ of almost 5 points (out of a maximum of 24) is lower in comparison with the results obtained in many other studies [7, 32–34] which obtained Roland-Morris scores of between 7 and 17 points. However, these scores correspond to patients that receive treatment for their lumbar pain, unlike our sample, where the vast majority are active workers. In the case of the shellfish gatherers, lumbar pain has the greatest impact on aspects such as remaining in the same posture over a period of time and resting in bed. According to our results, those participants that carry out physical activity experience a lower degree of disability caused by lumbar pain. This finding was also observed by the authors of the most recent systematic review of this association in persons suffering from chronic lumbar pain [35]. However, given that our results were obtained from a cross section and that no causality can be inferred in this type of studies, it would appear to indicate that either physical activity prevents functional disability caused by lumbar pain or that those persons with the highest degree of disability caused by lumbar pain fail to carry out or have given up regular physical activity. In our study, rather than analysing each of the possible factors that impact on disability caused by lumbar pain, we instead found that both physical (specifically the degree of intensity of pain and the number of regions with MSP) and psychological factors (such as depression, anxiety, conduct control and general well-being), assessed using the SF-36 Mental Health dimension, are capable of predicting disability. Nevertheless, the various statistical analyses we have carried out have also shown that the predictive value of physical factors is slightly higher than that of the psychological ones. Our results contribute to the current debate, given that the evidence as to whether the principal factors that determine disability are physical aspects related to the degree of pain (e.g. intensity, duration or generalised nature) or psychological ones (e.g. depression, anxiety, etc.) is inconclusive. The analysis of studies that have used the RMDQ to assess functional disabilities has revealed the following: Some authors have observed that both pain-related physical aspects and psychological factors predict functional disability [36, 37]. Woby et al. [37], for instance, report that pain intensity accounted for an additional 24 % and psychological factors accounted for an additional 22 % of the variance in disability (RMDQ) in patients with chronic low back pain. Other authors consider psychological factors to be more predictive than severe pain [38, 39]. In a 4year prospective study to monitor patients with lumbar pain, Burton et al. [38] found that the disability score was statistically significantly related to baseline depressive symptoms (22 % of the variance) and higher pain intensity (4 %). Unlike the findings referred to above, a number of studies have identified only a weak correlation between psychological factors and functional disability [33]. Finally, certain studies reflect findings similar to ours, whereby both types of factors—physical and psychological—are predictive of disability, although the former rank amongst the most predictive [7, 32, 34, 40]. In the final multivariable regression models, Grotle et al. [7] showed that having widespread pain (also measured in our study in terms of the number of pain regions), was one of the strongest prognostic indicators for disability in patients with acute, sub-acute or chronic lumbar pain. One of the potential limitations of the present study is that the participants were volunteers, so this bias in selection may have had some influence on results. Nevertheless, 77.3 % of fishermen’s guilds participated in the study, and as we stated earlier, the profile of non-participants is similar to that of the sample in terms of gender and age. Of the total population of shellfish gatherers, 94 % are women and 67 % are aged between 40 and 60. Our sample was also predominantly female and middle aged. Another limitation to consider for interpretation of this study is related to unmeasured factors such as those related with the job. We have only studied the years worked, whilst other authors have focused their analysis on the employment status [7, 36] and employment characteristics [41]. In general, these factors have not demonstrated to be predictive factors of functional incapacity. Finally, the design used in this study is cross-sectional; therefore, causality of the associations cannot be established from the findings. One of the strengths of our study is the use of validated questionnaires such as the RMDQ and SF-36 which are also highly recommended for persons with lumbar pain. We propose that future research should consider the potential effect of musculoskeletal comorbidity on lumbar pain for two principal reasons. The first is that people suffering from lumbar pain often also experience musculoskeletal pain in other regions, and secondly, and as our results have shown, this has a major impact on disability. We also posit that functional disability caused by lumbar pain and its treatment should be considered and acted upon in accordance with the principles of the biopsychosocial model, given that certain physical characteristics of pain and aspects related to the individual’s psychological sphere play a predictive role in this disability..
(11) Conclusions The results of this study show that functional disability caused by lumbar pain is determined by the pain-related physical characteristics and those related to mental health, although the former play a more predominant role. In decreasing order of importance, the determining factors observed are the presence of lumbar pain, the number of regions with musculoskeletal pain, pain intensity and age. Better mental health (MH of the SF-36) and regular physical activity have a protective impact on this disability. Acknowledgments We would like to thank the Xunta de Galicia (Consellería del Mar y Consellería de Traballo), the Galician Fishermen’s Guild and the Faculty of Physiotherapy of the University of A Coruña for supporting this study and the shellfish gatherers who gave up their time to complete the questionnaires. We would also like to thank L. Lema and J.A. Arribe for launching the Project and the Galician Fishing Promotion Agents for their collaboration in the organisation of the Physiotherapy Workshops. Departments of Physiotherapy and Health Sciences, University of A Coruña financed the translation of the article. The preventive physiotherapy workshops received the backing of the Xunta de Galicia. The funding agency played no role in the design, conduct or reporting of the study or in the decision to submit the article for publication. References 1. Linton SJ, Ryberg M (2000) Do epidemiological results replicate? The prevalence and health-economic consequences of neck and back pain in the general population. Eur J Pain 4:347–354 2. Waddell G, Burton AK (2001) Occupational health guidelines for the management of low back pain at work: evidence review. Occup Med (Lond) 51:124–135 3. Waddell G (2004) The back pain revolution, 2nd edn. Churchill Livingstone, Edinburgh 4. Truchon M (2001) Determinants of chronic disability related to low back pain: towards an integrative biopsychosocial model. Disabil Rehabil 23:758–767 5. Pincus T, Burton AK, Vogel S, Field AP (2002) A systematic review of psychological factors as predictors of chronicity/disability in prospective cohorts of low back pain. Spine (Phila Pa 1976) 27:E109–E120 6. Friedrich M, Hahne J, Wepner F (2009) A controlled examination of medical and psychosocial factors associated with low back pain in combination with widespread musculoskeletal pain. Phys Ther 89:786–803 7. Grotle M, Foster NE, Dunn KM, Croft P (2010) Are prognostic indicators for poor outcome different for acute and chronic low back pain consulters in primary care? Pain 151:790–797 8. Natvig B, Rutle O, Bruusgaard D, Eriksen WB (2000) The association between functional status and the number of areas in the body with musculoskeletal symptoms. Int J Rehabil Res 23:49–53 9. Natvig B, Bruusgaard D, Eriksen W (2001) Localized low back pain and low back pain as part of widespread musculoskeletal pain: two different disorders? A cross-sectional population study. J Rehabil Med 33:21–25 10. Kamaleri Y, Natvig B, Ihlebaek CM, Bruusgaard D (2008) Localized or widespread musculoskeletal pain: does it matter? Pain 138:41–46 11. Roland M, Morris R (1983) A study of the natural history of back pain. Part I: development of a reliable and sensitive measure of disability in low-back pain. Spine (Phila Pa 1976) 8:141–144 12. Ware JE Jr, Sherbourne CD (1992) The MOS 36-item short-form health survey (SF-36). I. Conceptual framework and item selection. Med Care 30:473–483 13. Bombardier C (2000) Outcome assessments in the evaluation of treatment of spinal disorders: summary and general recommendations. Spine (Phila Pa 1976) 25:3100–3103 14. Gago C (2004) La mujer en el mundo de la pesca en Galicia. Xunta de Galicia, Dirección Xeral de Innovación e desenvolvemento Pesqueiro, Santiago de Compostela 15. Torres M, Bress J, Fernández de Mata E, Carril X (2002) Os retos do sector pesqueiro galego cara ó vindeiro século. Consello Galego de Relacións Laborais. http://cgrl.xunta.es/upload/RETOS%20PESQUEIROS.pdf. Accessed 18 Aug 2010 16. Consellería do Mar (2010) Galicia fishing. Permits for shellfish gathering on foot. Xunta de Galicia. http://www. pescadegalicia.com/PMP/indice.html. Accessed 18 Aug 2010 17. Ostelo RW, de Vet HC (2005) Clinically important outcomes in low back pain. Best Pract Res Clin Rheumatol 19:593–607 18. Stratford PW, Binkley JM, Riddle DL (2000) Development and initial validation of the back pain functional scale. Spine (Phila Pa 1976) 25:2095–2102 19. Kovacs FM, Llobera J, Gil Del Real MT, Abraira V, Gestoso M, Fernández C et al (2002) Validation of the spanish version of the Roland-Morris questionnaire. Spine (Phila Pa 1976) 27:538–542 20. Guilfoyle MR, Seeley H, Laing RJ (2009) The Short Form 36 health survey in spine disease–validation against condition-specific measures. Br J Neurosurg 23:401–405.
(12) 21. Gatchel RJ, Maddrey AM (1998) Clinical outcome research in complementary and alternative medicine: an overview of experimental design and analysis. Altern Ther Health Med 4:36–42 22. Atroshi I, Andersson IH, Gummesson C, Leden I, Odenbring S, Ornstein E (2002) Primary care patients with musculoskeletal pain. Value of health-status and sense-of-coherence measures in predicting long-term work disability. Scand J Rheumatol 31:239–244 23. Keeley P, Creed F, Tomenson B, Todd C, Borglin G, Dickens C (2008) Psychosocial predictors of health-related quality of life and health service utilisation in people with chronic low back pain. Pain 135:142–150 24. Alonso J, Regidor E, Barrio G, Prieto L, Rodriguez C, de la Fuente L (1998) Population reference values of the Spanish version of the Health Questionnaire SF-36. Med Clin (Barc) 111:410–416 25. Vilagut G, Ferrer M, Rajmil L, Rebollo P, Permanyer-Miralda G, Quintana JM et al (2005) The Spanish version of the Short Form 36 Health Survey: a decade of experience and new developments. Gac Sanit 19:135–150 26. Ware JE (2000) SF-36 health survey update. Spine (Phila Pa 1976) 25:3130–3139 27. Picavet HS, Schouten JS (2003) Musculoskeletal pain in the Netherlands: prevalences, consequences and risk groups, the DMC(3)-study. Pain 102:167–178 28. Murphy D, McDonald A, Power C, Unwin A, MacSullivan R (1987) Measurement of pain: a comparison of the visual analogue with a nonvisual analogue scale. Clin J Pain 3:197–200 29. Parent-Thirion A, Fernández Macías E, Hurley J, Vermeylen G (2007) Fourth European working conditions survey. Office for Official Publications of the European Communities. http://www.eurofound.europa.eu/pubdocs/ 2006/98/en/2/ef0698en.pdf. Accesed 19 May 2010 30. Almodóvar Molina A, Pinilla García FJ (2008) VI Encuesta Nacional de Condiciones de Trabajo. Observatorio Estatal de Condiciones de Trabajo. http://www.oect.es/Observatorio/Contenidos/InformesPropios/Desarrollados/ Ficheros/Informe_VI_ENCT.pdf. Accesed 19 May 2010 31. Schneider E, Irastorza X (2010) OSH in figures: work-related musculoskeletal disorders in the UE. European Agency for Safety and Health at Work. Publications Office of the European Union. http://osha.europa.eu/en/ publications/reports/TERO09009ENC. Accesed 19 May 2010 32. Mannion AF, Junge A, Taimela S, Muntener M, Lorenzo K, Dvorak J (2001) Active therapy for chronic low back pain: part 3. Factors influencing self-rated disability and its change following therapy. Spine (Phila Pa 1976) 26:920–929 33. Schiphorst Preuper HR, Reneman MF, Boonstra AM, Dijkstra PU, Versteegen GJ, Geertzen JH (2007) The relationship between psychosocial distress and disability assessed by the Symptom Checklist-90-Revised and Roland Morris Disability Questionnaire in patients with chronic low back pain. Spine J 7:525–530 34. Preuper HR, Boonstra AM, Wever D, Heuts PH, Dekker JH, Smeets RJ et al (2011) Differences in the relationship between psychosocial distress and self-reported disability in patients with chronic low back pain in six pain rehabilitation centers in the Netherlands. Spine (Phila Pa 1976) 36:969–976 35. Lin CW, McAuley JH, Macedo L, Barnett DC, Smeets RJ, Verbunt JA (2011) Relationship between physical activity and disability in low back pain: a systematic review and meta-analysis. Pain 152:607–613 36. Dionne CE, Chénard M (2004) Back-related functional limitations among full-time homemakers: a comparison with women employed full-time outside the home. Spine (Phila Pa 1976) 29:1375–1382 37. Woby SR, Watson PJ, Roach NK, Urmston M (2004) Adjustment to chronic low back pain–the relative influence of fear-avoidance beliefs, catastrophizing, and appraisals of control. Behav Res Ther 42:761–774 38. Burton AK, McClune TD, Clarke RD, Main CJ (2004) Long-term follow-up of patients with low back pain attending for manipulative care: outcomes and predictors. Man Ther 9:30–35 39. Woby SR, Roach NK, Urmston M, Watson PJ (2007) The relation between cognitive factors and levels of pain and disability in chronic low back pain patients presenting for physiotherapy. Eur J Pain 11:869–877 40. Hurwitz EL, Morgenstern H, Yu F (2003) Cross-sectional and longitudinal associations of low-back pain and related disability with psychological distress among patients enrolled in the UCLA Low-Back Pain Study. J Clin Epidemiol 56:463–471 41. Harms MC, Peers CE, Chase D (2010) Low back pain: what determines functional outcome at six months? An observational study. BMC Musculoskelet Disord 11:236.
(13)
Figure

+3
Documento similar