Climate and Small Rodent Dynamics in Semi Arid Chile: the Role of Lateral and Vertical Perturbations and Intra Specific Processes
8
0
0
Texto completo
(2) 126. Clim Res 30: 125–132, 2006. a. b. c. Fig. 1. (a) Map of South America showing location of Fray Jorge Forest National Park, (b) total annual rainfall and (c) peak annual densities of (s) Phyllotis darwini and (d) Akodon olivaceus during 1989–2004. tors (e.g. climate) alters the intrinsic feedback structure of a population. A clear example of climatic influences on population dynamics is provided by numerical fluctuations exhibited by small rodents inhabiting many arid and semi-arid ecosystems. In such systems, water as a surrogate for primary productivity is the limiting resource; consequently, after events of unusually high rainfall, there is a subsequent increase in plant cover, seeds, insects perhaps, and finally, small mammal consumers (e.g. rodents) (Jaksic et al. 1997, Jaksic 2001, Meserve et al. 2003). As a result, most small mammal species exhibit striking population irruptions during and immediately after years of high rainfall (Pearson 1975, Jaksic et al. 1997, Lima et al. 1999, Jaksic 2001, Meserve et al. 2003). Several studies have reported the fundamental influence of rainfall on population fluctuations of small mammals in north-central Chile; however, they were based on statistical time series (Lima & Jaksic 1999), CaptureMark-Recapture (CMR) models (Lima et al. 1999, 2002), and manipulative experiments (e.g. Meserve et al. 2001). There have been no previous attempts to analyze the effects of rainfall using a theoretically oriented framework in this semi-arid ecosystem. Therefore, the present study has 2 objectives: (1) to characterize the dynamics of small rodent populations at Fray Jorge using simple, theoretically based models. and (2) to investigate if rainfall operates as a lateral perturbation effect in this semi-arid ecosystem.. 2. MATERIALS AND METHODS 2.1. Study site and focal species The data set comes from a site in north-central Chile located in an interior valley of Fray Jorge Forest National Park, ca. 5 km from the Pacific Ocean (71° 40’ W, 30° 38’ S, Fig. 1a) that has been monitored since March 1989. The climate of this region is influenced by 3 primary factors: (1) the topography, including the Andes to the east and a low coastal range to the west limiting maritime effects; (2) the subtropical Pacific anticyclone that affects storm fronts coming north from the polar region; and (3) the cold Humboldt current offshore, which depresses ambient temperatures and moisture capacity of onshore winds (López-Cortés & López 2004). Precipitation in this region is sparse and occurs principally in winter months (May–September). High interannual variability in total rainfall is primarily due to El Niño Southern Oscillation (ENSO) events. For example, during the period analyzed here (1989–2004), the annual precipitation ranged from 11 mm during a La Niña year (1998) to 356mm during an El Niño year (2002), with an average of 135 mm for the study period (Fig. 1b)..
(3) 127. Lima et al.: Climate and small rodent dynamics. The dominant vegetation in the study site is thorn scrub, consisting of mostly spiny, drought-deciduous or evergreen shrubs, with an understory of geophytes, herbaceous annuals, and perennial grasses especially after winter rains. The vegetation is very homogenous, with a mean shrub cover of about 60%. Principal shrub species include Porlieria chilensis (guayacán), Proustia pungens, and Adesmia bedwellii. Here, we examine the population dynamics of 2 murid sigmodontine rodents: Darwin’s leaf-eared mouse Phyllotis darwini and the olive grass mouse Akodon /Abrothrix olivaceus. P. darwini is a ~50 to 70 g herbivorous-granivorous rodent, whereas A. olivaceus is a ~20 to 30 g omnivorous rodent. We used mark-recapture data from small mammal live-trapping conducted for 4 nights (and 3 intervening days) per month since March 1989 in four 0.56 ha grids, each with 25 trapstations 15 m apart and 2 Sherman-type live traps per station baited with rolled oats. Small mammals are marked with ear tags or leg bands, and standard data on species, sex, reproductive condition, weight, and presence and location of ectoparasites taken. Live-trapping results are adjusted to ind. ha–1 using minimum number known alive (MNKA) estimates (Hilborn et al. 1976). For these analyses we used the time series of the peak annual density estimate obtained by selecting the highest density recorded after the reproductive season (October–May) of each year (Fig. 1c).. 2.2. Models of population dynamics The population dynamics of small rodents is the result of the feedback structure and rainfall influences in many arid ecosystems. To understand how both factors may determine rodent fluctuations, we model both systemintrinsic processes, and exogenous influences in a general model based on the R-function (Berryman 1999). The R-function represents the effects of a set of densitydependent and -independent factors on the realized logarithmic per capita population growth rate (Rt): Rt = loge (1 + B − D ) = loge ( N t ) − loge ( N t −1 ). (1). where Nt is the population density at time t, and B and D are per capita birth and death rates, respectively. This quantity denotes the processes of individual survival and reproduction and can be expressed as: Rt = ƒ ( N t −1, N t −2 ,..., N t − p , raint −d , εt ). (2). where Nt – p are lagged population densities, rain t – d are lagged rainfall effects, εt are stochastic forces, and ƒ is the so-called R-function. This statistical model integrates the feedback structure and the stochastic and climatic forces that drive population dynamics in na-. ture. In this paper, we are primarily interested in the relationship between intra-population processes (intra-specific competition) and rainfall effects; therefore, we fitted a non-parametric version of a simple statistical model: ⎛ N t −1 ⎞ Rt = a + ƒ ( N t −1 ) + g ( raint −d ) + h ⎜ +ε ⎝ raint −d ⎟⎠ t. (3). where ƒ, g and h are unspecified functions of the population density N t–1, rainfall and the non-additive effects of both variables, respectively. Statistical analysis was performed in the R environment (R Development Core Team [2004]; see www.r-project.org) using the Generalized Additive Modelling (GAM) approach of Hastie & Tibshirani (1990). The form of the partial functions ƒ, g and h was determined by fitting natural cubic splines to the data (see Bjørnstad et al. 1998 for ecological examples), and the complexity of the curve (no. of df) was determined by penalized regression splines and generalized cross validation (GCV) (Wood 2001). An alternative approach to using non-parametric models is employing a non-linear logistic population model. One type of discrete time logistic model is the exponential form (Royama 1992), known as the Ricker (1954) model, and is used here in its generalized version (Richards 1959, Berryman 1999): Rt = R m − C N ⋅. ( NK ) t −1. Q. (4). where N t–1 represents the rodent abundance at time t–1, Rm is a positive constant representing the maximum finite reproductive rate, CN is the intra-specific competition coefficient for limiting resources (food represented by rainfall), K is the environmental carrying capacity, and Q is the nonlinearity of the curve. A value of Q > 1 indicates a convex shape and Q < 1 indicates concavity. The exponential form represents a randomly distributed population competing for a common resource (Royama 1992), which appears to be consistent with scramble competition. Because the carrying capacity of the environment is frequently related to the amount of food available (Gause 1934, Leslie 1948, Berryman 1999, 2004), we can explicitly model K as a linear function of rainfall because of the dramatic influence of rainfall on plant productivity in this semi-arid system (Jaksic 2001, Gutiérrez & Meserve 2003). Under this hypothesis, rainfall represents a lateral perturbation according to Royama (1992). An extra term can also be added to account for possible vertical perturbation effects of rainfall. Thus, the equation becomes: Rt = R m − C N ⋅. (. N t −1 rain t −d. ). Q. + C r ⋅ raint −d. (5).
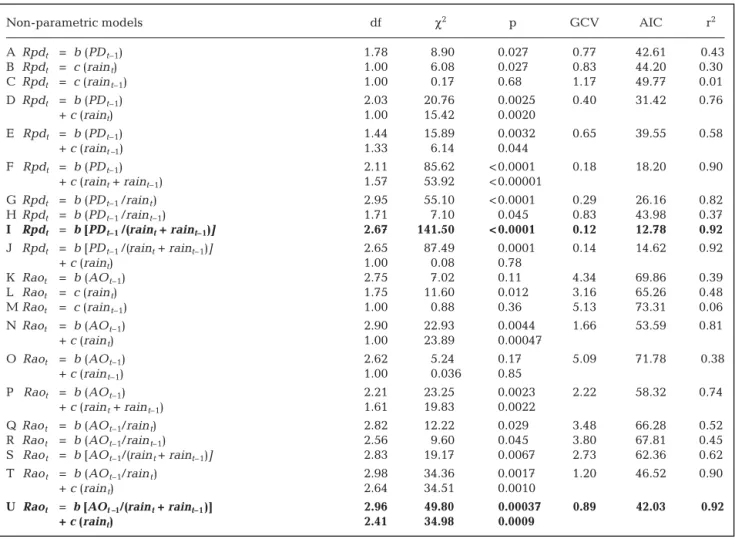
(4) 128. Clim Res 30: 125–132, 2006. where Cr is the coefficient representing the additive effects of rainfall. We fitted Eq. (4) using the nls library in the program R by means of non-linear regression analyses (Bates & Watts 1988). All the models were fitted to the data and we then calculated the Aikaike information criteria (AIC) from AIC = –2 × log (likelihood) + 2 (number of parameters). Models with the lowest AIC values were selected to draw inferences.. 3. RESULTS Our non-parametric analysis indicated that population density alone explained 43 and 39% of the variation in the per capita growth rates of Phyllotis darwini and Akodon olivaceus, respectively (Table 1), whereas rainfall alone explained 30 and 48% of the variation in the per capita growth rates of P. darwini and A.. olivaceus, respectively (Table 1). When both variables were combined in an additive manner, the nonparametric models explained much of the variation in per capita growth rates (Table 1). Ninety percent of the variation in the R values in P. darwini was explained by population density and the combined rainfall of the current and previous year, whereas 81% of the variation in R values of A. olivaceus was explained by population density and rainfall of the current year (Table 1). On the other hand, Fig. 2a,b clearly shows the effect of high rainfall on the R-function model, shifting the equilibrium density to the right. In particular, for P. darwini, a non-parametric model using only the ratio (Nt–1/[rain t + raint–1]) explained 92% of the variance and showed a strong non-linear shape with a pronounced concave curvature (Table 1, Fig. 2). In contrast, for A. olivaceus the additive effect of current rainfall seemed to be very important (Table 1). Overall, for P. darwini the variance explained by population. Table 1. Non-parametric models fitted to rodent time series. GCV: generalized cross validation score, AIC = Akaike information criteria. PDt–1: population size of Phyllotis darwini in year t–1; AOt–1: population size of Akodon olivaceus in year t–1; raint – d : annual rainfall (mm) fallen during year t–d (d = 0 and 1); Rpdt : ln(PDt /PDt–1); Raot: ln (AOt /AOt–1). Bold type: best models according to AIC and GVC criteria Non-parametric models A B C D. Rpdt Rpdt Rpdt Rpdt. = b (PD t–1) = c (rain t) = c (rain t–1) = b (PD t–1) + c (raint). E Rpdt = b (PD t–1) + c (raint –1) F Rpdt = b (PD t–1) + c (raint + raint–1) G Rpdt = b (PD t–1 /rain t) H Rpdt = b (PD t–1 /rain t–1) I Rpdt = b [PD t–1 /(raint + raint–1)] J Rpdt = b [PD t–1 /(raint + raint–1)] + c (raint) K Raot = b (AO t–1) L Raot = c (rain t) M Raot = c (rain t–1) N Raot = b (AO t–1) + c (rain t) O Raot = b (AO t–1) + c (rain t–1) P Raot = b (AO t–1) + c (rain t + rain t–1) Q Rao t = b (AO t–1/rain t) R Rao t = b (AO t–1/rain t–1) S Rao t = b [AO t–1/(rain t + raint–1)] T Rao t = b (AO t–1/rain t) + c (rain t) U Raot = b [AOt –1/(rain t + raint–1)] + c (raint ). df. χ2. p. GCV. AIC. r2. 1.78 1.00 1.00 2.03 1.00 1.44 1.33 2.11 1.57. 8.90 6.08 0.17 20.76 15.42 15.89 6.14 85.62 53.92. 0.027 0.027 0.68 0.0025 0.0020 0.0032 0.044 < 0.0001 < 0.00001. 0.77 0.83 1.17 0.40. 42.61 44.20 49.77 31.42. 0.43 0.30 0.01 0.76. 0.65. 39.55. 0.58. 0.18. 18.20. 0.90. 2.95 1.71 2.67 2.65 1.00 2.75 1.75 1.00 2.90 1.00 2.62 1.00 2.21 1.61 2.82 2.56 2.83 2.98 2.64 2.96 2.41. 55.10 7.10 141.50 87.49 0.08 7.02 11.60 0.88 22.93 23.89 5.24 0.036 23.25 19.83 12.22 9.60 19.17 34.36 34.51 49.80 34.98. < 0.0001 0.045 < 0.0001 0.0001 0.78 0.11 0.012 0.36 0.0044 0.00047 0.17 0.85 0.0023 0.0022 0.029 0.045 0.0067 0.0017 0.0010 0.00037 0.0009. 0.29 0.83 0.12 0.14. 26.16 43.98 12.78 14.62. 0.82 0.37 0.92 0.92. 4.34 3.16 5.13 1.66. 69.86 65.26 73.31 53.59. 0.39 0.48 0.06 0.81. 5.09. 71.78. 0.38. 2.22. 58.32. 0.74. 3.48 3.80 2.73 1.20. 66.28 67.81 62.36 46.52. 0.52 0.45 0.62 0.90. 0.89. 42.03. 0.92.
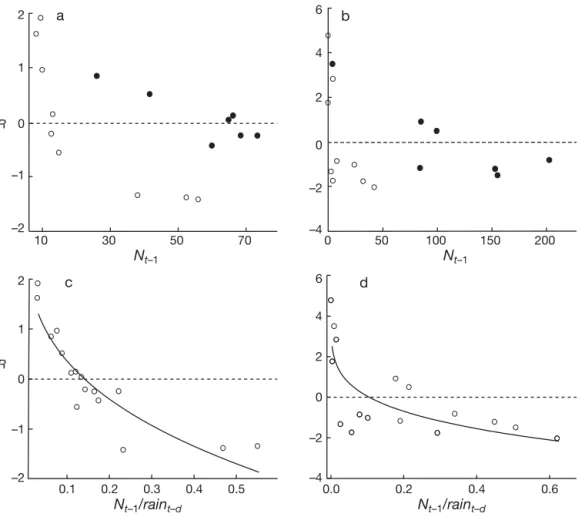
(5) 129. Lima et al.: Climate and small rodent dynamics. 6. a. 2. b. 4 1 2 R 0 0 –1 –2 –2 10. 30. 50. 70. –4. 0. 50. 100. Nt–1 2. 150. 200. Nt–1 6. c. d. 4 1 2. R 0. 0 –1. –2 –4. –2 0.1. 0.2. 0.3. Nt–1/raint–d. 0.4. 0.5. 0.0. 0.2. 0.4. 0.6. Nt–1/raint–d. Fig. 2. (a,c) Phyllotis darwini and (b,d) Akodon olivaceus. Relationship (a,b) between the logarithmic annual per capita rate of change (Rt = ln Nt – ln Nt –1) and population density (Nt–1), and (c,d) between the logarithmic annual per capita rate of change (Rt = ln Nt – ln Nt–1) and population density per unit of rainfall (Nt–1/current and lagged rainfall) for the 2 species of small rodent. (s) Dry years, (d) rainy years. Curves are the nonlinear Ricker logistic model (Eq. 5) fitted to the data. density and rainfall combined can be explained by the non-additive effects of rainfall (lateral perturbation conjunct variable Nt–1/[rain t + rain t–1] (Table 1), sugeffect, see model C in Table 2) resolved 85% of the gesting that a non-additive effect of rainfall and denvariation (Table 2). The difference in AIC values sity captures the true nature of the interaction. We between models B and C was only 0.63 (Table 2). observed a strong non-linear shape with a pronounced Therefore using AIC we could not discriminate concave curvature (Fig. 2). In sum, non-parametric between these 2 models. However, the simulated analysis suggested that rainfall represents a nondynamics of model C appeared to better predict the additive climatic force especially for P. darwini and it observed fluctuations of the P. darwini population than should be considered as a lateral perturbation effect the simulations of model B (Fig. 3a). (sensu Royama 1992), whereas for A. olivaceus, rainfall appears to have both Table 2. Fully parametric models fitted to rodent time series. DET: coefficient of (vertical and lateral effects), but the determination; AIC: Akaike information criteria. Variable names as in Table 1 additive (vertical) effect seems to be the dominant one (Table 1). R-function parametric models AIC DET We then fitted variants of the non-linear parametric model to the rodent A Rpdt = 3.5 – 1.89 × PDt–10.19 + 0.005 × raint 32.68 0.66 data. The exponential form of the logis17.82 0.86 B Rpdt = 3.5 – 1.58 × PDt–10.30 + 0.0052 × (raint + raint–1) C Rpdt = 3.5 – 6.45 × [PDt–1/(raint + raint –1)]0.32 18.15 0.85 tic model with additive rainfall effects D Raot = 5 – 4.98 × AOt–10.10 + 0.012 × raint 53.58 0.72 (vertical perturbation effect, see model E Raot = 5 – 4.91 × AOt–10.16 + 0.011 × (raint + raint–1) 49.93 0.77 B in Table 2) resolved 86% of the variF Raot = 5 – 6.96 × (AOt–1/raint)0.08 + 0.008 × raint 57.38 0.66 ation of per capita growth rates of PhylG Raot = 5 – 8.65 × [AOt–1/(raint + rain t–1)]0.14 + 0.009 × raint 49.41 0.79 lotis darwini whereas the model with.
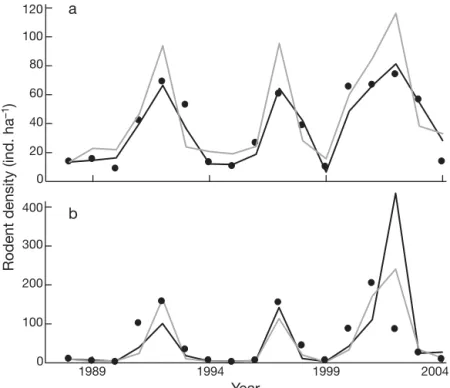
(6) 130. 120. Clim Res 30: 125–132, 2006. a. merical fluctuations in P. darwini appear to be a case of pure food-pulse driven dynamics, in which rainfall effects on K are 80 related to the increases in food availability. This is consistent with the idea that 60 small rodent populations are strongly 40 food-limited in this semi-arid system. Additionally, the R-function of P. darwini 20 showed a strong concave curvature, which is expected in species with low 0 maintenance costs and high reproductive 400 b potential, such as small rodents (K. Johst et al. unpubl.). On the other hand, the ir300 ruptions of A. olivaceus appear to have a different cause (see below). Secondly, ro200 dent dynamics at Fray Jorge appear to be driven by the amount of rain during the 100 previous 2 yr, whereas previous studies in semi-arid Chile have reported only the effects of the rainfall during the current 0 1989 1994 1999 2004 year (Lima et al. 1999, 2002a,b). Year Our very simple models appear to capFig. 3. Phyllotis darwini and Akodon olivaceus. Comparison of observed roture the essential features of the observed dent densities (points) with deterministic predictions (lines) for parameterized fluctuations and also suggest a mechanismodels (see Table 2). Models are fitted to data from 1989–2004. Runs began tic explanation for these fluctuations. In with an initial population size of (a) 14 individuals for Phyllotis darwini, and (b) 9 individuals for Akodon olivaceus. Simulations were implemented using terms of the non-linear logistic model, a the program MATHCAD 2000. Black line: Ricker model with lateral vertical climatic perturbation is equivarainfall effects; gray line: Ricker model with vertical rainfall effects lent to an effect on the parameter Rm, whereas a non-linear perturbation would act through parameter Q. In contrast, we found good The 2 best parametric models for Akodon olivaceus (models E and G in Table 2) explained 77 and 79% of evidence that for Phyllotis darwini climate actually acts the variation in per capita growth rates; the difference on K, causing a lateral perturbation to the R-function (Fig. 2). Lateral perturbations are particularly difficult in AIC values was 0.52, and thus we could not select a to analyze since the exogenous effect (e.g. rainfall) acts best model from these 2 options. However, simulations jointly with population density (as in the ratio N /K ). using model E appear to do a better job of predicting the observed dynamics than those using model G. Both Rainfall acts indirectly through the food supply by models failed to predict the decline during 2002 increasing productivity in this semi-arid ecosystem (Fig. 3b), but the Ricker model including rainfall as an (Holmgren et al. 2001, Jaksic 2001). Our confidence in additive effect (model E) appeared to capture the this model rests upon the logic of the underlying theostructure of the observed dynamics more effectively. retical argument as well as its strong predictive power (Fig. 3). This approach seems much more convincing than a purely phenomenological search for models 4. DISCUSSION with good fit to the data. Our analysis does not contradict previous analyses of this system (e.g. Meserve et There are 2 main findings on the role of rainfall and al. 2003); however, it provides a much more parsimonious and theoretically compatible interpretation. It the mechanistic causes of rodent fluctuations at Fray Jorge. Firstly, rainfall effects appear to operate differsupports the view that analysis of population data should be done within the framework of a credible theently on the 2 rodent species. Whereas rainfall appears to influence the environmental carrying capacity for oretical construct and that careful consideration should Phyllotis darwini (lateral perturbations, sensu Royama be given to the fine structure of the model (Berryman 1992), it has a primarily additive influence on maxi1992, 1999, Royama 1992). Finally, logistic models expressed in terms of ecological demand/offer ratios mum per capita growth rates for Akodon olivaceus represent a very plausible theoretical model structure (vertical perturbations, sensu Royama 1992). Thus, our analyses suggest that P. darwini and A. olivaceus irfor representing natural populations (Leslie 1948, ruptions are caused by different mechanisms. The nuBerryman 1999, 2004).. Rodent density (ind. ha–1). 100.
(7) Lima et al.: Climate and small rodent dynamics. As noted above, population fluctuations of Akodon olivaceus appear to be caused by a different mechanism to those of Phyllotis darwini. Although current and previous years’ rainfall have a lateral effect on the R values of A. olivaceus (Fig. 2b,d), the most important effect of rainfall is additive having mainly an effect on the maximum reproductive rate (Rm). One explanation for this difference could be the spatial dynamics observed in this species. A. olivaceus usually only maintains very low numbers in the thorn scrub in dry years and is more common in nearby mesic areas such as ‘aguadas’ (wet areas) and ‘quebradas’ (shallow ravines) where it is always found (Meserve et al. 2003). Thus, the additive effects of rainfall could be viewed as a proxy for habitat modification during wet years; that is, changes in plant cover and structure due to high rainfall years could convert the thorn scrub into a more suitable habitat for this species. Aguadas and quebradas may function in a manner similar to ‘sources’ and the thorn scrub as ‘sinks’ (sensu Pulliam 1988). These sinks experience a much greater increase in productivity in wet years, thus rendering them capable of sustaining large A. olivaceus populations during this time. Alternatively, the thorn scrub areas may be ‘sinks’ (sensu Watkinson & Sutherland 1995) in wet years due to immigration from source areas. Physiological factors do not appear important, as A. olivaceus shows less water dependence than P. darwini and similar efficiency in water regulation (Cortés et al. 2000); similarly, diet appears irrelevant as A. olivaceus is omnivorous whereas P. darwini is granivorousherbivorous (Meserve 1981). A final hypothesis is that A. olivaceus could be restricted to sites with sufficient cover to escape primarily avian predators; therefore, during dry years this species is only found in areas with persistent high cover such as aguadas and quebradas. In fact, the R-N and R-N/rain phase space for this species showed a depression at low densities (‘predator pit’, Fig. 2b,d) that could be caused by generalist predators influencing the R-functions of prey at low densities (Holling 1959, Berryman 1999). Thus, aguadas and quebradas may represent a permanent enemy-free area (Holling 1959) whereas thorn scrub is only so during wet years. In conclusion, the non-parametric approaches used here seem particularly useful for determining the form of underlying functions, but should be used in combination with simple theoretically based models. Our results show that simple models can be useful in explaining and predicting the dynamics of natural populations, particularly when they are based on a sound theoretical framework (Royama 1992, Berryman 1999). In particular, Royama’s (1992) classification of exogenous perturbation effects has been extremely useful in population modelling. Using these models together with Royama’s (1992) para-. 131. digm for classifying exogenous (climate) perturbations, we were able to distinguish how rainfall influences 2 semi-arid rodent species in different manners. The remarkable simplicity and generality (Ginzburg & Colyvan 2004) of the models used here for explaining rodent fluctuations at semi-arid northcentral Chile is also notable. Acknowledgements. M.L. acknowledges financial support from FONDECYT Grant No. 1020513. M.L., M.A.P. and P.L.M. are currently supported by NSF-LTREB 0319966.. LITERATURE CITED Bates DM, Watts DG (1988) Nonlinear regression analysis and its applications. Wiley, New York Berryman AA (1992) On choosing models for describing and analyzing ecological time series. Ecology 73:694–698 Berryman AA (1999) Principles of population dynamics and their applications. Stanley Thornes, Cheltenham Berryman AA (2004) Limiting factors and population regulation. Oikos 1105:667–670 Bjørnstad ON, Begon M, Stenseth NC, Falck W, Sait S, Thompson DJ (1998) Population dynamics of the Indian meal moth: demographic stochasticity and delayed regulatory mechanisms. J Anim Ecol 67:110–126 Cortés A, Rosenmann M, Bozinovic F (2000) Water economy in rodents: evaporative water loss and metabolic water production. Rev Chil Hist Nat 73:311–321 Gause GF (1934) The struggle for existence. Williams & Wilkins, Baltimore, MD Ginzburg LR, Colyvan M (2004) Ecological orbits. How planets move and populations grow. Oxford University Press, New York Gutiérrez JR, Meserve PL (2003) El Niño effects on the soil seed bank dynamics in north-central Chile. Oecologia 134:511–517 Hastie TJ, Tibshirani RJ (1990) Generalized additive models. Chapman & Hall, London Hilborn R, Redfield JA, Krebs CJ (1976) On the reliability of enumeration for mark and recapture census of voles. Can J Zool 54:1019–1024 Holling CS (1959) The components of predation as revealed by a study of small mammal predation of the European pine sawfly. Can Entomol 91:293–320 Holmgren M, Scheffer M, Ezcurra E, Gutierrez JR, Mohren GMJ (2001) El Niño effects on the dynamics of terrestrial ecosystems. Trends Ecol Evol 16:89–94 Jaksic FM (2001) Ecological effects of El Niño in terrestrial ecosystems of western South America. Ecography 24: 241–250 Jaksic FM, Silva SI, Meserve PL, Gutiérrez JR (1997) A longterm study of vertebrate predator responses to an El Niño (ENSO) disturbance in western South America. Oikos 78: 341–354 Leslie PH (1948) Some further notes on the use of matrices in population mathematics. Biometrika 35:213–245 Lima M, Jaksic FM (1999) Population dynamics of three Neotropical small mammals: time series models and the role of delayed density-dependence in population irruptions. Aust J Ecol 24:25–34 Lima M, Keymer JE, Jaksic FM (1999) ENSO-driven rainfall variability and delayed density dependence cause rodent outbreaks in western South America: linking demography.
(8) 132. Clim Res 30: 125–132, 2006. and population dynamics. Am Nat 153:476–491 Lima M, Stenseth NC, Jaksic FM (2002) Population dynamics of a South American small rodent: seasonal structure interacting with climate, density-dependence and predator effects. Proc R Soc Lond B Biol Sci 269:2579–2586 López-Cortés F, López D (2004) Antecedentes bioclimáticos del Parque Nacional Bosque Fray Jorge. In: Squeo FA, Gutiérrez JR, Hernández IR (eds) Historia Natural del Parque Nacional Bosque Fray Jorge. Ediciones Universidad de La Serena, La Serena, p 45–60 Meserve PL (1981) Trophic relationships among small mammals in a Chilean semiarid thorn scrub community. J Mammal 62:304–314 Meserve PL, Milstead WB, Gutierrez JR (2001) Results of a food addition experiment in a north-central Chile small mammal assemblage: evidence for the role of ‘bottom-up’ factors. Oikos 94:548–556 Meserve PL, Kelt DA, Milstead WB, Gutiérrez JR (2003) Thirteen years of shifting top-down and bottom-up control. BioScience 53:633–646. Pearson OP (1975) An outbreak of mice in the coastal desert of Peru. Mammalia 39:375–86 Pulliam HR (1988) Sources, sinks, and population regulation. Am Nat 132:250–266 R Development Core Team (2004) R: a language and environment for statistical computing. R Foundation for Statistical Computing, Vienna Richards FJ (1959) A flexible growth function for empirical use. J Exp Bot 10:290–300 Ricker WE (1954) Stock and recruitment. J Fish Res Board Can 11:559–623 Royama T (1992) Analytical population dynamics. Chapman & Hall, London Stenseth NC, Mysterud A, Ottersen G, Hurrell JW, Chan KS, Lima M (2002) Ecological effects of climate fluctuations. Science 297:1292–1296 Watkinson AR, Sutherland WJ (1995) Sources, sinks and pseudo-sinks. J Anim Ecol 64:126–130 Wood SN (2001) mgcv: GAMs and generalized ridge regression for R. R News 1(2):20–25. Editorial responsibility: Nils Chr. Stenseth, Oslo, Norway. Submitted: October 7, 2005; Accepted: December 11, 2005 Proofs received from author(s): January 25, 2006.
(9)
Figure
Documento similar