TítuloLeukocyte telomere length in patients with radiographic knee osteoarthritis
7
0
0
Texto completo
(2) INTRODUCTION Telomeres are nucleoprotein structures assembled at the ends of eukaryotic chromosomes. They perform a capping function protecting chromosomes from recognition as damaged DNA ends and inappropriate degradation, therefore being essential to genome integrity and stability (Lansdorp, 2009). DNA of human telomeres comprises near 5–15 kb of a tandem repeated G‐rich sequence (5′‐TTAGGG‐3′) paired with a C‐rich complementary strand (5'‐CCCTAA‐3′). Protein complexes organize with telomeric DNA contributing to structural stability and regulating telomere length. These include the shelterin complexes and nucleosomes enriched in epigenetic modifications, which contribute to a compacted chromatin packing. Moreover, TERRA (Telomere‐Repeat‐Containing‐RNA) is a long noncoding RNA which participates in the organization of the telomeric chromatin structure and telomere capping (Galati et al., 2013). Telomere biology is strongly associated with aging and age‐related pathologies. After each round of DNA replication there is a loss of 50–150 pb of the end of the telomere sequence. Telomerase replaces the telomeric sequences, but somatic cells do not show telomerase activity so telomeres progressively shorten with aging. When critically eroded, telomeres lose their capping function and trigger a DNA damage response resulting in replicative senescence, where cells stop dividing or die through apoptosis. The replicative senescence is a tumor suppressor mechanism to avoid the chromosomal instability which would result from end‐to‐end chromosomal fusions by uncapped telomeres (Lansdorp, 2009). Telomere length decreases with aging in somatic cells and could be a factual marker of biological age. Accordingly, several studies in human populations point to telomere size measured in peripheral blood leukocytes (PBL) as a predictor of lifespan (Deelen et al., 2014; Rode et al., 2015). Moreover, several meta‐analyses suggest that telomere size measured in PBL is useful to assess the individual predisposition to numerous pathologies associated to aging, like several cancers, diabetes and cardiovascular disease (Ma et al., 2011; Zhao et al., 2013; Haycock et al., 2014). Osteoarthritis (OA) is an age‐related chronic disease characterized by localized progressive degeneration and loss of articular cartilage. This is the most common articular disease affecting to more than 50% of population over 65 years of age and also a leading cause of labor inability (March and Bachmeier, 1997). OA seems to be a consequence of chondrocyte dysfunction, so degradation of extracellular matrix predominates over regeneration. This is accompanied by remodelling of subchondral bone, local inflammation of synovia, degeneration of ligaments and meniscus and hypertrophy of the joint capsule (Buckwalter and Martin, 2006). When chondrocytes are undergoing senescence, they progressively lose the ability to synthesize the extracellular matrix and also release proinflammatory cytokines, developing a senescent‐associated secretory phenotype (SASP) which aggravates the progression of OA lesions (Watanabe et al., 2017). OA chondrocytes exhibit a senescent associated phenotype (McCulloch et al., 2017). The telomeres of chondrocytes could be involved in the development and progression of OA. Accordingly, telomeres from OA chondrocytes are shorter than those from healthy chondrocytes and this could precipitate articular senescence (Tamayo et al., 2011). Moreover, the closer the articular sample to the OA lesion, the shorter the telomere size (Harbo et al., 2012). This seems to be related to advanced senescence and the local severity of the illness. The chondrocyte is not a habitual dividing cell. Although chondrocytes from later stage OA may undergo some limited cell divisions to try to compensate apoptotic dead cells, the main mechanism of telomere attrition should be a consequence of the local oxidative stress associated with a low‐grade chronic inflammation characteristic of the disease. In fact, guanines are particularly damaged by oxidative stress and telomeres contain G rich sequences and shorten when cells are cultured under environments of oxidative stress (Zglinicki, 2002; Yudoh et al., 2005)..
(3) Although telomeres from OA chondrocytes clearly seem shortened, the modification of telomeres in PBL from OA patients is controversial. Zhai et al. (2006) reported shorter telomeres in PBL from patients with hand OA. This was also found in a group of 80 patients with knee OA (Poonpet et al., 2017). Nevertheless, Tamayo et al. (2010) did not find significant differences between patients with knee OA (n = 34) and controls. The conflicting results may be due to a small number of patients. Otherwise, the finding of association between PBL telomeres and OA could be an artefact, since other health parameters known to be associated with PBL telomere size, like age, hypertension and obesity/body mass index (BMI), could be concomitant in OA patients behaving as confunding factors (Zhang et al., 2014; Révész et al., 2014). To accurately confirm the association between OA and PBL telomeres, clinically well‐characterized individuals with verifiable data of OA severity should be evaluated, using logistic regression analysis to assess the possible influence/interference of confunding factors.. MATERIALS AND METHODS Subjects In the present study, the association of PBL telomere size with the presence or not of knee OA and its associated grade was studied in individuals from a subsample of the Osteoarthritis Initiative (OAI) consortium from the USA (n = 310). Subjects were recruited in four centers (Memorial Hospital of Rhode Island, The Ohio State University, University of Maryland and Johns Hopkins University, and the University of Pittsburgh) between February 2004 and May 2006, with an age range of 45–79 years (mean 59.1). The subsample was restricted to Caucasian participants since it was initially an element of a research program evaluating the influence of mitocondrial DNA (mtDNA) haplogroups in OA, comparing the OAI with a Spanish cohort. OA Severity Diagnosis In order to maintain objectivity in evaluation of OA severity, individuals were assessed through the radiologic knee images, according to the Kellgren–Lawrence (KL) score, ranging from 0 to 4; 0: no osteophyte or joint space narrowing, that is, without OA (n = 110), 1: questionable osteophyte or joint space narrowing (n = 76), 2: small osteophyte(s) or mild joint space narrowing (n = 64), 3: moderate osteophyte(s) or joint space narrowing (n = 48), 4: large osteophyte(s) or joint space narrowing (n = 12). Prevalent radiographic knee OA at recruitment was defined when an individual had a maximum KL grade (max‐KL) ≥2 considering both knees (n = 124). The OAI study was approved by the institutional review boards at each OAI clinical site and the coordinating center (University of California, San Francisco) and informed consent was obtained from the participants. Telomere Length Assay DNA from PBL was extracted from the blood sample obtained at recruitment in the OAI consortium. Coded DNA samples were processed by personnel blinded to the status of the subjects. The average telomere amount in PBL was measured with a standard validated quantitative PCR (qPCR)‐based assay as described (Tamayo et al., 2010). This method measures the average ratio of telomere repeat copy number to a single gene (36B4) copy number (T/S ratio) in each sample and may be considered and indirect measure of mean telomere length..
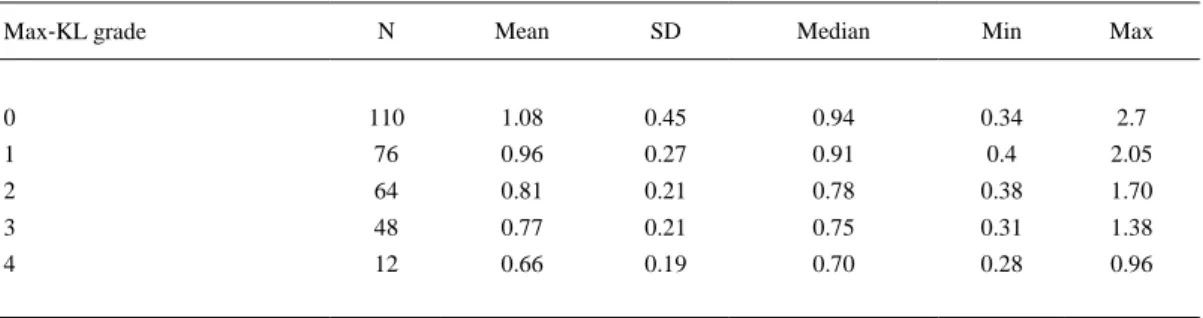
(4) Statistical Analysis Data were analyzed using SPSS software (Chicago, Ilinois, USA). Since T/S ratio were not normally distributed, as ascertained by the Kolmogorov–Smirnov test, nonparametric Mann– Whitney U‐test and Spearman's (r) test were performed for homogeneity testing and correlation analysis, respectively. Jonckheere–Terpstra test allowed to evaluate the ordered relationship between KL grade and T/S ratio. Logistic regression analysis was performed to assess PBL telomere size and habitual health parameters as associated risk factors of radiologic knee OA. Significance was defined as P < 0.05.. RESULTS PBL telomere length decreased progressively as the max‐KL grade of the knees from the individual increased, following a statistically ordered relationship (Jonckheere–Terpstra test, P < 0.0001) (Table 1). The T/S ratio was significantly shorter in subjects with KL ≥2 in comparison with those with KL <2 (Mann–Whitney U‐test, P < 0.0001). Besides radiographic OA, shorter PBL telomeres were significant in individuals with hypertension. Moreover, significance was very close in subjects with diabetes mellitus, taking into account that there were only 14 in the whole population. A negative correlation was also found between the PBL telomere size and age, as well as the body mass index (BMI) and waist circumference (Table 2). No differences were found between males and females (Mann–Whitney U‐test, P = 0.731).. Table 1. Statistical Values of Mean Telomere Length (measured as T/S ratio) in Peripheral Blood Leukocytes from Subjects without Knee Osteoarthritis (OA), that is, Maximum Radiologic Kellgren–Lawrence (max‐KL) Grade 0 or 1, and with Progressive Severity of Knee OA (max‐KL grade from 2 to 4) N. Mean. SD. Median. Min. 0. 110. 1.08. 0.45. 0.94. 0.34. 2.7. 1. 76. 0.96. 0.27. 0.91. 0.4. 2.05. 2. 64. 0.81. 0.21. 0.78. 0.38. 1.70. 3. 48. 0.77. 0.21. 0.75. 0.31. 1.38. 4. 12. 0.66. 0.19. 0.70. 0.28. 0.96. Max‐KL grade. Max. Table 2. Relationship Between PBL Telomere Size and Current Associated Health Factors. Parentheses Indicate Rho Spearman Correlation Coefficient P. Hypertension (Yes/No). Mann–Whitney U‐test. Diabetes (Yes/No). 0.089 <0.001 (−0.209). Age (years) BMI (Kg/m2) Waist circumference (cm). 0.016. Spearman rank correlation. <0.001 (−0.259) 0.019 (−0.153).
(5) Binary regression logistic analysis indicated that age and BMI were risk factors significantly associated with radiologic knee OA. Outstandingly, PBL telomere length was discovered to be a consistent independent associated‐risk factor contributing to the prevalence of radiologic knee OA, independent of age, hypertension, BMI and diabetes (Table 3). Hypertension and diabetes mellitus did not reach statistical significance as a risk factor when PBL telomere size was introduced in the logistic regression analysis. The magnitude of the associations must be considered within the characteristics of the subsample of Caucasian subjects analyzed in the present research and could change when studying other populations.. Table 3. Logistic Regression Analysis of the Association of PBL Telomere Size and Habitual Health Parameters with Concurrent Knee Osteoarthritis Odds ratio. 95% Confidence interval. P. PBL telomere length (T/S ratio). 0.053. 0.02–0.17. <0.001. Hypertension (Yes/No). 0.982. 0.55–1.76. 0.982. Diabetes (Yes/No). 0.918. 0.28–3.01. 0.918. Age (years). 1.039. 1.01–1.07. 0.015. BMI (Kg/m2). 1.102. 1.04–1.17. 0.001. DISCUSSION The association between PBL telomeres and OA concurrence should not be a direct one. Chondrocytes and PBL have different lineage origin. Chondrocytes derive from mesenchymal stem cells, whereas leukocytes differentiate from hematopoietic stem cells located mainly in the bone marrow of adults. Moreover, PBL and chondrocytes exhibit a different turnover rate. Both are differentiated, primarily quiescent cell types. But unlike chondrocytes, leukocytes undergo an active turnover, variable depending on the different myeloid or lymphoid subpopulations, so the mitotic activity of hematopoietic stem cells should be more frequent. Although they exhibit some telomerase activity, this is insufficient to prevent telomere shortening associated with DNA replication and cell division. The aforementioned fact could explain the differences in telomere length in these different cell types, since telomeres from chondrocytes are longer than telomeres from PBL from the same subject, even in OA patients (Tamayo et al., 2011). In conclusion, the differences in lineage and telomere physiology between PBL and chondrocytes suggest that the association between PBL telomere size and risk of presence of knee OA may be indirect. In spite of their different lineage and turnover, there appears to be a correlation between the length of telomeres from leukocytes and from other tissues from the same subject (Okuda et al., 2002; Wilson et al., 2008). The PBL telomere size was found to be shorter in individuals susceptible to several age‐related pathologies, as herein described for knee OA (Ma et al., 2011; Zhao et al., 2013; Haycock et al., 2014). Moreover, PBL telomere size is also a recognized marker of biological age. Then, PBL telomere size would not be a direct indicator of local disease, but a systemic and unspecific marker of biological aging which would not necessarily be correlated with chronological age. Systemic accelerated aging may be a consequence of genetic factors, environmental causes or both. Subjects with accelerated global biological aging, that is, with shorter PBL telomeres, would be more susceptible to age‐related diseases. The development of specific age‐associated illness could possibly be determined by the more advanced senescent tissue through interaction of telomere biology with other synergistic risk factors (Blackburn et al., 2015)..
(6) CONCLUSION Based on the present study, a background of accelerated aging could potentiate the effect of OA risk factors. Genetic risk factors that influence the incidence and severity of OA include the different mtDNA haplogroups, which may modify the production of damaging mitochondrial reactive oxygen species (Fernández‐Moreno et al., 2017). Importantly, environmental stressors like trauma or interactive environmental–genetic–metabolic influences like obesity or diabetes may contribute to OA development and severity, possibly through chronic inflammation. In fact, obesity and metabolic syndrome promote biological aging and are associated with shorter PBL telomeres (Révész et al., 2014). Increased abdominal adiposity was found to be associated with accelerated PBL telomere attrition (Wulaningsih et al., 2016). Shorter PBL telomeres may indicate a premature aging condition which enhances chondrocyte senescence. Aged cartilage would be less resistant to damaging mechanical, inflammatory and metabolic stressors, thus favoring the development and progression of degenerative joint pathology.. AUTHOR CONTRIBUTIONS JLF and FJB designed the study and prepared the manuscript draft. AM and IR‐P performed the techniques and analyzed the data. All authors approved the final manuscript.. ACKNOWLEDGMENTS The work was supported by Fondo de Investigaciones Sanitarias (FIS) from Spain, PI17/01987 and PI16/02124. We are grateful to the OAI consortium and to Prof. Michael E. Kjelland for revision of the manuscript.. REFERENCES Blackburn, EH, Epel, ES, Lin, J. 2015. Human telomere biology: A contributory and interactive factor in aging, disease risks, and protection. Science 350: 1193– 1198. Buckwalter, JA, Martin, JA. 2006. Osteoarthritis. Adv Drug Deliv Rev 58: 150– 167. Deelen, J, Beekman, M, Codd, V, Trompet, S, Broer, L, Hägg, S, Fischer, K, Thijssen, PE, Suchiman, HE, Postmus, I, Uitterlinden, AG, Hofman, A, de Craen, AJ, Metspalu, A, Pedersen, NL, van Duijn, CM, Jukema, JW, Houwing‐Duistermaat, JJ, Samani, NJ, Slagboom, PE. 2014. Leukocyte telomere length associates with prospective mortality independent of immune‐related parameters and known genetic markers. Int J Epidemiol 43: 878– 886. Fernández‐Moreno, M, Soto‐Hermida, A, Vázquez‐Mosquera, ME, Cortés‐Pereira, E, Pértega, S, Relaño, S, Oreiro‐Villar, N, Fernández‐López, C, Blanco, FJ, Rego‐Pérez, I. 2017. Mitochondrial DNA haplogroups influence the risk of incident knee osteoarthritis in OAI and CHECK cohorts. A meta‐analysis and functional study. Ann Rheum Dis 56: 263– 270. Galati, A, Micheli, E, Cacchione, S. 2013. Chromatin structure in telomere dynamics. Front Oncol 3: 46. Haycock, PC, Heydon, EE, Kaptoge, S, Butterworth, AS, Thompson, A, Willeit, P. 2014. Leucocyte telomere length and risk of cardiovascular disease: Systematic review and meta‐ analysis. BMJ 349: g4227. Lansdorp, PM. 2009. Telomeres and disease. EMBO J. 28: 2532– 2540. Ma, H, Zhou, Z, Wei, S, Liu, Z, Pooley, KA, Dunning, AM, Svenson, U, Roos, G, Hosgood, HD, Shen, M, Wei, Q. 2011. Shortened telomere length is associated with increased risk of cancer: A meta‐analysis. PLoS One 6: e20466. March, LM, Bachmeier, CJM. 1997. Economics of osteoarthritis: a global perspective. Baillieres Clin Rheumatol 11: 817– 834. McCulloch, K, Litherland, GJ, Rai, TS. 2017. Cellular senescence in osteoarthritis pathology. Aging cell 16: 210– 218..
(7) Okuda, K, Bardeguez, A, Gardner, JP, Rodriguez, P, Ganesh, V, Kimura, M, Skurnick, J, Awad, G, Aviv, A. 2002. Telomere length in the newborn. Pediatr Res 52: 377– 381. Poonpet, T, Saetan, N, Tanavalee, A, Wilairatana, V, Yuktanandana, P, Honsawek, S. 2018. Association between leukocyte telomere length and angiogenic cytokines in knee osteoarthritis. Int J Rheum Dis 21: 118– 125. Révész, D, Milaneschi, Y, Verhoeven, JE, Penninx, BW. 2014. Longitudinal associations between metabolic syndrome components and telomere shortening. J Clin Endocrinol Metab 100: 3050– 3059. Rode, L, Nordestgaard, BG, Bojesen, SE. 2015. Peripheral blood leukocyte telomere length and mortality among 64,637 individuals from the general population. J Natl Cancer Inst 107: djv074. Tamayo, M, Mosquera, A, Rego, JI, Fernandez‐Sueiro, JL, Blanco, FJ, Fernandez, JL. 2010. Differing patterns of peripheral blood leukocyte telomere length in rheumatologic diseases. Mutat Res 683: 68– 73. Tamayo, M, Mosquera, A, Rego, JI, Blanco, FJ, Gosálvez, J, Fernández, JL. 2011. Decreased length of telomeric DNA sequences and increased numerical chromosome aberrations in human osteoarthritic chondrocytes. Mutat Res 708: 50– 58. Watanabe, S, Kawamoto, S, Ohtani, N, Hara, E. 2017. Impact of senescence‐associated secretory phenotype and its potential as a therapeutic target for senescence‐associated diseases. Cancer Sci 108: 563– 569. Wilson, WR, Herbert, KE, Mistry, Y, Stevens, SE, Patel, HR, Hastings, RA, Thompson, MM, Williams, B. 2008. Blood leucocyte telomere DNA content predicts vascular telomere DNA content in humans with and without vascular disease. Eur Heart J 29: 2689– 2694. Wulaningsih, W, Watkins, J, Matsuguchi, T, Hardy, R. 2016. Investigating the associations between adiposity, life course overweight trajectories, and telomere length. Aging 8: 2689– 2701. Yudoh, K, Nguyen, T, Nakamura, H, Hongo‐Masuko, K, Kato, T, Nishioka, K. 2005. Potential involvement of oxidative stress in cartilage senescence and development of osteoarthritis: oxidative stress induces chondrocyte telomere instability and downregulation of chondrocyte function. Arthritis Res Ther 7: R380– R391. Zglinicki, VT. 2002. Oxidative stress shortens telomeres. Trends Biochem Sci 27: 339– 344. Zhai, G, Aviv, A, Hunter, DJ, Hart, DJ, Gardner, JP, Kimura, M, Lu, X, Valdes, AM, Spector, TD. 2006. Reduction of leucocyte telomere length in radiographic hand osteoarthritis: a population‐ based study. Ann Rheum Dis 65: 1444– 1448. Zhang, DH, Wen, XM, Zhang, L, Cui, W. 2014. DNA methylation of human telomerase reverse transcriptase associated with leukocyte telomere length shortening in hyperhomocysteinemia‐ type hypertension in humans and in a rat model. Circ J 78: 1915– 1923. Zhao, J, Miao, K, Wang, H, Ding, H, Wang, DW. 2013. Association between telomere length and type 2 diabetes mellitus: A meta‐analysis. PLoS One 8: e79993..
(8)
Figure

Documento similar
