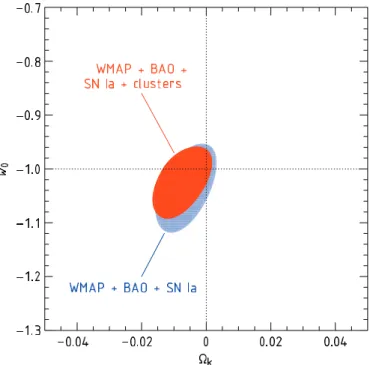
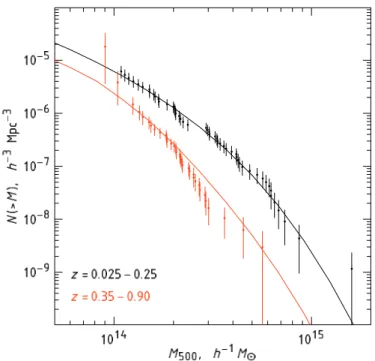
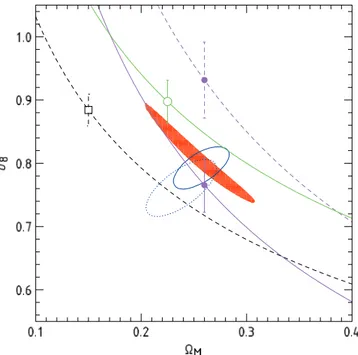
Chandra Cluster Cosmology Project III: Cosmological Parameter Constraints
Texto completo
Figure


Documento similar
While Russian nostalgia for the late-socialism of the Brezhnev era began only after the clear-cut rupture of 1991, nostalgia for the 1970s seems to have emerged in Algeria
It might seem at first that the action for General Relativity (1.2) is rather arbitrary, considering the enormous freedom available in the construction of geometric scalars. How-
Since the dilepton mass distribution and lifetime- related variables are only weakly correlated in simulated background candidates, the shape of the mass distribution is
To do that, we have introduced, for both the case of trivial and non-trivial ’t Hooft non-abelian flux, the back- ground symmetric gauge: the gauge in which the stable SU (N )
As a means to probe the possible fractal structure of the galaxy distribution we have studied the scaling of the num- ber density and angular correlation function of galaxies
Abstract: We delineate the allowed parameter and mass range for a wino-like dark matter particle containing some Higgsino admixture in the MSSM by analysing the constraints from
We show only the shape of the signal distribution as a function of frequency ω scaled by the axion mass m a. As in previous figures the red-dashed line shows the SHM, whereas the
MD simulations in this and previous work has allowed us to propose a relation between the nature of the interactions at the interface and the observed properties of nanofluids:
