A Meta Review of Indoor Positioning Systems
45
0
0
Texto completo
(2) Sensors 2019, 19, 4507. 2 of 45. publication); the elusiveness of a system that is accurate, cheap and applicable to many indoor environments at the same time; and the promise from industry of rapid adoption and billionaire investments for such golden system. This work contributes with a meta-review (a systematic review of systematic reviews) of IPS research, deepening on Bluetooth Low Energy (BLE)-based and WiFi-based fingerprinting for smartphones. The meta-review addressed 61 selected surveys of IPS topics. Unlike regular reviews, our meta-review addresses topics of IPS from the point of view of surveys and not specific works. Every definition or explanation is the result of a consensus found on, or inferred from, several reviews. The paper provides three description sections, devoted to the introduction to IPS, a review of technologies used in IPS, and brief descriptions of methods and challenges for WiFi-based and BLE-based IPS for smartphones. The explanations in the description sections were supported, whenever possible, using references to the selected surveys works. Thus, the compiled meta-review allows the reader to view IPS current state at a glance and have direct links to deepens on the technology of her/his choosing. The meta-review detected that, currently, no survey focuses on BLE-based indoor positioning or radio map enrichment methods. Thus, this paper included brief reviews of proposals that belong to those two topics. The description sections are followed by a discussion section, in which the abundance and academic significance of published IPS works are analyzed. The analyses were performed based on the number of citations of each work, first attending to the references of the selected surveys and later using the Google Scholar citation counts for some selected works. The results showed that most of the works referenced in the surveys lack a significant impact on the IPS literature. Therefore, the three main contributions of this work are: • • •. A curated compilation of IPS surveys published in the last 5 years. Brief reviews of IPS solutions that addressed BLE-based indoor positioning and radio map enrichment methods. An analysis of IPS current state based on citations to works found in the selected surveys.. The paper proceeds with a short introduction to indoor positioning systems (Section 2), including the definition of accuracy and other IPS evaluation metrics. Later, Section 3 describes the main technologies used for indoor positioning, including the description of techniques and some methods applied to each of them. Section 4 then addresses smartphone-based indoor positioning using WiFi and BLE fingerprinting, including its associated challenges. Later, Section 5 performs the comprehensive analysis over 62 well-known surveys that draws insights on the works’ academic impact. Finally, Section 6 presents some concluding remarks. 2. Positioning in Indoor Scenarios Positioning systems can be global or local. Global positioning systems can provide position estimations world-wide. The global positioning systems currently available are collectively called the Global Navigation Satellite System (GNSS). The GNSS-based positioning has had large success as a result of its availability, coverage, and the existence of receivers that are both cheap and compact-sized. However, it is not adequate for all scenarios and applications because of accuracy requirements and the degradation of satellite signals. Local positioning systems are the ones applied for those specific scenarios and applications where GNNS positioning is not appropriate. The locality or coverage of those positioning systems varies significantly. They range from systems based on networks of pseudolites that can cover very large areas to light-based systems that are typically applied to rooms. This paper focuses on local positioning systems indented to provide position estimation inside buildings, which are known as Indoor Positioning Systems. The materials and structures of modern buildings may influence notably on the signals from GNNS. At indoors, those signals reach receivers with a level of degradation that makes the civilian-graded accuracy of GNSS insufficient for many indoor applications. Furthermore, indoor environments are normally crowded with fixed and moving obstacles, including people. The obstacles.
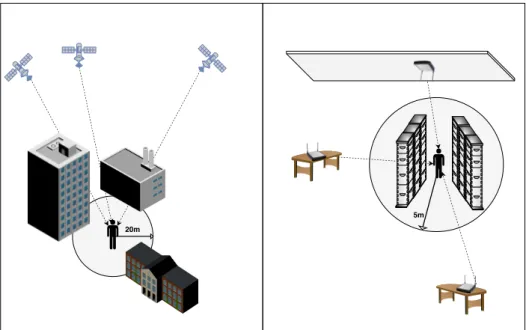
(3) Sensors 2019, 19, 4507. 3 of 45. interact in undesirable ways with the signals, causing reflections and absorption. Given that people are increasingly spending most of their time indoors [6], the large efforts devoted along the past 15 years to find new solutions to IPS seems reasonable. Even if GNSS signals were not so significantly degraded by buildings, local positioning systems will still be needed for indoor LBS applications. Some applications require positioning accuracies far beyond those that GNNS can provide. For example, a robot performing precise operations and whose next move could not be determined in an offline planning step will probably require a millimeter level accuracy. Furthermore, the accuracy requirements for pedestrian applications may be related to the size of the target environment. The comfort thresholds of people regarding the positioning accuracy can be related to the free space they have around, as depicted in Figure 1. The typical accuracy for a smartphone’s GNSS receptor under open sky conditions is 4.9 m [7], which is fine for someone at a park or wide street. However, that distance may be misleading in indoor environments. For example, a mean accuracy of 5 m would be insufficient to tell apart consecutive lanes among bookshelves in a library, which sometimes are less than 1 m apart from each other. Therefore, an IPS applicable to most indoors environments and applications would preferably have mean accuracies around 1 m to 2 m.. 5m 20m. Figure 1. The magnitude of a positioning error matters differently to a person depending on the context.. Accuracy is the degree of conformance, or the closeness, between an estimated or measured position and the true position of a subject or object at a given time [8]. The above accuracy definition is wide. However, given the significant number of different existing (indoor) positioning systems, it is difficult to have a narrower definition or only one metric [9,10]. Even though accuracy is of utmost importance, it is not the only criterion taken into account for assessing an IPS. Coverage, complexity, robustness, scalability, cost, privacy and power consumption are metrics typically used for IPS evaluation and comparison [11–15]: • • • • •. Coverage refers to the range of the signals from the technology that supports an IPS [11]. A high coverage can translate into the IPS’ applicability to large areas using a low number of emitters [15]. Complexity refers to the efforts required for the construction, deployment or configuration of the hardware and software of the IPS [12–14]. Robustness is the system’s resilience to conditions beyond those that are considered nominal [12]. Scalability relates to the system’s ability to provide positioning for a large number of users in large spaces [12,15]. Cost refers to any kind of cost related to the positioning devices or the required infrastructure [11,12]..
(4) Sensors 2019, 19, 4507. • •. 4 of 45. Privacy is related to system restrictions that avoid the collection of information that may be used to identify or track the users [11,13,14]. Finally, the lower power requirements, the better. In user devices, a low power requirement translates into a low battery drain. For the IPS infrastructure, a low power consumption may translate into that only small efforts are required for the maintenance of, e.g., battery-powered devices [11,15].. 3. An Overview of IPS Solutions The high demand for IPS has driven an increasing number of research works along the past 15 years or more. The number of IPS proposals found in this period is very large, which is reflected in the number of references of recent IPS-related survey works. Some IPS-related reviews have over 200 references [16–21] or even over 300 references [22]. The insights presented in the rest of this paper are mainly based on 62 IPS-related survey works [6,11–72] published between 2015 and 2019. Of them, 47 were published in periodic publication journals. Surveys that only briefly mentioned indoor positioning techniques or whose content was not available online, such as Aparicio et al. [73], were not considered. Table 1 shows the number of the selected surveys that were published each year. Table 1. Publication year distribution of the selected surveys. Year. 2015. 2016. 2017. 2018. 2019. Number. 12. 16. 13. 13. 7. The notable number of surveys has driven them into narrow focuses. However, some of them have addressed a broad spectrum of solutions applicable to indoor positioning [11–15,45–48,57]. It is common that these “general” surveys difference from previous surveys not only by providing updates of new IPS solutions but by proposing new taxonomies or by discussing more than others about specific aspects such as specific applications or challenges. Xiao et al. [45] provides a valuable division between device-free and device-based IPS solution across several technologies. [47] states that hybrid systems are the ones most suited to mass-market applications, and thus focus on reviewing some solutions that combine several techniques. Yassin et al. [14] devotes a section to limits of positioning, though it is brief and has a small number of references to other works. It also features a section devoted to cooperative positioning and data fusion, which provides interesting examples but lack of a clear definition that separates the two concepts. Sakpere et al. [13] is relatively recent, deals with almost all technologies, makes no restriction on specific applications, has a large number of references and discusses the challenges and drawbacks of each technology. Brena et al. [46] is comprehensive, and tells apart “passive” from “active” solutions, considering passive those in which only the infrastructure generates the signal used for positioning. Basiri et al. [11] provides a review of the IPS research status supported by a literature review and a survey whose responders were mainly LBS ordinary users, LBS researchers, LBS market analysts, and LBS application developers. Such a survey was a necessity, given that the usages and goals of IPS are clearly beyond the published academic works. Zafari et al. [15] is, to the best of our knowledge, the most recent IPS survey (2019). This survey stands out for its Internet of Things (IoT) flavor that links IoT and indoor positioning. Also, it devotes a section to IPS applications and provides a summary of the main IPS challenges and their suggested solutions. Other surveys restricted the reviewed solutions by technology. For example, Maghdid et al. [41] and Davidson and Piche [48] described solutions that were applicable to smartphones. In particular, Davidson and Piche [48] is relatively recent which is remarkable because of conciseness that properly weights explanations and references, while addressing every major aspect of smartphone-based IPS. If the goal of the reader is positioning for smartphone applications, Davidson and Piche [48] is recommended as a first reading. There is not a clear consensus among this “general”, or other, surveys on a strict taxonomy for IPS. The most commonly found classification attends to the underlying technology. The technology then.
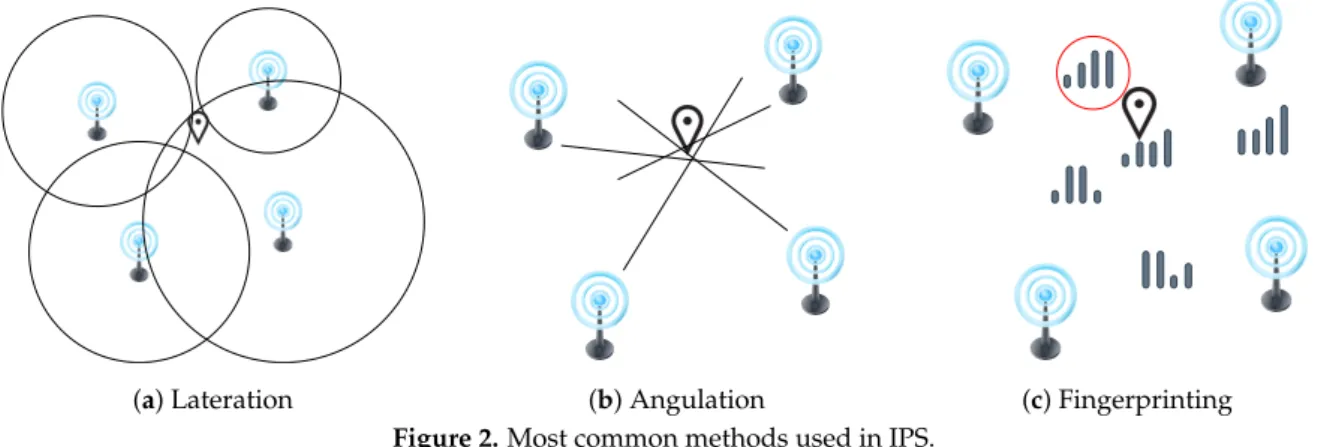
(5) Sensors 2019, 19, 4507. 5 of 45. determines which physical quantities the system can measure. The physical quantities are also used for IPS classification and are commonly addressed as the applied techniques. On top of technologies and techniques, there is a myriad of methods that, from the measured quantities, create position estimations. The methods also tend to be classified into range-based or range-free methods, depending on whether they estimate distances or angles to known landmarks like, e.g., the signal emitters. The following list briefly introduces the most common techniques employed with technologies used in IPS. They are addressed in almost all the selected surveys and they are often mentioned in the rest of this section. Some general surveys [12,22,41] include explanation and usages of other techniques such as Received Signal Phase (RSF), Roundtrip Time of Flight (RTF) or Channel State Information (CSI). •. •. • •. Time of Arrival (TOA). It measures the time of arrival of the signal from an emitter, as recorded by the receiver. It is used for estimating the distance to each emitter, as the propagation speed of the signal (sound, radio frequencies) is known for the transmission medium (air). Time Difference of Arrival (TDOA). It is similar to TOA. It measures the differences in the time of arrival of signals from different emitters. It is used for estimating differences in distances to each emitter. Angle of Arrival (AOA). It refers to the angle at which the signal reaches the sensor. Angles are then used to obtain a position fix. Received Signal Strength (RSS). It is the intensity at which the signal from an emitter is measured. The signal strength decreases as the distance to the emitter increases, although their relation may be affected by attenuation and interference.. The technique employed for a solution determines how the position is estimated. TOA, TDOA, and RSS are used for estimating distances to signal emitters. The estimated distances to a set of emitters are then used in what is called lateration to find the position estimate that best fit the set of distances (see Figure 2a). Lateration is called trilateration if three distances are used, while it is called multilateration if more than three are used. The angles obtained in AoA are used to compute a likely fix on the target position, as shown in Figure 2b, in what is known as angulation. Both lateration and angulation are commonly classified as range-based—or ranging—methods, and they require the previous knowledge of the positions of the emitters. The RSS technique is also employed for a range-free method, very popular in IPS, called fingerprinting or sometimes scene analysis. The fingerprinting encompasses two stages. In the first stage, also known as offline stage, the signal quantity of each detected emitter at a given time and position (a fingerprint) is measured at several places the target scenario and stored to create a characterization of the signals in that scenario as comprehensive as possible. The collected database is called the training database. If the measured signals are radio frequencies (RF), the database is also called radio map. The collection process of the database is called site survey, war-driving, radio map creation or training fingerprints collection. In the second stage, also known as online stage, the position corresponding to new measured signal quantities is estimated using the positions associated with the stored fingerprints that are the most similar when compared to the new measurements (see Figure 2c). Apart from the previous methods, another two relevant ones are not based on measuring signals from an emitter and are also considered range-free methods: hop count and vision analysis. A hop occurs when a packet passes from a network segment to the next one. The number of hops from known nodes is then used for (coarse) distance estimations [18] or to infer positions through a graph embedding problem [20]. Vision analysis refers to the application of computer vision approaches to images gathered using some imaging technique like, e.g., cameras. The analyses detect relevant features in the scene that allow the estimation of the positions of entities in the scene or the position of the recording imaging device [74]. Another relevant high-level classification is device-based or device-free positioning [45]. In the former, there is a positioning device that acts as an active agent of the positioning process by measuring.
(6) Sensors 2019, 19, 4507. 6 of 45. or emitting a signal. The positioning device is normally a portable device such as a smartphone or a tag. Device-based solutions are the most commonly addressed in surveys and IPS literature in general. Device-free positioning is found mainly in the form of presence detection or radar-like systems. The importance of the device-based vs device-free division is supported by the fact that one of the driven forces for the growth of LBS is the widespread usage of smartphones. Some surveys explicitly focus on IPS solutions applicable to smartphones [41,48] and others on device-free positioning [53,55]. The distinction on whether an IPS is applicable to smartphones or not is necessary given that even modern smartphones have a limited number of sensory capabilities. Another classification is whether the solution requires the deployment of dedicated infrastructure or not, being the former called an infrastructure-based solution and the later an infrastructure-free solution [6].. (a) Lateration. (b) Angulation Figure 2. Most common methods used in IPS.. (c) Fingerprinting. The underlying technology does matter, and its particularities should be taken into account when creating an IPS. This section proceeds by providing a review of the technologies most commonly applied for IPS solutions. In each case, relevant references to the applied techniques and the applicability to range-based vs range-free or device-based vs device-free classification will be mentioned. 3.1. Light Visible Light Communication (VLC) IPS appear as device-based solutions, while infrared IPS may appear both as device-based or device-free (passive) solutions. The VLC-based IPS rely on the idea that LED lighting is increasingly popular, and LEDs can switch the intensity level in a way that is fast and imperceptible to the human eye. The intensity level switches are then used to encode information. Settings that have several LEDs emitters use a multiplexing protocol, either by frequency or time. The receiver is commonly equipped with a photodiode array that captures signal properties such as RSS, TDOA, and AOA, or with a camera that takes images of the transmitters. For the former, positioning approaches such as lateration, angulation or fingerprinting can be applied. For the later, the coordinates that the LEDs have in the image are translated into coordinates of the environment, usually using several images and additional support hardware such as accelerometers. The mean accuracies reported by VLC-based IPS are measured in centimeters [37,64,65]. However, as stated by Do and Yoo [37], the reported results should be taken with caution as the test scenarios and conditions vary significantly among these solutions. Also, challenges such as emitters time synchronization [24] and robustness to sunlight [37] remain. Infrared signals have been also used for light-based IPS, either for device-based or device-free solutions. A notable example of the former is the pioneering work of the Active Badge Location System [75], where a tag emitted a code carried by an infrared signal that was captured by a network of sensors. Examples of the latter are Passive Infrared (PIR) solutions, which could use infrared cameras for imaging or thermopile arrays that provide AoA measurements [21,45,46,55]. According to the performed searches for this work, there is no infrared-based IPS survey and the number of such system.
(7) Sensors 2019, 19, 4507. 7 of 45. proposals is low when compared to other IPS technologies, which may be motivated by the LOS requirement of infrared-based solutions. Most of the light-based proposals agree that one of their motivations is the possibility of reusing existing LED lighting infrastructure. In particular, the consulted surveys expected a growth of VLC systems that would lead them to be used for positioning in a way similar to that of WiFi [24,37,51,64]. Some years ago, the capabilities of the smartphones were a concern for light-based IPS [24], which led to even performing some computations through external services [37]. Those capabilities are higher now, enabling camera-based designs and shifting the concerns to challenges such as power consumption of the camera, daytime lighting conditions, and accuracy improvement [64]. However, camera-based designs do not achieve the accuracies of photodiode-based designs and require LOS situations. Furthermore, VLC systems are not as ubiquitous as WiFi. Thus, light-based IPS are sometimes acknowledged to be in early stages of development [65]. The surveys of Zhuang et al. [64] and Afzalan and Jazizadeh [65] are comprehensive and recent enough to grasp general but solid knowledge of light-based IPS. 3.2. Computer Vision Apart from their support in VLC-based or infrared-based positioning, vision techniques are also used in camera-based IPS without any supporting light framework apart from those common to any modern building. Even though Simultaneous Localization and Mapping (SLAM) is mainly based on cameras for sensory input presently, one should not enclose SLAM into vision-based methods. SLAM is possible using, for example, laser scanners, sonars or odometric data provided by wheel encoders [16]. For device-based solutions, one of the most straightforward solutions is based on markers like, e.g., printed QR codes. Marker-based IPS may even provide continuous estimations if the markers are processed in a stream of images (video) of the scene and perspective is used for refinement [13]. Visual odometry is commonly applied to the input from one or several cameras. The cameras can be monocular, stereo or omnidirectional. The cameras motion and subject speed are usually determined by applying methods such as feature tracking or optical flow [16,74]. Visual odometry surpasses other odometry technologies regarding cost and accuracy [74] and is supported by modern computer vision techniques and the computation power found in robots and mobile devices, such as in the applications of Google’s ARcore [76]. For device-free solutions, it is common that several cameras are installed in the target environment. The collection of images is then used to identify the targets in conjunction with environment details recorded for the target scenario [12]. Position determination using computer vision techniques is likely to be increasingly used in the near future. Apart from visual odometry and vision-based SLAM, other applications such as self-driving cars and immersive applications such as those of virtual and augmented reality in video games have boosted and will further boost the usage of computer vision to determine subject positions. Those applications have not only driven the development of software techniques but also specialized hardware such as depth cameras [16]. In addition, the drift provided by visual odometry is smaller than the drift of wheel encoders and low-precision Inertial Navigation Systems (INS) [74]. Despite being devoted to SLAM, the survey of [16] provides a necessary context to explore the application of computer vision techniques to positioning, from the perspective of 2016. Although [16] is a recommended reading, new survey works on this topic are required. Those works could include the examination of device-free solutions. 3.3. Sound The selected surveys that focus on acoustic signals make a distinction between systems operating on ultrasound—frequencies beyond 20 KHz—and those using audible frequencies [13,45,46,61]. They reference as pioneering works the “Active Bat” [77], “Cricket” [78] and “Dolphin” [79] systems.
(8) Sensors 2019, 19, 4507. 8 of 45. for ultrasound, and the “BeepBeep” system [80] for audible frequencies. The ultrasound-based IPS generally use TOA or TDOA to perform lateration, although RSS has also been used [21,46], even for fingerprinting [45]. To improve the accuracy, the ultrasound pulses are complemented with RF pulses [78] or BLE advertisements [81]. Even though the acoustic solutions have reported accuracies of a few centimeters [14], they present notable changes as sound speed is affected by temperature and humidity. Furthermore, they suffer from interference of bouncing pulses and, in the case of ultrasonic systems, they require specialized hardware that is expensive to deploy [15,61]. Most of the acoustic IPS presented in the surveys refer mainly to device-based IPS. There are examples of device-free IPS in the form of audible sound source positioning, and as ultrasonic radars [12], although they face strong challenges due to noises, echoes, and multiple sound sources [53]. Early proposals of acoustic-based IPS were published in the late 1990s and early 2000s [77–79]. However, they have not become largely adopted by IPS solutions, despite their high accuracy. They require deployments which are relatively cheap for just one room but whose affordability may become a concern for large environments. Also, the acoustic sensing capabilities of modern smartphones are not enough for the proposed acoustic-based IPS. Ureña et al. [61] provides a comprehensive and recent (2018) survey on acoustic local positioning systems, with a moderate number of references that should suffice as an introduction and update to works in this topic. 3.4. Magnetic Fields Pasku et al. [54] classifies the magnetic-based solutions into those that use the natural Earth magnetic field, those that use DC (static) artificial magnetic fields, and those that use AC (time-varying) artificial magnetic fields. Other general surveys, such as Zafari et al. [15], do not make such distinction, while others such as Brena et al. [46] do make the distinction but concentrates on those that only use the Earth magnetic field, as a result of considering that it is the approach followed by most modern solutions. Indeed, the selection made by Brena et al. [46] is supported by the facts that such systems do not incur in deployment costs, they are readily applicable to smartphones [48], and their reported accuracies are in the range of a few meters. Magnetic IPS use strength variations in the measured magnetic field to infer a position estimate. In the case of the ambient (Earth) magnetic field, such variations are usually caused by steel structures in the target indoor scenario, requiring the creation of a database with the recorded variations of the magnetic field strength [6]. The created database is later used by a fingerprinting method to compute position estimations. One of the most known works using this approach is Magicol [82], which is referred by several surveys [12,48,54]. IPS based on the Earth magnetic field require a collection effort and typically have lower accuracies than those based on artificially generated magnetic fields. However, they have a low cost, a low system complexity, and a large operating range [48]. Those based on artificial fields require coil-based systems that are power hungry and operate at short ranges, but they are able to produce accuracies in the range of several centimeters [54]. All magnetic-based IPS are device-based IPS solutions, to the best of this work’s knowledge. IPS based on artificially generated magnetic fields still require the miniaturization transmitters and receivers and the reduction of the power consumption Pasku et al. [54]. Pasku et al. [54] reported commercial systems from 2013 to 2016, mainly devoted to artificially generated magnetic fields. Pasku et al. [54], despite providing a comprehensive general introduction and update to magnetic-based IPS, devotes more content to the artificial magnetic fields IPS than to the naturally occurring ones. Naturally occurring magnetic fields are mainly used in IPS intended for smartphones, and thus the survey presented in Davidson and Piche [48] is recommended as a brief complementary reading. For a survey of the application of Earth magnetic field to smartphones-based IPS, He and Shin [50] is recommended. That survey explains how the measurements are obtained, how the database is created and how the positioning is performed, presenting for each aspect relevant and.
(9) Sensors 2019, 19, 4507. 9 of 45. recent—for its time—works. Also, the survey is comprehensive and presents measurement ranges from several devices. Given that IPS that use Earth magnetic fields are common in IPS literature, mainly combined with other technologies such as WiFi and Pedestrian Dead Reckoning (PDR), and He and Shin [50] reviews works mainly from before 2017, a new magnetic-based survey is suggested. The survey should provide an update on academic and commercials proposals based solely on magnetic fields and an update on proposals that combine Earth magnetic fields with other technologies, explaining how the combination is performed. 3.5. Dead Reckoning Dead Reckoning (DR) is applied to device-based IPS. When specifically targeted for pedestrian, it is called Pedestrian Dead Reckoning (PDR). Dead Reckoning refers to the estimation of the current position of a target based on a previously known position (a fix) of it and measurements of quantities that are used to describe its movement, e.g., heading and speed [13]. Such measurements are commonly obtained using accelerometers that sense translations, i.e., provide the acceleration magnitude at each of the three axes; gyroscopes that sense rotations, i.e., provide roll, pitch and yaw measurements; and magnetometers (compasses, which are not inertial sensors) that give orientation regarding the Earth magnetic poles, i.e., provide field strength measurement along three axes. Modern smartphones include most of those sensors and have the computing capabilities to perform PDR. PDR works have also used units that assemble inertial sensors, which are called Inertial Measurement Units (IMUs). IMUs are mounted mainly in feet and legs, although it has been reported also for waist mounts [62,70]. The shoe-mounted setting has been the most popular, given that the mechanics involving the walking process and the foot allow re-calibrations at every step applying the Zero-velocity UPdaTes (ZUPT) method [70]. Filtering algorithms such as (Extended or Unscented) Kalman Filtering and Particle Filter (PF) that combine all information are at the core of DR [13,62]. The movement or trajectory is usually estimated using two approaches. The systems that use the first approach are called Inertial Navigation Systems (INSs), and they perform the integration of the sensor data. The systems that used the second approach are called Step and Heading Systems (SHSs), and they detect and quantify steps and their headings [12,13,62,83]. If possible, other inputs such as maps and constraints are applied using filters to improve the resulting accuracy [62]. PDR has a low cost, it does not require external references, and it has a high accuracy when new positions are not estimated far apart from the last fix. However, it suffers from accumulative errors or drifts [13]. That is why PDR is usually used coupled with other technologies that support IPS and provide periodical estimations that help in correcting drifts. Dead reckoning is widely used in position estimation and navigation systems, not only for indoors. Unless a system can deliver very high positioning accuracies with high certainties for moving targets, it will certainly benefit from using DR. Similarly, PDR for smartphone-based IPS benefits from fixes provided by other supporting technologies. The smartphone’s IMU sensors have limited accuracy in comparison to other (bigger and more expensive) IMUs, which make the accumulated drift to become a problem [62]. However, miniaturized IMUs are improving, as seen in the now popular mHealth gadgets, which will make PDR less dependent on other technologies to solve drift problems [70]. Despite the survey of Diaz et al. [70] is very recent (2019), the works of Wu et al. [62] provides a recent (2018) and more comprehensive survey about PDR based solely on inertial sensors. To explore the combinations with other technologies for the case of smartphone-based IPS, Davidson and Piche [48] is suggested as reading. The work of Vezocnik and Juric [71] is recommended for an exhaustive and up-to-date survey on step length estimation models, a key part of many PDR solutions. 3.6. Ultra-Wideband (UWB) UWB is highly acknowledged as an IPS technology. The three UWB surveys [30,33,52] agreed in using the USA Federal Communications Commission (FCC) definition of UWB, which states than it.
(10) Sensors 2019, 19, 4507. 10 of 45. refers to RF signals whose bandwidth is greater than 20% of the center carrier frequency, or is greater than 500 MHz. That large bandwidth is related to a key characteristic that is acknowledged in many works: UWB works by emitting precisely timed very short pulses, of ≈ 200 ps (pulse width), with very low transmission power [84]. The low transmission power avoids interference to WiFi, BLE or similar. The very short pulse modulation renders UWB almost immune to multipath issues. Given that the inter-pulse period is large enough to unambiguously perform multipath resolution, NLOS paths are detected after the main pulse detection [52]. Also, UWB has penetration capabilities considerably larger than WiFi and BLE, being LOS situations less relevant for it [33]. Furthermore, the energy consumption is lower than other WLAN technologies such as Bluetooth or WiFi [52]. UWB device-based positioning requires the deployment of tags. UWB emitters have been reported either in fixed or mobile configurations, with tags having different sizes and shapes and being mounted or worn at different places on the positioning subject, e.g., mounted on the feet or the head [21,46]. With UWB, the positioning is performed using any of the RSS, ToA, AoA, or TDoA techniques, depending on the tags design and their resulting capabilities. Therefore, the reported methods used for positioning are fingerprinting, lateration or angulation [30,33,52]. Given the effort implied in the radio map creation for fingerprinting, it is the least used method for UWB. The reported accuracies are typically below the 50 cm [52], which makes UWB attractive for many applications, as long as they can afford the UWB tags, both in terms of cost and the application requirements. However, the short nominal range of UWB [52] and the cost of UWB equipment [33] makes the scalability a severe issue. For device-free positioning, UWB has been used by applying the principle of radar [33], which is attractive given the UWB capability of penetrating through walls. In a room with UWB emitters and receivers, a subject creates reflections of the signals that, using the TOA and TDOA techniques, can be used to estimate the subject’s position [12,13]. One of the biggest hurdles for UWB is the lack of support for it in almost all smartphones, apart from some specific attempts [85]. However, a recent announcement of the incorporation of UWB chips inside new versions of Apple’s iPhone [86] may change the IPS landscape, at least for small scale scenarios. Many customers will choose deployment cost higher than WiFi or BLE to obtain significantly higher accuracies. Regarding reading suggestions, Mazhar et al. [52] provides a short but helpful comparison of BLE, WiFi, ZigBee, and UWB and explains the advantageous multipath resolution in UWB. Ref. [52] is suggested as introductory reading to UWB-based IPS that can be deepened by reading Alarifi et al. [33]. Given that Alarifi et al. [33] and Mazhar et al. [52] were published in 2016 and 2017, a new survey on UWB-based IPS will have a notable value. However, its value would be remarkably high if include foreseen applications of the new UWB chips of Apple’s iPhone. 3.7. WiFi WiFi, or Wi-Fi, is the IEEE standard 802.11 for WLAN [27]. WiFi-based positioning is sometimes addressed by the name of WLAN positioning [13,14,46], which is the result of WiFi being the default technology for setting up a WLAN. WiFi is mentioned as an IPS supporting technology in all selected surveys. Furthermore, to the best of this work’s knowledge, it is acknowledged in all published IPS proposals. WiFi operates on the of 2.4 GHz and 5.0 GHz [27], with typical channel widths of 20 MHz, 40 MHz, and 80 MHz. The signals from bands of 2.4 GHz travel farther, while the those from bands of 5.0 GHz have wider channels and are more robust to fast fading [87]. Works that report the usage of CSI, ToF and AoA techniques are not uncommon [15]. However, the main applied technique is RSS, given that is the technique applicable to many modern smartphones [48]. Although they are very popular, IPS based on WiFi have many challenges that arise from the alterations that the RF signals suffer in indoor environments. Also, the WiFi-based proposals use the existing WiFi networks to achieve low-cost solutions, but those networks are commonly deployed for communication purposes and not for positioning [15]. Solutions for WiFi RSS positioning may apply lateration based on a.
(11) Sensors 2019, 19, 4507. 11 of 45. propagation model if the AP positions are known, which is also known as model-based approach [19]. However, the most popular approach is fingerprinting [46] because of its consistently better accuracy results in comparison to lateration. Given their direct applicability to many smartphones, WiFi-based IPS are mainly device-based solutions. There are also device-free solutions [88], which commonly perform anomaly or motion detection first and then determine the position of the entities using techniques such as RSS or CSI [45]. Fingerprinting, link-based schemes, and Radio Tomographic Imaging are among the employed methods [45,88]. Along the years, WiFi-based IPS surveys and solutions have acknowledged the known challenges and forecast improvement actions. However, is not commonly recognized that the widely acknowledged typical accuracies of WiFi-based IPS have not significantly improved in recent years. Forecast techniques such as CSI [17] have not finally had a large success. WiFi-based IPS, mainly those that use fingerprinting, have enjoyed popularity because they are cheap and easy to implement. However, its popularity may be affected by new changes to Android smartphones [89]. We recommend the reading of Khalajmehrabadi et al. [19], as it provides an easy to follow survey that addresses the most important works by the time of its publication. The survey from Khalajmehrabadi et al. [19] is as comprehensive and more recent than that of He and Chan [17]. Also, it provides a summary of the reported accuracy of several solutions along with the testbed conditions. Makki et al. [27] and Konings et al. [88] provide surveys of the very specific topics of WiFi device-free and WiFi time-based solutions, respectively. The survey from Konings et al. [88] is recent (2019) and provides experimental result obtained by the authors. The publication year of the main surveys that addressed WiFi fingerprinting is 2016 for He and Chan [17] and 2017 for Khalajmehrabadi et al. [19]. Thus, a new survey on WiFi-based IPS is suggested. The new survey should provide a general inclusive overview of WiFi-based solutions, which is missing from the consulted surveys. However, it should devote most of its content to WiFi fingerprinting, given the popularity of this topic. 3.8. Bluetooth Low Energy (BLE) To the best of this work’s knowledge, no survey focuses on BLE-based IPS currently, although surveys covering wider BLE topics do exist [90]. BLE follows Bluetooth classic in the usage of frequency hopping to communicate. The BLE emitters are commonly called BLE beacons. They are small, advertisement-emitting devices available in many configurations that are attractive for IPS given their cost, privacy, and a low footprint on the smartphone’s battery and network traffic [48,87]. BLE advertises at three channels of 2 MHz of width in the 2.4 GHz band [87]. The small channel width translates into a larger fast-fading effect than that seen for WiFi, even for the 2.4 GHz band [87]. Thus, solutions to reduce the fast-fading effects on BLE-based IPS are very relevant [91]. Nevertheless, BLE is sometimes seen as the most suitable positioning technology for indoor navigation and tracking currently [11]. Its suitability is supported by the relatively low cost of BLE emitters, their very low power consumption that let them run on batteries for months, and a generalized capability of modern smartphones to read their advertisements [46]. BLE shares many similarities with WiFi at the 2.4 GHz band [48], and thus it has been used for positioning by applying the RSS, AoA, and ToF techniques, being RSS the most often applied technique [15]. To the best of this work’s knowledge, BLE has been used only for device-based IPS. BLE has a low detection range, typically under 20 m [11]. Such a short detection range reduces its applicability to device-free solutions. The accuracies achievable using BLE is typically higher than those of WiFi, which is related to the usually higher density of deployed emitters [48]. Even though BLE beacons are generally cheap, the scalability to large scenarios may be an issue if dense deployments are required [13]. Given the lack of BLE IPS surveys, we provide here a brief review that addresses topics that we considered to be the most relevant for BLE-based positioning. Attempts to use Bluetooth for indoor positioning date back to the early 2000s, using proximity [92,93] and lateration [94]. However, scanning times were too large [95], thus rendering.
(12) Sensors 2019, 19, 4507. 12 of 45. Bluetooth not suitable fine-grained low latency positioning [96]. After the development of BLE (2012), the iBeacon specification by Apple, and the increase in the supply of cheap BLE beacons, Bluetooth (BLE) notably increased its popularity for positioning. One of the most important early works on BLE for positioning is Faragher and Harle [87]. That work showed a BLE comparison between WiFi and BLE. Also, it showed how BLE measurements are affected by an uneven channel gain (which creates different measurements for different channels). Thus, it showed one of the most important challenges of BLE positioning, a fast-fading effect that is more significant than the one seen for WiFi. Also, Faragher and Harle [87] gave guides on the usage of a moving window for averaging measurements and improve signals measurement errors, attending to criteria such as possible walking movement, fast fades, and client advertisements receive rate. Palumbo et al. [97] proposed a method that dealt with BLE fast fades by using a map that simulated a trail diffusion. Kriz et al. [98] showed the relation between higher advertisement frequency and denser beacon deployments to better the positioning accuracy. Unlike WiFi, with BLE it is possible to decide the deployment of the emitters considering only the positioning purpose. However, it creates the challenge of finding the most suitable combination of beacons and the broadcasting settings for a given environment. Oftentimes, the environment creates hard restrictions on where it is possible to deploy the beacons, and sometimes a uniform deployment is just assumed. Faragher and Harle [87] acknowledged that an exhaustive search of the parameter space was infeasible, and the authors chose a convenient deployment for the environment that set an upper bound on the positioning error after trying several parameters that included moving windows size, windows aggregation method (mean, median and maximum), beacon advertising frequency, and transmission power (beacons range). Budina et al. [99] proposed a method of iBeacon optimal distribution for indoor localization, where a predefined number of beacons are situated over the area, so their coverage is optimized. The procedure they proposed divides the target area into cells for their independent evaluation and take into account the building layout. They stated that optimization is in line with detecting enough devices with enough signal intensity. Castillo-Cara et al. [100] studied the beacon setup parameters, namely transmission power, density, and topology. They recommended splitting the target area into large sectors, keeping gaps separating areas between them to improve the classification. Also, they suggested to use low or medium transmission powers and to take into account the materials composing walls and avoiding positions near windows. Also, they recommended placing beacons at the corners and one in the center of the area, with a beacon at least every 6 m. In their experiments, they tested a grid deployment. Newer proposals include the work of Rezazadeh et al. [101], which analyzed in an environment the vertical and horizontal positions of beacons to increase the measured intensity of each beacon and thus increase the chances of seeing at least three of them at any position. With WiFi, the default approach to use is fingerprinting. However, a higher density of emitters and their shorter detection ranges allow other strategies for BLE depending on the deployment and environment. Aman et al. [102] used the center of the bounding box of the detected beacon positions as the position estimate. Bouchard et al. [103] showed that higher values of mean RSS, received advertisement count ratios, and variance were correlated with shorter distances to a beacon. Thus, the authors chose the position of the beacon that had the highest value of the weighted combination of the three metrics as the position estimate. Muñoz-Organero et al. [104] tested the centroid of detected emitters, either giving or not predefined weights to each emitter. More recently, Mendoza-Silva et al. [105] tested the centroid of the positions of the detected beacons in two environments, weighing each position according to the RSS of the beacon. The accuracy obtained using the weighted centroid was higher than using fingerprinting. [97] applied a technique referred by the authors as stigmergy, which iteratively updates a map that simulates a trail diffusion created by a sequence of position estimates. Only a few works have used lateration in BLE-based IPS. [106] used it with specialized equipment (i.e., not smartphones or off-the-shelf BLE emitters) considering only LOS conditions with senders and receivers at the same altitude. Huang et al. [107] and Huang et al. [108].
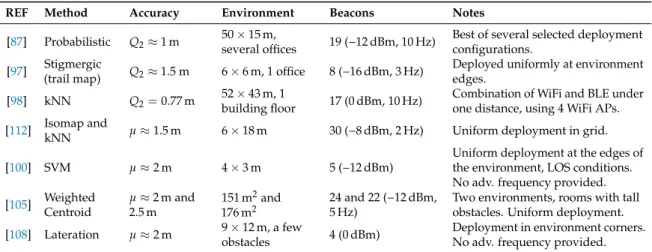
(13) Sensors 2019, 19, 4507. 13 of 45. also used lateration, but improved the estimations using either PDR and Kalman filtering or a heuristic for improving the distance estimation through channel separation. Fingerprinting has been an important approach for BLE positioning since its beginnings. As shown in Mendoza-Silva et al. [105], fingerprinting is a better option than proximity or lateration when the number of BLE beacons is small. Zhang et al. [109] used fingerprinting using two configurations of neural networks, Support Vector Machines (SVM) and k-Nearest Neighbors (kNN) with or without map enrichment with regression. SVN provided the best accuracy results. Zhao et al. [110] and Lohan et al. [111] presented comparisons between the usage of WiFi and BLE for positioning. In the case of Lohan et al. [111], the experiments considered propagation models, fingerprinting, and the weighted centroid method, with the latter providing the best accuracy results. Faragher and Harle [87] used Gaussian Process Regression for radio map enrichment. The entire area of interest was divided into grid cells of side 1 m. Map cells with moderate or high variance were ignored completely for the operational stage. The authors used a Gaussian Kernel posterior probability on each cell for the current fingerprint, and estimated the position using the maximum a-posteriori probability. Kriz et al. [98] tested the combination of WiFi and BLE under one distance in the signal space for kNN fingerprinting, giving the same weight to both measurements. Wang et al. [112] used kNN once the radio map was transformed using the Isomap-based manifold data dimensionality reduction technique. Castillo-Cara et al. [100] tested weighted kNN and SVM, and provided recommendation of their parameters when using low and high transmission powers. Zuo et al. [113] combined the fingerprinting and lateration approaches, and further improved the estimates by applying PDR. Table 2 presents a summary of some of the BLE-based IPS proposals already described. The table presents only those works that reported their achieved accuracy using either the median (Q2 in the table) or the mean (µ in the table). Also, the selected works reported the dimension of the environment, how the beacons were deployed and configured. We consider that a more comprehensive survey for BLE is required. Apart from the comparison of BLE to other technologies, such as in the case of [111], the survey should pay attention to proposals that provide, at least, the characteristics compiled in Table 2, in order to make comparisons easier for the reader. Table 2. Selected BLE IPS proposals. REF. Method. Accuracy. Environment. Beacons 19 (−12 dBm, 10 Hz). [87]. Probabilistic. Q2 ≈ 1 m. 50 × 15 m, several offices. [97]. Stigmergic (trail map). Q2 ≈ 1.5 m. 6 × 6 m, 1 office. 8 (−16 dBm, 3 Hz). [98]. kNN. Q2 = 0.77 m. 52 × 43 m, 1 building floor. 17 (0 dBm, 10 Hz). [112]. Isomap and kNN. µ ≈ 1.5 m. 6 × 18 m. 30 (−8 dBm, 2 Hz). [100]. SVM. µ ≈ 2m. 4×3m. 5 (−12 dBm). [105]. Weighted Centroid. µ ≈ 2 m and 2.5 m. 24 and 22 (−12 dBm, 5 Hz). [108]. Lateration. µ ≈ 2m. 151 m2 and 176 m2 9 × 12 m, a few obstacles. 4 (0 dBm). Notes Best of several selected deployment configurations. Deployed uniformly at environment edges. Combination of WiFi and BLE under one distance, using 4 WiFi APs. Uniform deployment in grid. Uniform deployment at the edges of the environment, LOS conditions. No adv. frequency provided. Two environments, rooms with tall obstacles. Uniform deployment. Deployment in environment corners. No adv. frequency provided.. The accuracy reported by the selected works is 1 m to 3 m, which is below the accuracies stated in surveys such as Basiri et al. [11]. It is reasonable for a survey to choose conservative numbers when stating accuracy ranges, as the values reported by the IPS proposals are commonly for specific experimental settings. Five out of seven IPS proposal referenced in Table 2 correspond to small environments. For the same number of deployed beacons, the accuracy obtained in a small environment is likely to be smaller than the one obtained in a medium or large environment. Also, the selected proposals tend to have used uniform beacon deployment, i.e., beacons were placed at regular distances covering the environment or at its boundary edges..
(14) Sensors 2019, 19, 4507. 14 of 45. 3.9. Radio Frequency Identification (RFID) and Near Field Communication (NFC) The main components of RFID are electronic tags that store some data—usually an ID—and readers capable of obtaining through RF the data from those tags. The tags can be passive, active or semi-passive. Passive tags use energy from the reader’s signal to transmit their data. Active tags have batteries and broadcast their data periodically. Semi-passive tags broadcast their data only upon the detection of a reader’s signal [46]. As readers are usually larger and more expensive than tags, one common setting in RFID-based IPS is to deploy a large number of tags across the environment and have the readers carried on, or being attached to the positioning subjects [13,43]. The setting where readers are fixed, and tags are carried the positioning subjects is more convenient for supporting large numbers of positioning subjects [46]. The detection range of the tags depends on whether they are active or passive. For passive tags, the detection range also depends on the reader’s signal power. The reported accuracy in RFID varies significantly, and it depends on how dense the deployment of tags or readers had been, with some works reporting accuracies of a few centimeters [46]. Most of the RFID-based IPS are based on simple proximity or RSS-based lateration [43,46]. NFC-based IPS have been considered to be a variant of RFID-based IPS [46]. NFC allows two devices, usually smartphones, to communicate while in touch or close proximity. A few recent IPS proposals [13] have harnessed the NFC capability of many modern smartphones in combination with the deployment of NFC tags across an environment. However, such systems have the inconvenience of requiring the active participation of the positioning subject, who is required to approach the smartphone to the tag. Thus, such systems are unable to provide continuous position estimates [13,46]. The review presented in Shen et al. [43] is very brief (less than 20 references), even considering its date of publication and the fact that the number of RFID or NFC proposals is small when compared to, e.g., WiFi. In recent years, novel RFID-based IPS proposals, such as Sakpere et al. [114], Xu et al. [115], Seco and Jiménez [116], Xu et al. [117], Yao and Hsia [118] to cite a few, have been published. Thus, a new comprehensive survey is suggested. That survey should not only review recent academic work about RFID-based IPS, but also look for its usage in commercial IPS solutions. RFID-based IPS proposal should still be appear in the following years, given the small cost of RFID tags and its suitability for assets tracking. 3.10. Other Technologies and Particular Cases Cellular networks, in the form of GSM, LTE, 5G or other, are frequently mentioned but rarely addressed in detail in the selected surveys. Cellular networks have been used for positioning [12,20,45,59] applying proximity, RSS fingerprinting, and observed TDOA lateration, but not necessarily for indoor scenarios. Indeed, with reported accuracies that are commonly above 50 m, there are no IPS that are based solely on cellular networks signals to the best of this work’s knowledge. Thus, this technology is used as a signal of opportunity in conjunction with others such as WiFi, BLE and, FM. Basiri et al. [11] refers to other technologies such as high sensitivity GNSS receivers, pseudolites, and tactile sensors. It explains that the first two are expensive and the third one is harder to manage in crowded scenarios. The tactile sensors placed on the floor may have real applications. Their sensing capability is provided by a relative simply technologies such as piezoelectric sensors, buttons or capacitive touch surfaces that can provide high accuracy in an unobtrusive way to the user. Xiao et al. [45] comments on the usage of FM radio signals for positioning, being mainly applied using fingerprinting. Even though Xiao et al. acknowledges advantages of FM-based positioning such as low power consumption in smartphones and robustness to obstacles, it cast doubts on FM usage for IPS devoted to smartphones because of the lack of RSS readings availability. Wireless Sensor Networks (WSNs) do not constitute a technology upon which IPS are supported. However, they are commonly mentioned in the selected surveys as they may be applied to indoor scenarios and network node position determination is a relevant problem for them. A WSN is a collection of nodes able to communicate among them—or at least to the nearest neighbors—and.
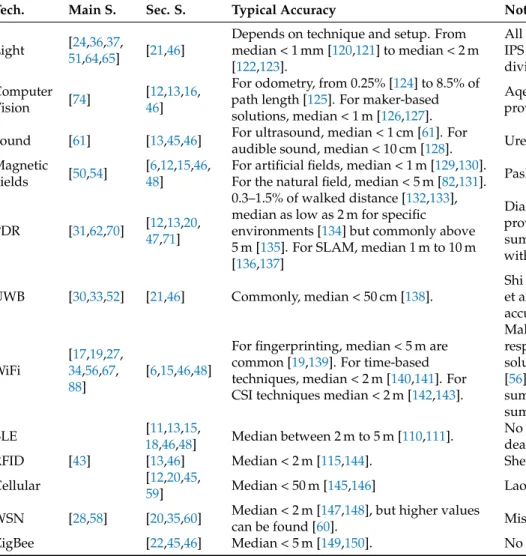
(15) Sensors 2019, 19, 4507. 15 of 45. perform some sensing task [58]. If the positions of some nodes are unknown, the communication technology or some extra ranging capability is usually used for determining the nodes’ positions [60]. If a ranging capability is used, then the TOA, TDOA, AOA and RSS techniques are used with the angulation and lateration methods, among others. Ranging may be energy prohibitive for some WNS, which thus mostly rely on interpreting the connectivity information between the nodes, i.e., using hop count [20]. Much like WSN, a highly heterogeneous network of devices organized under the concept of the Internet of Things (IoT) uses the connectivity or ranging capabilities of their nodes for position determination [15]. However, in IoT, the node’s connectivity is generally less restrictive than in WSN. Thus, IoT is expected to boost the device-free positioning to enable applications such as smart environments [22,59,68]. ZigBee is a standard for WPAN focused on providing short-range, low power and low data rates communication. ZigBee is prone to interference from signals operating at the same frequency. It has been used for device-based IPS using the RSS, TDoA, ToA and AoA techniques [22,45,46]. It has also been used for device-free positioning by analyzing the signal fading induced by human movement [45]. Among the technologies with less academic publications on IPS proposals, 5G is the one that draws the largest expectation. For some, it may be the definitive answer to most IPS applications. However, it is still at an early stage of deployment. Despite it already exits surveys on 5G-based positioning [119], IPS based on non-experimental 5G networks are not a reality yet. Thus, a survey in the topic will have higher value if it is created after the deployments of 5G networks and their support in modern smartphones notably increase. 3.11. Accuracy Summary of Technologies Table 3 presents the typical accuracies reported for the technologies most commonly used for IPS. The accuracy values were inferred from values reported in the selected surveys, either from those whose main topic was the specific technology (“Main S.”) or those that only briefly addressed the technology (“Sec. S.”). The table also includes notes on the surveys, stating whether they provided accuracy summaries for comparisons or any particularity of their summaries. Thought accuracy is a key factor in the election of an IPS, it is not the only factor. Usually, an important factor is whether the IPS will apply to smartphones or not. The ones providing the highest accuracies are commonly not applicable to smartphones. The technologies that can provide the best accuracies are Light, Sound, UWB, Artificial Magnetic Fields, and Computer Vision. The remarkably high accuracy of light technologies is mainly achievable under specific techniques (TDOA), equipment (photodiode array) and conditions (LOS). The accuracy of (Ultra)Sound, UWB and Artificial Magnetic Fields technologies is also high. However, they require techniques (TOA, TDOA, and AoA) that are not supported by off-the-shelf smartphones. Almost every modern smartphone has an integrated camera, thus enabling the application of computer vision. However, using the camera for position determination requires the user to focus its attention on the position task and orient the smartphone accordingly. Natural Magnetic Fields, WiFi, BLE, and PDR are technologies commonly applied to IPS that support smartphone applications. The accuracy of PDR drops as the distance from the last fix (known position) increases, thus it is most commonly used in combination Magnetic Fields, WiFi, or BLE. The Magnetic Fields-based and WiFi-based IPS for smartphone applications commonly require the collection of a fingerprint database, which is a very time-consuming process. However, they are popular choices because they do not require the deployment of any hardware. The BLE technology provides better accuracies than WiFi and natural magnetic fields, at the expense of a relatively cheap deployment of BLE beacons. Other technologies such as RFID, Cellular, WSN or ZigBee are less considered than BLE or WiFi, although they can achieve comparable accuracies. The position determination based on cellular network has low accuracy. WSNs are per se a specific type of application that is not commonly linked to smartphones. The RFID and ZigBee technologies require particular hardware deployments that vary regarding range, receptor requirements, and cost. Thus, they have not had the success of other technologies such as BLE or WiFi..
(16) Sensors 2019, 19, 4507. 16 of 45. Table 3. Typical accuracies of selected technologies and their related selected surveys. Tech.. Main S.. Sec. S.. Light. [24,36,37, 51,64,65]. [21,46]. Computer Vision. [74]. [12,13,16, 46]. Sound. [61]. [13,45,46]. Magnetic Fields. [50,54]. [6,12,15,46, 48]. PDR. [31,62,70]. [12,13,20, 47,71]. UWB. [30,33,52]. [21,46]. Commonly, median < 50 cm [138].. WiFi. [17,19,27, 34,56,67, 88]. [6,15,46,48]. For fingerprinting, median < 5 m are common [19,139]. For time-based techniques, median < 2 m [140,141]. For CSI techniques median < 2 m [142,143].. [43]. [11,13,15, 18,46,48] [13,46] [12,20,45, 59]. BLE RFID Cellular WSN ZigBee. [28,58]. [20,35,60] [22,45,46]. Typical Accuracy. Notes on Surveys. Depends on technique and setup. From median < 1 mm [120,121] to median < 2 m [122,123]. For odometry, from 0.25% [124] to 8.5% of path length [125]. For maker-based solutions, median < 1 m [126,127]. For ultrasound, median < 1 cm [61]. For audible sound, median < 10 cm [128]. For artificial fields, median < 1 m [129,130]. For the natural field, median < 5 m [82,131]. 0.3–1.5% of walked distance [132,133], median as low as 2 m for specific environments [134] but commonly above 5 m [135]. For SLAM, median 1 m to 10 m [136,137]. All Light surveys provide accuracy summaries. Luo et al. [51] addresses visible light IPS and gives positioning accuracy for each type of its taxonomy. Zhuang et al. [64] divides the accuracy into 2 tables, for camera-based and photodiode. Aqel et al. [74] addresses odometry and mentions limitations of each method, but provides accuracy for only a few methods. Ureña et al. [61] does not provided accuracy summary. Pasku et al. [54] and He and Shin [50] provide accuracy summaries. Diaz et al. [70] does not provide accuracy indications on the methods. Wu et al. [62] provides accuracy summary only for motion classification. Yang et al. [31] provides summaries for step count and heading errors, and for position accuracy of IPS mixed with Magnetic or WiFi. Laoudias et al. [20] provides accuracies for SLAM.. Median < 2 m [115,144].. Shi and Ming [30] and Alarifi et al. [33] provide no accuracy summary, though Alarifi et al. [33] gives summary table of 39 proposals. Mazhar et al. [52] provides brief accuracy summary of a few, most relevant solutions. Makki et al. [27] and Kandel and Yu [67] address time-based and CSI techniques, respectively, providing an accuracy summary. Konings et al. [88] addresses device-free solutions, without providing an accuracy summary. Basri and Khadimi [34], Xia et al. [56] and He and Chan [17] address fingerprinting, without providing accuracy summary of IPS based solely on WiFi. Khalajmehrabadi et al. [19] provides an accuracy summary of selected fingerprinting methods. No survey provides accuracy measures for several BLE IPS. Davidson and Piche [48] deals with BLE in more details than the others. Shen et al. [43] provides accuracy for only two methods.. Median < 50 m [145,146]. Laoudias et al. [20] presents accuracy summary for some cellular-based IPS.. Median between 2 m to 5 m [110,111].. Median < 2 m [147,148], but higher values can be found [60]. Median < 5 m [149,150].. Mistry and Mistry [28] and Chowdhury et al. [35] provide no accuracy summary. No survey provides accuracy summary for several ZigBee methods..
(17) Sensors 2019, 19, 4507. 17 of 45. 4. WiFi and BLE RSS Fingerprinting for Smartphone-Based IPS The IPS solutions applied to smartphones normally use technologies that depend on the propagation of RF signals in indoor environments. The indoor environment, however, is not benevolent for RF signals. Multipath originates because of reflections of the signals on obstacles. The multipath appreciated outdoors at a large scale is more significant indoor, given that obstacles are abundant and close to each other. In multipath, a signal pulse reaches a receiver as several components that may have an additive or subtractive effect on the signal power [8]. The effect of multipath depends, at least in part, on the bandwidth of the signal pulse. As reviewed in Section 3, UWB is less affected than WiFi, which in turn in less affected than BLE. Additionally, all measurements are affected by the random noise that results from, e.g., thermal and circuit noise. Also, the collisions that result from using a shared medium are common [27]. Furthermore, the human body significantly attenuates the signals from the 2.4 GHz band [151], which leads to obtaining measurements that notably differ depending on the receiver device orientation when it is held by a person. The above challenges, in conjunction with the common difficulty of knowing the actual position of RF emitters, hinders the obtainment of proper accuracies for lateration methods. Thus, RF RSS fingerprinting has become widely popular among the solutions for smartphone-based IPS, mainly for those using the WiFi or BLE. Fingerprinting is applied using either deterministic, probabilistic or machine learning approaches [19,48]. The deterministic approach commonly refers to the k-Nearest Neighbors (kNN) method or a variant of it. In kNN, the new fingerprint used for position estimation is compared for similarity against fingerprint values previously stored in a database. The positions associated with the k most similar fingerprints are used to infer a position for new fingerprint. Apart from the k value and the way that the k positions are combined, the distance metric used for determining similarity among fingerprints is an important aspect to consider in kNN [152]. In probabilistic approaches, the stored fingerprint values are used to compute the probability distribution of the signal of each emitter at each point. Those distributions are used later to select the most likely positions for the new fingerprint using Bayesian theory based on signal strength. Given that the Gaussianity of RSS behavior is commonly acknowledged, the computation of the probability distribution normally determines the µ and σ parameters of a Gaussian distribution. However, some studies state that Gaussianity assumption does not necessarily hold [19]. Probabilistic approaches include Bayesian networks, expectation-maximization, Kullback–Leibler divergence, Gaussian processes, and conditional random fields [17]. The machine learning approaches harness the development of methods and tools created in recent years for the field of Artificial Intelligence. The radio map is used to train Support Vector Machines (SVM), Artificial Neural Network (ANN), among others [56], normally in a supervised fashion. Then, the trained models are commonly used for regression on 2D positions, and classification for floor or building estimates. It is acknowledged that IPS based solely on WiFi fingerprinting can offer 2 m to 3 m of mean accuracy, although most common figures show 6 m to 7 m. BLE can provide better accuracies than WiFi, in the order of 1 m to 2 m, but larger values are also possible [105]. The variations in the previous numbers not only relate to specifics of the approach applied, but also to the characteristics of the environment and the collected training fingerprints. Indoor environments are not equally detrimental for RF fingerprinting, varying significantly in the number and materials of the obstacles, the influence of electronic equipment and the dynamics of the people moving around. Also, the number and disposition of the emitters are highly relevant [56,153]. An increase in the number of emitters (WiFi AP or BLE beacons) found in a scenario can improve IPS accuracy [105]. Furthermore, relying only on distant emitters leads to little differentiability among fingerprints of distinct reference points, thus deteriorating the accuracy. The number and distribution of reference points can also influence the obtained accuracy. On one hand, large mean errors are expected for sparse collection over large environments [154], assuming.
(18) Sensors 2019, 19, 4507. 18 of 45. that no densification strategy is used. On the other hand, the mean error tends to be small in small environments that are densely surveyed [155]. Additionally, the devices that measure the signals—the chipsets in smartphones—have different levels of sensibility [17] and identify the signal strength in distinct ways [56]. Thus, the strength reported for the same signal may have distinct values for distinct devices. Furthermore, one device may measure and report the RSS of a signal while another device may not report any value for the same signal because the signal strength is beyond its sensibility threshold. The RSS values measured at a given point are also affected by the device orientation [56], which is a result of the type and disposition of the antennas in the device and the partial absorption of the WiFi and BLE signals by the human body. The previous difficulties have long been known for studies on WiFi, and later BLE, fingerprinting IPS solutions. To cope with them, the most straightforward strategy is to collect for the target environment a large database of fingerprints that covers as much as possible the given scenario, that has as many as possible reference points and that collects several fingerprints at several directions using distinct devices. However, such collection is very time-consuming. Apart from being cumbersome, it is not affordable sometimes. Therefore, one of the main challenges for (particularly WiFi) fingerprinting positioning has been the effort reduction for collecting the training fingerprints. The proposed solutions for alleviating the collection efforts mainly include: • • •. Do the collection using crowdsourcing. Apply a propagation model to estimate the expected RSS values. Perform a small site survey and apply regression techniques to enrich the radio map.. The crowdsourcing approach harness the potential of the explicit or implicit participatory actions of users [19]. In the explicit modality, the users manually tag the positions of the recorded measurements. The users’ participation can occur during the offline stage or the online stage. During the offline stage, the participants supply the position tags required to have an operational positioning service [19]. During the online stage, the participants only supply position tags when the system is unable to provide an estimate [25]. In the implicit modality, the user is not requested to provide position labels. Instead, the labeling is performed by the positioning system whenever is possible using occasional fixes provided by, e.g., the GNNS receiver. Also, the IPS can infer fixes using heuristics or learning methods based on the existing radio map and inertial measurements [19,25]. The approach of creating the radio map by applying a propagation model is attractive and has been proposed [56]. However, this approach requires either previous information on the positions and broadcasting parameters of the emitters, or to estimate that information using a few samples. The radio map densification using regression has been effectively used in several studies using regressors such as linear regression, nonlinear Gaussian Process, Gaussian Kernel Learning, and augmented path-loss model, Support Vector Regression, and Random Forest [19,156,157]. Apart from the radio map creation, another acknowledged challenge in WiFi or BLE fingerprinting-based IPS is the energy consumption reduction [6]. WiFi scans are very energy demanding. BLE scans demand less energy than WiFi scans. Furthermore, the deterministic approaches must deal with large databases for large scenarios, which implies performing many comparisons of vectors of potentially large dimensionality. Pérez-Navarro et al. [6] and He and Chan [17] mention several approaches to deal with the former issue. Also, Khalajmehrabadi et al. [19] mentions approaches to deal with large fingerprint databases. Those approaches are mainly based on techniques such as clustering by Binary AP Coverage, K-means clustering, Affinity propagation, and spectral clustering. Other acknowledged challenges are to detect and adapt to changes in the infrastructure that affect the positioning [17], which is also related to radio map construction; the detection of outliers [19]; the device diversity issue, i.e., the adaptation to heterogeneous devices [19]; the proper evaluation of IPS proposals [6,48]; and the accuracy improvement. Solutions based solely on WiFi or BLE have known accuracy limitations [6]. Accuracy improvement is the challenge most often addressed. It is not commonly addressed for approaches based solely on WiFi or BLE, but for solutions that combine.
Figure
+7


Documento similar