TítuloFlow cytometric assay to assess short term effects of personal care products on the marine microalga Tetraselmis suecica
15
0
0
Texto completo
(2) Keywords Microalga; Emerging pollutants; Personal care products; Flow cytometry; Cytotoxicity. 1. Introduction Chemical pollution supposes a threat to marine environment and to human health and it also may be an obstacle to the exploitation of its resources (Sánchez-Avila et al., 2012). Among marine environments, coastal waters are particularly vulnerable to pollution since coastlines are usually highly urbanized regions with important industrial activities and they are considered the ultimate sink for sewage and other by-products of human activities. In addition, compared to the open sea, levels of pollution of coastal waters are substantially higher, since the effect of dilution and regeneration is much lower, especially when the water is stagnant or confined as in the case of ports and bays (Gimeno et al., 2004). The development of new highly sensitive analytical techniques has revealed the presence of a large amount of chemical compounds in the aquatic environment that have been generically termed emerging pollutants. These compounds are pollutants that are currently not included in routine monitoring programmes and whose fate, behaviour and ecotoxicological effects are not well understood (Naidu et al., 2016). According to the NORMAN Network (URL, NORMAN Network), emerging environmental substances are not necessarily new chemicals; they are probably substances that have often long been present in the environment but whose presence and significance are only now being elucidated. Emerging contaminants are discharged daily to seawater via river inputs, which can transport pollutants from inland activities, but insufficiently treated municipal wastewater discharge is identified as the major route responsible for surface seawater contamination by emerging pollutants (Dai et al., 2014). As a result, these compounds can be found in detectable concentrations in waters worldwide (Wilson et al., 2003). However, the awareness of the potential environmental impacts of these compounds has become evident in recent years (Sauvé and Desrosiers, 2014). Personal care products (PCPs) are a diverse group of emerging compounds used in all kind of cosmetic formulas such as soaps, lotions, toothpastes, fragrances or sunscreens. PCPs are products intended for external use on the human body and thus are not subjected to metabolic alterations; therefore, large quantities of PCPs enter the environment unaltered through regular usage (Brausch and Rand, 2011). Their occurrence in aquatic environments and in wastewater treatment plants is highly relevant and has been previously reported (Ortiz de García et al., 2013; Tovar-Sánchez et al., 2013 ; Rodil et al., 2012). PCPs are among the most commonly detected compounds in surface water throughout the world (Peck, 2006); however, in comparison to other groups of pollutants such as pesticides or pharmaceuticals, relatively little is known about their ecotoxicity (Daughton and Ternes, 1999). Microalgae have been frequently used in ecotoxicological screening of contaminated water, and also as test microorganisms for in vitro toxicity bioassays due to their characteristics and position in the aquatic food web. Previous studies about the toxic effects of different pollutants on microalgal physiology ( Esperanza et al., 2015a; Prado et al., 2015; Prado et al., 2012; Rioboo et al., 2009 ; Cid et al., 1996) demonstrate that flow cytometric analyses can be an alternative to standard algal population-based endpoints, since it allows a rapid, quantitative and simultaneous measurement of multiple responses to toxic stress in individual algal cells near in vivo conditions. Furthermore, the marine microalgal species used in the present work, Tetraselmis suecica, has been previously used to study the toxic effect of different antibiotics showing a high sensitivity ( Seoane et al., 2014)..
(3) The aim of the present study was to evaluate the potential acute toxicity of three emerging compounds, included in the main classes of PCPs, on the marine microalga T. suecica. The emerging compounds investigated were the UV filter benzophenone-3 (BP-3), the disinfectant triclosan (TCS) and the fragrance tonalide (AHTN). Their potential toxicity has been analysed in previous studies ( Paredes et al., 2014; Dann and Hontela, 2011; DeLorenzo and Fleming, 2008 ; Orvos et al., 2002) but data about their potential cytotoxic effects on non-target marine microalgae have largely been overlooked and additional data related to in vivo toxicity are needed to develop aquatic risk assessments ( Brausch and Rand, 2011). Regarding this objective, a small cytometric panel for cytotoxicity screening was carried out to evaluate key potential biomarkers including relative cell volume, chlorophyll a fluorescence, metabolic activity and cytoplasmic membrane integrity and potential, together with traditional growth endpoint. These parameters were monitored after only 24 h of exposure to detect early alterations in the microalgal cell physiology.. 2. Materials and methods 2.1. Microalgal cultures T. suecica (Kylin) Butch (Prasynophyceae) was cultured in filtered (pore size: 0.20 μm) and autoclaved seawater enriched with Algal-1 medium ( Herrero et al., 1991) under controlled conditions: 18 ± 1 °C, illuminated with a photon flux of approximately 70 μmol photon m−2 s−1 under a dark:light cycle of 12:12 h. For the toxicity bioassays, batch cultures were carried out in Kimax glass tubes containing 40 mL of culture. Microalgal cells in early exponential growth phase were used as inoculum for the different assays and initial cell density was adjusted to 5 × 10⁴ cells mL−1. All cultures were carried out in triplicate and cultures without tested chemicals were included as controls. The different analyses were done after 24 h of exposure since after this time an entire cell cycle and a light:dark cycle were completed. Moreover, it has been found that, in such a short time period, microalgae experienced metabolic adjustments in response to contaminants (Esperanza et al., 2015b). 2.2. Chemicals PCPs tested were analytical standard or technical grade compounds with purity higher than 97%. Concentrations tested for each chemical compound were fixed taking into account the 96 h EC50 values for growth obtained in previous toxicity tests and were expressed as cellular quota (mass of chemical substance per cell). These EC50 values were 1, 0.4 and 0.1 mg L−1 for BP-3, TCS and AHTN, respectively. BP-3 or oxybenzone (2-Hydroxy-4-methoxybenzophenone; Fluka Chemicals) is an organic compound that works as a chemical UV filter capable to absorb ultraviolet radiation. Due to the growing concern about the harmful effects of exposure to ultraviolet radiation, the use of this compound has increased in all kind of cosmetic products to protect human skin from direct exposure to the deleterious wavelengths of sunlight (Giokas et al., 2007), but also as photostabilizer and sunblocking agent for the protection of materials against UV light. BP-3 concentrations tested ranged from 0.25 to 2 mg L−1, which corresponds to 5–40 pg cell−1. TCS (5-Chloro-2-(2,4-dichlorophenoxy)phenol; Sigma-Aldrich) is a broad-spectrum antimicrobial agent widely used as a preservative and disinfectant for over 40 years in PCPs of daily use. TCS is used as an ingredient in hand-disinfecting soaps, deodorants, toothpastes, skin creams, cosmetics or household cleaners, but it is also used in the manufacture of diverse products such as plastics, textiles, food or drugs (Daughton and Ternes, 1999). This compound is one of the most consumed disinfectants.
(4) and its annual production is approximately 1.500 tons (Singer et al., 2002). TCS concentrations tested ranged from 0.1 to 0.8 mg L−1, which corresponds to 2–16 pg cell−1. AHTN (6-Acetyl-1,1,2,4,4,7-hexamethyltetralin; Sigma-Aldrich) is a polycyclic synthetic musk used in PCPs (perfumes, cosmetics, soaps, shampoos), household cleaners, fabric softeners and in disinfection and industrial products which not only contributes to give them characteristic and pleasant scent but it also serves to maintain the integrity of the products (Garcia-Jares et al., 2002). This fragrance has been one of the most important in volume of production (Sumner et al., 2010). AHTN concentrations tested ranged from 0.06 to 0.12 mg L−1, which corresponds to 1.2–2.4 pg cell−1. Before each experiment, stock solutions were prepared dissolving each compound in methanol. Then, these solutions were diluted in order to add the same amount of methanol to all samples (directly comparable to the methanol control) and to reach the final tested concentrations indicated above. To achieve these nominal concentrations, stock solutions volume added to the microalgal cultures never exceed 0.05% of final culture volume. A small concentration of methanol was used because this solvent could increase the permeability of the PCPs to the microalga. A statistical comparison between 0.05% methanol controls and controls without this solvent revealed no significant difference in algal growth (t – test; p - value > 0.05), and all subsequent tests were performed using only the solvent control. The contaminants were added to the cultures during the first hour of light to ensure that an entire light:dark cycle was completed before the analyses. 2.3. Flow cytometric analyses Flow cytometric (FCM) analyses of T. suecica cells were performed on a Beckman-Coulter Gallios flow cytometer equipped with an argon-ion excitation laser (488 nm), detectors of forward (FS) and side (SS) light scatter and four fluorescence detectors corresponding to different wavelength intervals: 505–550 nm (FL1), 550–600 nm (FL2), 600–645 nm (FL3) and >645 nm (FL4). Some parameters analysed by FCM were inherent properties of the cells, directly measured in the cytometer, while other physiological parameters were determined using different functional fluorochromes. Prior to the investigation, extensive experiments were conducted to optimize the probes concentrations and the incubation conditions in order to obtain significant, time-stable and nontoxic staining of cells. Forward scatter (related to cell volume) and FL4 channel (red chlorophyll fluorescence) dot-plots were used to characterize the microalgal population and cells were gated based on these two parameters in order to exclude non-microalgal particles for the analyses. For each cytometric parameter investigated, at least 104 gated cells per sample were collected and fluorescence measurements were obtained in a logarithmic scale. Data were collected using listmode files and analysed using the Kaluza software version 1.1 (Beckman Coulter Inc.). 2.3.1. Growth measurement After 24 h of culture, cellular density was determined by counting culture aliquots of the different treatments in the flow cytometer using a suspension of fluorescent polystyrene microspheres with a known concentration (Flow-Count Fluorospheres; Beckman Coulter Inc.) for its calibration. Growth rates (μ) (expressed as day−1) were calculated using the following equation: μ = [ln(Nt) – (ln(N0)]/ln 2 (t – t0) where Nt is the cell density at time t and N0 is the cell density at time 0..
(5) 2.3.2. Relative cell volume Cultures were analysed by FCM to study potential alterations on cell volume after 24 h of exposure to each pollutant. Forward light scatter (FS) is related to cell size or volume and FS intensity increases with the increase of cell cross-sectional area (Shapiro, 1995). Data were compiled as the mean value of the cell population since they had a normal (Gaussian) distribution. When differences in cellular volume mean value between treated and control cells were observed, the other parameters analysed were corrected by the FS signal. 2.3.3. Chlorophyll a fluorescence T. suecica presents natural autofluorescence due to the presence of chlorophyll a and other accessory pigments. Red chlorophyll a fluorescence was detected in the FL4 channel and data were collected as the mean fluorescence value of the cell population since they were normally distributed. 2.3.4. Metabolic activity Metabolic activity was studied using the fluorescein diacetate (FDA) cytometric assay, a rapid and sensitive technique to assess microalgal esterase activity (Jochem, 1999). Many authors have used FDA staining as a method to assess viability in microalgal cells exposed to cytotoxic conditions (Prado et al., 2011 ; Lage et al., 2001), but in this study FDA was used to assess the vitality of viable cells, based on their esterase activity. Several studies that used flow cytometry with algae provide additional support to FDA as a measure of the “metabolic vigour” (Berglund and Eversman, 1988 ; Dorsey et al., 1989). After entering the cell, FDA-acetate residues are cleaved off by nonspecific esterases and the polar hydrophilic fluorescent product fluorescein is retained by cells with intact plasma membranes. Since fluorescein is accumulated by active cells, metabolic activity can be measured by means of the fluorescent signal intensity emitted by cells, which is proportional to the amount of accumulated fluorescein and the time elapsed (Prado et al., 2009). Comparing any differences in the fluorescence emitted by metabolically active cells (FDA+), it is possible to detect changes in cellular metabolic activity or cell vitality. T. suecica cells were incubated with 0.2 μg mL−1 (0.48 μM) of FDA for 15 min as previously described in Seoane et al. (2014). Green fluorescein fluorescence was detected in the FL1 channel. Since data were normally distributed, mean fluorescence values of metabolically active cells population (FDA+) were collected. 2.3.5. Cytoplasmic membrane integrity Membrane integrity was assessed by propidium iodide (PI) permeability bioassay. PI was used to discriminate between viable non-fluorescent cells (PI) and non-viable fluorescent cells with damaged or disrupted cell membranes (PI+) (Cid et al., 1996). T. suecica cells were incubated with 2.5 μg mL−1 (4 μM) of PI for 10 min as previously described in Seoane et al. (2014). PI orange fluorescent emission was collected in the FL3 detector. Data were collected as the percentage of viable cells vs. the total amount of cells analysed. 2.3.6. Cytoplasmic membrane potential Alterations on membrane potential were studied using a slow-response potentiometric probe, the bis(1,3-dibutylbarbituric acid) trimethine oxonol (DiBAC4(3)). DiBAC4(3) can enter depolarized cells where it binds to intracellular proteins or membranes (Wolff et al., 2003). Increased depolarization of cell membranes results in additional influx of the anionic dye and an increase in fluorescence. Conversely, hyperpolarization is indicated by a decrease in fluorescence (Rabinovitch and June 1990). T. suecica cells were incubated with 0.5 μg mL−1 (0.97 μM) of DiBAC4(3) for 10 min.
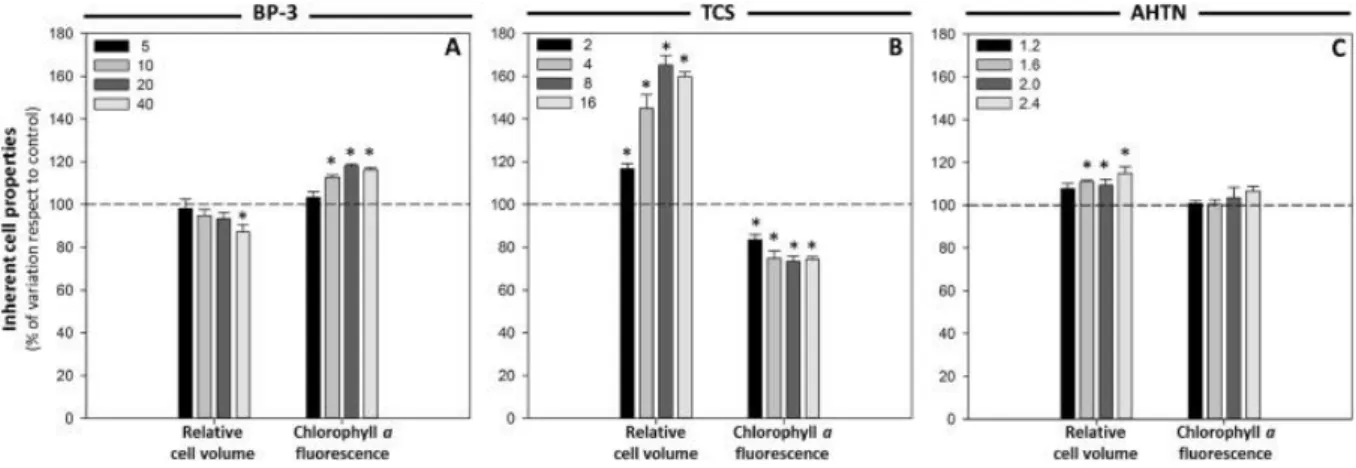
(6) following the protocol previously described by Prado et al. (2012) adapted to T. suecica. DiBAC4(3) green fluorescent emission was collected in the FL1 channel. Data were collected as the mean fluorescence value of the cell population since data showed a normal distribution. 2.4. Statistical analysis of results Mean and standard deviation (SD) values of the three biological replicates were determined for each treatment and for control cultures. Then, results were expressed as percentage of variation with respect to control, for which a value of 100% was assigned. These data were statistically analysed by an overall one-way analysis of variance (ANOVA) using IBM SPSS Statistics software 21.0. A p value < 0.05 was considered statistically significant. When significant differences were observed, control vs. treated means were compared using the Dunnett post hoc test (p < 0.05).. 3. Results 3.1. Inherent cell properties After only 24 h of exposure, the presence of the PCPs tested in the culture medium caused alterations on the inherent cell properties analysed. Cells cultured in the presence of BP-3 showed a slight decrease in the FS signal, related to a decrease in cell volume, being only statistically significant (p < 0.05) in cultures exposed to the highest concentration assayed (40 pg cell−1) (Fig. 1A). On the contrary, an increase in the FS signal, related to an increase in cell size, was observed in cells exposed to the other two compounds tested. All AHTN concentrations assayed caused a significant (p < 0.05) swelling of the cells, except the lowest one (1.2 pg cell−1) (Fig. 1C). The most noticeable increment in volume occurs in cultures exposed to TCS. All TCS concentrations tested significantly increased (p < 0.05) the cell size and cells experienced an enlargement up to 60% with respect to control ( Fig. 1B). Since differences in cellular volume among cells exposed to the different treatments were observed, the other cell parameters analysed by FCM in the present study were expressed corrected by the FS signal thereby avoiding fluorescence variability due to differences in relative cell volume or in the intracellular concentration of the fluorochrome.. Fig. 1. Variations in inherent cell properties of T. suecica cells exposed to different concentrations, expressed as cellular quota (pg cell−1), of BP-3 (A), TCS (B) and AHTN (C) for 24 h. Results are shown as percentage of variation of cell volume and chlorophyll a fluorescence with respect to control (for which a value of 100 is assigned, indicated by the dashed line). Significant differences with respect to control at a significance level of 0.05 (p < 0.05) are represented by an asterisk (*)..
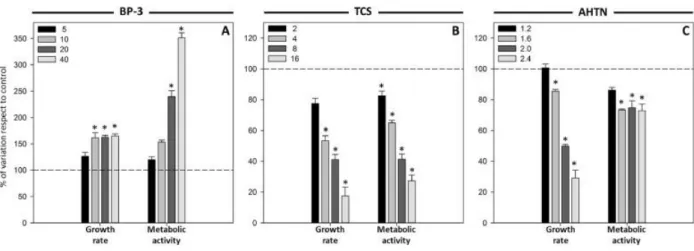
(7) FCM analyses based on red fluorescence wavelength (FL4) showed that exposure to the three compounds modified the emission of the chlorophyll a fluorescence. The UV filter BP-3 caused a significant (p < 0.05) increase in cell autofluorescence ( Fig. 1A), whereas the disinfectant TCS caused a significant (p < 0.05) decrease up to 26% in the autofluorescence with respect to control cultures ( Fig. 1B). With regard to the fragrance, cells exposed to AHTN experienced a slight increase in the FL4 signal but this was not statistically significant (p < 0.05) ( Fig. 1C). 3.2. Growth and metabolic activity Growth data analysis showed that the treatment with TCS and AHTN induced a noticeable inhibitory effect on the cellular division of T. suecica in a concentration-dependent manner, which resulted in significantly (p < 0.05) lower growth rates in all cultures, except to those exposed to the lowest concentrations assayed. Cultures exposed to the highest concentrations assayed of TCS and AHTN (16 and 2.4 pg cell−1, respectively) showed a decrease of 83% and 70% in growth rate, respectively (Fig. 2B and C). These compounds have a negative effect on growth; however, cells exposed to high concentrations of BP-3 showed a significantly (p < 0.05) increase of 65% in growth rate ( Fig. 2A). The metabolic vigour of the cells was studied measuring the metabolic activity after 24 h of exposure to the PCPs using the fluorescein diacetate (FDA) cytometric assay. In the case of TCS, the fluorescent signal intensity emitted by cells, proportional to the accumulated fluorescein and correlated with the esterase activity, was strongly diminished. It was already significantly reduced (p < 0.05) in cultures exposed to the lowest disinfectant concentration and this reduction was more pronounced when the TCS concentration increased, reaching a reduction of 73% in the activity compared to control cultures at the highest TCS concentration assayed ( Fig. 2B). Also AHTN exposure caused a remarkable loss of fluorescence intensity which means a significant (p < 0.05) lower metabolic activity in all treated cultures except in cultures exposed to the lowest fragrance concentration (1.2 pg cell−1) (Fig. 2C). However, BP-3 had the opposite effect and cells exposed to this UV filter accumulated more fluorescein with respect to control cells, which means a more pronounced metabolic activity. Cultures exposed to 20 pg cell−1 and 40 pg cell−1 of BP-3 exhibited significant (p < 0.05) increases in esterase activity of around 1.5- and 2.5-fold, respectively, with respect to control cultures ( Fig. 2A).. Fig. 2. Variations in growth and metabolic activity of T. suecica cells exposed to different concentrations, expressed as cellular quota (pg cell−1), of BP-3 (A), TCS (B) and AHTN (C) for 24 h. Results are shown as percentage of variation of growth rate and metabolic activity with respect to control (for which a value of 100 is assigned, indicated by the dashed line). Significant differences with respect to control at a significance level of 0.05 (p < 0.05) are represented by an asterisk (*)..
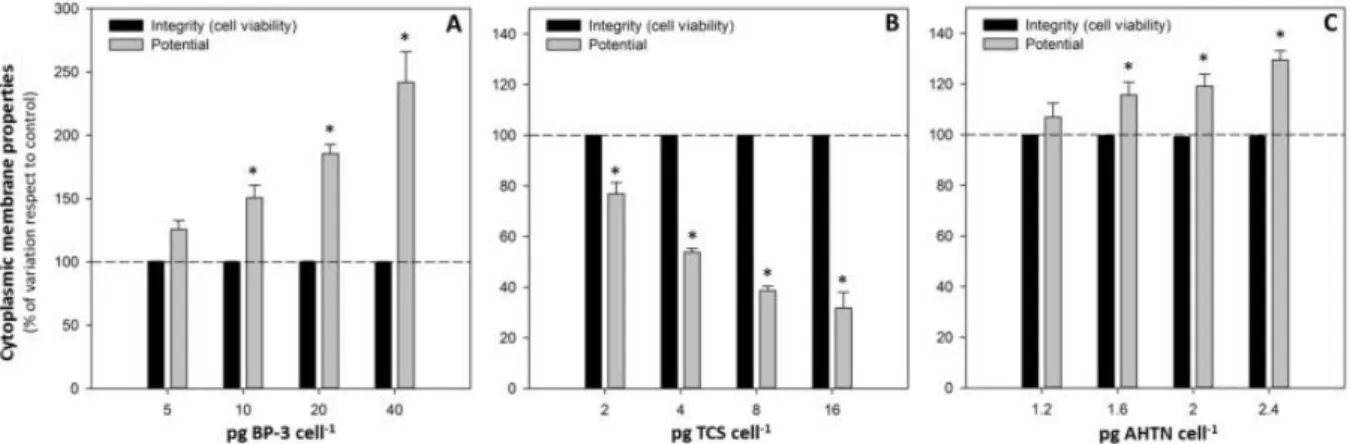
(8) 3.3. Cytoplasmic membrane properties Membrane integrity and potential are two essential membrane properties. A FCM assay based on dye exclusion of the probe PI was used to identify viable cells with intact plasma membrane (PI -). Cell viability in T. suecica cultures exposed to the three PCPs tested was not significantly (p < 0.05) affected by the addition of these compounds to the medium. After 24 h of exposure, the percentage of PI cells remained close to 100% for both control and exposed cultures. None of the PCPs assayed, even at the highest concentration tested, affected cell viability ( Fig. 3A, B, C). Nevertheless, treated cultures showed remarkable alterations on cytoplasmic membrane potential. On the one hand, cultures treated with the UV filter BP-3 and the fragrance AHTN showed a significant (p < 0.05) increase in green fluorescence emission as a result of an additional influx of the dye into the cell, which indicates a membrane depolarization. Cells exposed to the highest concentrations of BP-3 and AHTN showed an increased DiBAC4(3)-derived fluorescence of 1.4- and 0.3-fold, respectively, with respect to control cells (Fig. 3A, C). On the other hand, TCS-exposed cultures exhibited a decrease in 70% of the green fluorescence emission with respect to control cultures, indicating cell hyperpolarization (Fig. 3B).. 4. Discussion Several physicochemical analyses have confirmed the presence of PCPs in all the different aquatic compartments (Ortiz de García et al., 2013; Pintado-Herrera et al., 2013 ; Rodil et al., 2012). The three compounds tested are highly lipophilic (log Kow 4–6), which makes these compounds critical for bioaccumulation (Muir and Howard, 2006). However, there are no data about their ecotoxicity, in particular, data on marine microalgal species. Obtained results showed that the three tested PCPs caused physiological alterations on the marine microalga T. suecica after 24 h of exposure; however, cell viability remains close to 100% for all the chemicals tested. Potential metabolic adjustments or stimulation of the antioxidant defence mechanism could be involved in this maintenance ( Esperanza et al., 2015b). Cell viability endpoint could be timeexposure dependent. Therefore, the toxicological parameters evaluated can be considered as early effects because cell viability was not affected.. Fig. 3. Alterations on cytoplasmic membrane properties of T. suecica cells exposed to different concentrations, expressed as cellular quota (pg cell−1), of BP-3 (A), TCS (B) and AHTN (C) for 24 h. Results are shown as percentage of variation of membrane integrity and potential with respect to control (for which a value of 100 is assigned, indicated by the dashed line). Significant differences with respect to control at a significance level of 0.05 (p < 0.05) are represented by an asterisk (*)..
(9) Taking into account the cellular quota used for the assays (fixed in function of their effect on growth after 96 h), AHTN was the most toxic compound, followed by TCS and then, by BP-3, since AHTN showed significant alterations on the parameters analysed at much lower concentrations. The expression “toxic cellular quota” was already introduced by Moreno-Garrido et al. (2000) and tries to be an approach to a better unification of literature data by eliminating the effect of cellular density. It provides an easier way to standardize protocols through the use of a single expression containing the values for contaminant concentration and cell density, the two main factors studied in marine toxicity tests. Toxicity values which consider the contaminant that corresponds to each organism in terms of cellular content are more interesting than calculated values of EC50(Debelius et al., 2009). Based on the observed cytotoxic response, the tested compounds could be classified into two groups related to their different toxic effects on this microalgal species: BP-3 in one group and TCS and AHTN in another group. BP-3 exposed cultures showed an increase in their growth rate that could be interpreted as a first response to fight against the stress, correlating well with cellular esterase activity results, which showed a significant (p < 0.05) increase of the activity in a concentration-dependent manner ( Fig. 2A). This enzyme activity stimulation may be a result of a general metabolic stimulation induced by the toxic agent in the microalgal cells in order to adapt their physiology to adverse environmental conditions. Stimulation of this enzyme activity has also been reported in microalgae exposed to other pollutants such as paraquat or copper ( Prado et al., 2009 ; Lage et al., 2001). As a result of the increase in growth rate and metabolic activity, a decrease in cell size of treated cells was detected (Fig. 1A), since these cells were able to complete their cell cycle and to divide faster than control cells. Relative to cytoplasmic membrane potential, a significant (p < 0.05) depolarization was observed ( Fig. 3A). Uptake of the fluorophore DiBAC4(3) is indicative of disturbance of the membrane such as inhibition of pump/leak balance, blockage of channels or generation of ionic leaks, evidencing metabolic perturbations and environmental stress (Lloyd et al., 2004). Furthermore, an increase in chlorophyll a fluorescence in cells exposed to the UV filter was also detected ( Fig. 1A). Changes in the in vivo chlorophyll a fluorescence of green algae can be used as a tool to detect negative alterations on photosynthesis and to reveal response mechanisms, to quantify stress responses and to identify certain contaminants ( Prado et al., 2011; Chalifour et al., 2009; Bi Fai et al., 2007; Ekelund and Aronson, 2007; González-Barreiro et al., 2004 ; Cid et al., 1995). Sunscreens have a marked lipophilic character, so they tend to be accumulated in solid matrices such as sediments and also to be bioaccumulated in living organisms. These compounds act by absorbing ultraviolet radiation; they captured incident energy and emitted it again as heat, so it can be expected to affect the photosynthetic properties of microalgae. The observed increase in chlorophyll fluorescence suggests a decrease in the photosynthetic efficiency of cells exposed to the UV filter due to damage in the photosynthetic apparatus (Maxwell and Johnson, 2000). Several studies evaluated BP-3 toxicity on microalgae, but they only considered growth inhibition for the assessment of phytotoxic effects (Tovar-Sánchez et al., 2013; Sieratowicz et al., 2011 ; Rodil et al., 2009). Paredes et al. (2014) evaluated the ecotoxicological effects of four UV filters using marine organisms from different trophic levels, and the marine microalga I. galbana was the most affected species, being BP-3 the most toxic compound even at very low concentrations. Furthermore, the results for risk quotient showed that there was a potential threat to the coastal environments caused by this type of chemicals. In the case of sunscreens, their presence is particularly strong in coastal waters where aquatic recreational activities were carried out. As indicated above, T. suecica cultures exposed to TCS or AHTN showed a similar pattern of cytotoxicity, showing differences only for one of the examined parameters. Both compounds provoked a significant (p < 0.05) increase in volume, more pronounced in the case of TCS-exposed cells,.
(10) probably due to the incapacity to finish cell division as evidenced by growth data ( Fig. 2B and C). Growth rate and metabolic activity significantly (p < 0.05) decreased in cultures exposed to both pollutants ( Fig. 2B and C). The decrease in esterase activity could indicate that these compounds cause redox imbalances or alterations in protein synthesis and, therefore, a general decrease in cellular activity. Previous studies (Seoane et al., 2014) showed a reduction of the esterase activity in T. suecica cells exposed to antibiotics. Moreover, cells exposed to TCS also showed a decrease in autofluorescence ( Fig. 1B). Chlorophyll a fluorescence is a function of the cell pigment content and the photochemical activity of PSII in the photosynthetic electron transport chain ( Franklin et al., 2001). Therefore, this autofluorescence decrease can be related to oxidative damage to PSII, to a decrease in pigment content or to chlorophyll bleaching as a consequence of the production of reactive oxygen species (Ekmekci and Terzioglu, 2005). Despite these cytotoxicity similarities described, AHTN and TCS provoked significant (p < 0.05) alterations of the cytoplasmic membrane potential, but in a different way ( Fig. 3B and C): AHTN provoked a reduction of the cytoplasmic membrane potential (an increasing depolarization level reflected by increased DiBAC4(3)-derived fluorescence) while TCS provoked an increase of this potential (hyperpolarization reflected by decreased DiBAC4(3)-derived fluorescence). These results indicate that the induced damage to the plasma membrane begins with changes on the permeability properties before the disruption of the membrane integrity. Further studies on lipid peroxidation could elucidate the effects on cell membranes since many pollutants cause a significant increase in reactive oxygen species ( Esperanza et al., 2016 ; Cid et al., 1996). Cellular membranes are selective, dynamic barriers that play an essential role in regulating biochemical and physiological events (Cid et al., 1996). These alterations of the membrane permeability properties could lead to osmotic changes and failures in the regulatory cell volume control process, which, in turn, explain the increase in cell size observed (Fig. 1B and C). TCS is a widely used antimicrobial agent typically designed to kill or to inhibit the growth of a wide range of “undesirable” microbial species, thus it could have significant impacts on natural biotic communities (Wilson et al., 2003). Several studies have shown the toxicity of TCS on different aquatic organisms, including sludge organisms, algae, invertebrates and fish (Ciniglia et al., 2005; Dann and Hontela, 2011; Fritsch et al., 2013; Orvos et al., 2002; Riva et al., 2012 ; Yang et al., 2008). Among these organisms, microalgae were the most sensitive to TCS, but significant differences in sensitivity were found among species (Tatarazako et al., 2004 ; Orvos et al., 2002), hence TCS may address multiple target sites to a different extent in the different species (Franz et al., 2008). In bacteria, TCS has been described to block the lipid synthesis by inhibiting the enzyme enoyl-acyl carrier protein reductase (FabI) (Levy et al., 1999 ; McMurry et al., 1998). This enzyme (also isolated in microalgae) acts completing the cycle of fatty acid elongation (Zheng et al., 2013). Additionally, other modes of action involved in its toxic effect were identified, such as the destabilisation of cell membranes due to interactions of TCS with phospholipids (Villalain et al., 2001). This causes structural perturbations provoking the loss of permeability-barrier functions (Phan and Marquis, 2006), which correlates well with the results obtained in this study. Moreover, TCS exposure led to the uncoupling of oxidative phosphorylation in microalgae (Franz et al., 2008). There are scarce data about toxicity of AHTN on microalgal species but it was shown that this compound affects algae growth (Ortiz de García et al., 2013 ; Santiago-Morales et al., 2012). It was also shown that AHNT causes growth inhibition on the freshwater mussel Lampsilis cardium ( Gooding et al., 2006) and a remarkable oxidative stress in the earthworm Eisenia fetida ( Chen et al., 2011). Current toxicity bioassays with microalgae used mainly integrative endpoints such as growth. Standardised algal growth bioassays remain the preferred technique for the assessment of phytotoxic effects in most ecotoxicological studies, but these tests provide bulk measurements which do not allow us to observe potential intercellular differences within the cellular population analysed (Prado et al.,.
(11) 2011). Moreover, this conventional endpoint does not provide information about the physiological causes that can result in growth inhibition, i.e., do not offer information regarding the toxic mechanisms by which environmental chemicals disrupt biological processes in algal cells (Nestler et al., 2012). FCM allows studying different morphological and physiological properties of single cells, being a useful tool in toxicity tests with microalgae (Cid et al., 1996; Franqueira et al., 2000 ; Prado et al., 2012). In the present work, the response of T. suecica cells to three PCPs was characterized using FCM to analyse their effects on different inherent cell properties and cell physiological status based on metabolic activity and membrane stability. Through the use of fluorescence dyes that are specific for distinct biochemical properties, FCM can be used to study interferences with specific metabolic processes and to diagnose modes of action ( Adler et al., 2007 ; Stauber et al., 2002). In addition, these endpoints were helpful as early indicators of exposure to the PCPs because they could detect alterations on the microalgal physiology before viability or growth were affected. The use of chlorophyll fluorescence as an endpoint in common monoalgal toxicity assays has been described in several studies (Brack and Frank, 1998 ; Geoffroy et al., 2007). Since fluorescence emission of photosynthetic organisms changes continuously following their adaptation to the changing environment, environmental stressors such as contaminants affect the function of photosynthetic systems, thereby affecting the fluorescence emission. Furthermore, chlorophyll a fluorescence would be a good and fast biomarker because no commercial fluorochrome is necessary to analyse this microalgal inherent property. Prado et al. (2011) showed that the study of the chlorophyll a fluorescence by FCM in C. moewussi cells exposed to the herbicide paraquat was useful to characterize chlorotic populations of cells, with a drastic reduction of chlorophyll. However, in this study, the most sensitive parameters were esterase activity and cytoplasmic membrane potential. Although FDA has been, and still is, commonly used as a probe for cell viability, it may also indicate cellular metabolic activity. Enzyme inhibition measurements in microalgae are popular indicators of environmental stress. Esterase activity, in particular, has been proven useful in a variety of cell types ( Breeuwer et al., 1995 ; Humphreys et al., 1994) and has been shown to relate well to general metabolic activity (Regel et al., 2002). Bentley-Mowat (1982) first reported that the intensity of fluorescence derived from the cleavage of FDA appeared to depend on the “metabolic vigour” of the cells. In this way, FDA assay is not only helpful to discriminate between “healthy” and “stressed” cells, but also to quantify subtle responses to environmental impacts ( Prado et al., 2009 ; Seoane et al., 2014). Cytometric quantification of cellular fluorescence upon cleavage of FDA is a sensitive and rapid technique to assess phytoplankton metabolic activity (Jochem, 1999). This parameter has been proven useful to assess the toxicity of different pollutants on microalgae such as herbicides ( Esperanza et al., 2015b ; Prado et al., 2009) or heavy metals (Cid et al., 1996). Furthermore, the advantage of cytometric measurements over fluorescence microscopy or bulk estimates by fluorometry lies in the assessment of minor changes in metabolic activity by the detection of changes in the fluorescence intensity exhibited on a single-cell basis (Jochem, 1999). Cytoplasmic membrane potential has also proved to be very sensitive. Fluorochrome-based measurements of plasma membrane potential provide a useful approach for the monitoring of cellular stress in T. suecica as it has been previously shown for other organisms ( Dinsdale et al., 1995; Mason et al., 1994; Lloyd et al., 2004 ; Prado et al., 2012. The use of the fluorochrome DiBAC4(3) in this study showed that the tested PCPs damage microalgal plasma membrane, mainly by permeabilisation rather than by disruption of membrane integrity. And it can be concluded that depolarized cells were not necessarily non-viable cells as previously shown by Prado et al. (2012). Microbial plasma membrane is the chemiosmotic barrier that provides the interface between the organism and its external environment; therefore, cytoplasmic membrane potential reports on the current transport and energy status of the cell (Konrad and Hedrich, 2008)..
(12) To sum up, results obtained in this work confirm the potential use of the assayed protocols for the prospective assessment of the potential cytotoxicity of these emerging pollutants.. 5. Conclusions Although after 24 h of exposure none of the PCPs assayed affected cell viability, at least at the assayed concentrations, T. suecica cells showed significant alterations on the other parameters analysed. Diverse cell responses to the different pollutants were observed. On the one hand, the disinfectant TCS and the fragrance AHTN provoked a decrease in growth and metabolic activity. On the other hand, cells cultured in the presence of the UV-filter BP-3 showed a stimulation of their activity that could be a first response to the stress in order to adapt their physiology to adverse environmental conditions. Treated cells also showed highly relevant alterations in cytoplasmic membrane potential and changes in autofluorescence. Chlorophyll a fluorescence would be a good biomarker because no commercial fluorochrome is necessary to analyse this microalgal inherent property. But among the different subcellular endpoints assessed in this study, esterase activity and membrane potential constituted the most sensitive parameters. It can be concluded that the toxicological model used and the toxicological parameters evaluated are suitable to assess the toxicity of these emerging contaminants.. Acknowledgements M.S. and M.E. acknowledge their pre-doctoral fellowship from Xunta de Galicia (Spain). Authors would like to thank the anonymous reviewers whose comments improved the manuscript.. References Adler, N.E., Schmitt-Jansen, M., Altenburger, R., 2007. Flow cytometry as a tool to study phytotoxic modes of action. Environ. Toxicol. Chem. 26, 297-306. Bentley-Mowat, J.A., 1982. Application of fluorescence microscopy to pollution studies on marine phytoplankton. Bot. Mar. 25, 203-204. Berglund, D.L., Eversman, S., 1988. Flow cytometric measurements of pollutant stresses on algal cells. Cytometry 9, 150-155. Bi Fai, P., Grant, A., Reid, B., 2007. Chlorophyll a fluorescence as a biomarker for rapid toxicity assessment. Environ. Toxicol. Chem. 26, 1520-1531. Brack, W., Frank, H., 1998. Chlorophyll a fluorescence: a tool for the investigation of toxic effects in the photosynthetic apparatus. Ecotoxicol. Environ. Saf. 40, 34-41. Brausch, J.M., Rand, G.M., 2011. A review of personal care products in the aquatic environment: environmental concentrations and toxicity. Chemosphere 82, 1518-1532. Breeuwer, P., Drocourt, J.L., Bunschoten, N., Zwietering, M.H., Rombouts, F.M., Abee, T., 1995. Characterisation of uptake and hydrolysis of fluorescein diacetate and carboxyfluor- escein diacetate by intracellular esterases in Saccharomyces cerevisiae, which result in accumulation of fluorescent product. Appl. Environ. Microbiol. 61, 1614-1619. Chalifour, A., Spear, P.A., Boily, M.H., DeBlois, C., Giroux, I., Dassylva, N., Juneau, P., 2009. Assessment of toxic effects of pesticide extracts on different green algal species by using chlorophyll a fluorescence. Toxicol. Environ. Chem. 91, 1315-1329. Chen, C., Xue, S., Zhou, Q., Xie, X., 2011. Multilevel ecotoxicity assessment of polycyclic musk in the earthworm Eisenia fetida using traditional and molecular endpoints. Ecotoxicology 20, 1949-1958. Cid, A., Herrero, C., Torres, E., Abalde, J., 1995. Copper toxicity on the marine microalga Phaeodactylum tricornutum: effects on photosynthesis and related parameters. Aquat. Toxicol. 31, 165-174. Cid, A., Fidalgo, P., Herrero, C., Abalde, J., 1996. Toxic action of copper on the membrane system of a marine diatom measured by flow cytometry. Cytometry 25, 32-36. Ciniglia, C., Cascone, C., Lo Giudice, R., Pinto, G., Pollio, A., 2005. Application of methods for assessing the geno- and cytotoxicity of Triclosan to C. ehrenbergii. J. Hazard. Mater 122, 227-232..
(13) Dai, G., Huang, J., Chen, W., Wang, B., Yu, G., Deng, S., 2014. Major pharmaceuticals and personal care products (PPCPs) in wastewater treatment plant and receiving water in Beijing, China, and associated ecological risks. Bull. Environ. Contam. Toxicol. 92, 655-661. Dann, A.B., Hontela, A., 2011. Triclosan: environmental exposure, toxicity and mechanisms of action. J. Appl. Toxicol. 31, 285-311. Daughton, C.G., Ternes, T.A., 1999. Pharmaceuticals and personal care products in the environment: agents of Subtle Change? Environ. Health Perspect. 107, 907-938. Debelius, B., Forja, J.M., DelValls, A., Lubi an, L.M., 2009. Toxicity and bioaccumulation of copper and lead in five marine microalgae. Ecotoxicol. Environ. Saf. 72, 1503-1513. DeLorenzo, M.E., Fleming, J., 2008. Individual and mixture effects of selected pharmaceuticals and personal care products on the marine phytoplankton species Dunaliella tertiolecta. Arch. Environ. Contam. Toxicol. 54, 203-210. Dinsdale, M.G., Lloyd, D., Jarvis, B., 1995. Yeast vitality during cider fermentation: two approaches to the measurement of membrane potential. J. Inst. Brew. 101, 453-458. Dorsey, J., Yentsch, C.M., Mayo, S., McKenna, C., 1989. Rapid analytical technique for the assessment of cell metabolic activity in marine microalgae. Cytometry 10, 622-628. Ekelund, N.G.A., Aronson, K.A., 2007. Changes in chlorophyll a fluorescence in Euglena gracilis and Chlamydomonas reinhardtii after exposure to wood-ash. Environ. Exp. Bot. 59, 92-98. Ekmekci, Y., Terzioglu, S., 2005. Effects of oxidative stress induced by paraquat on wild and cultivated wheat. Pestic. Biochem. Physiol. 83, 69-71. Esperanza, M., Cid, A., Herrero, C., Rioboo, C., 2015a. Acute effects of a prooxidant herbicide on the microalga Chlamydomonas reinhardtii: screening cytotoxicity and genotoxicity endpoints. Aquat. Toxicol. 165, 210-221. Esperanza, M., Seoane, M., Rioboo, C., Herrero, C., Cid, A., 2015b. Chlamydomonas reinhardtii cells adjust the metabolism to maintain viability in response to atrazine stress. Aquat. Toxicol. 165, 64-72. Esperanza, M., Seoane, M., Rioboo, C., Herrero, C., Cid, A., 2016. Early alterations on photosynthesis-related parameters in Chlamydomonas reinhardtii cells exposed to atrazine: a multiple approach study. Sci. Total Environ. 554e555, 237-245. Franklin, N.M., Stauber, J.L., Lim, R.P., 2001. Development of flow cytometry-based algal bioassays for assessing toxicity of copper in natural waters. Environ. Toxicol. Chem. 20, 160-170. Franqueira, D., Orosa, M., Torres, E., 2000. Potential use of flow cytometry in toxicity studies with microalgae. Sci. Total Environ. 247, 119e126. Franz, S., Altenburger, R., Heilmeier, H., Schmitt-Jansen, M., 2008. What contributes to the sensitivity of microalgae to triclosan? Aquat. Toxicol. 90, 102-108. Fritsch, E.B., Connon, R.E., Werner, I., Davies, R.E.U.E., Beggel, S., Feng, W., Pessah, I.N., 2013. Triclosan impairs swimming behavior and alters expression of Excitation Contraction coupling proteins in fathead minnow (Pimephales promelas). Environ. Sci. Technol. 47, 2008-2017. Garcia-Jares, C., Llompart, M., Polo, M., Salgado, C., Macias, S., Cela, R., 2002. Optimisation of a solid-phase microextraction method for synthetic musk compounds in water. J. Chromatogr. A 963, 277-285. Geoffroy, L., Gilbin, R., Simon, O., Floriani, M., Adam, C., Pradines, C., Cournacb, L., Garnier-Laplace, J., 2007. Effect of selenate on growth and photosynthesis of Chlamydomonas reinhardtii. Aquat. Toxicol. 83, 149-158. Gimeno, R.A., Marce, R.M., Borrull, F., 2004. Determination of organic contaminants in coastal water. TrAC Trends Anal. Chem. 23, 341-350. Giokas, D.L., Salvador, A., Chisvert, A., 2007. UV filters: from sunscreens to human body and the environment. TrAC Trends Anal. Chem. 26, 360-374. González-Barreiro, O., Rioboo, C., Cid, A., Herrero, C., 2004. Atrazine-induced chlorosis in Synechococcus elongatus cells. Arch. Environ. Contam. Toxicol. 46, 301-307. Gooding, M.P., Newton, T.J., Bartsch, M.R., Hornbuckle, K.C., 2006. Toxicity of synthetic musks to early life stages of the freshwater mussel Lampsilis cardium. Arch. Environ. Contam. Toxicol. 51, 549-558. Herrero, C., Cid, A., Fábregas, J., Abalde, J., 1991. Yields in biomass and chemical constituent of four commercially important marine microalgae with different culture media. Aquac. Eng. 10, 99-110. Humphreys, M.J., Allman, R., Lloyd, D., 1994. Determination of the viability of Trichomonas vaginalis using flow cytometry. Cytometry 15, 343-348..
(14) Jochem, F.J., 1999. Dark survival strategies in marine phytoplankton assessed by cytometric measurement of metabolic activity with fluorescein diacetate. Mar. Biol. 135, 721-728. Konrad, K.R., Hedrich, R., 2008. The use of voltage-sensitive dyes to monitor signalinduced changes in membrane potential-ABA triggered membrane depolarization in guard cells. Plant J. 55, 161-173. Lage, O.M., Sansonetty, F., O'Connor, J.E., Parente, A.M., 2001. Flow cytometric analysis of chronic and acute toxicity of copper(II) on the marine dinoflagellate Amphidinium carterae. Cytometry 44, 226-235. Levy, C.W., Roujeinikova, A., Sedelnikova, S., Baker, P.J., Stuitje, A.R., Slabas, A.R., Rice, D.W., Rafferty, J.B., 1999. Molecular basis of triclosan activity. Nature 398, 383-384. Lloyd, D., Harris, J.C., Biagini, G.A., Hughes, M.R., Maroulis, S., Bernard, C., Wadley, R.B., Edwards, M.R., 2004. The plasma membrane of microaerophilic protists: oxidative and nitrosative stress. Microbiology 150, 1183-1190. Mason, D.J., Allman, R., Stark, J.M., Lloyd, D., 1994. Rapid estimation of bacterial antibiotic susceptibility with flow cytometry. J. Microsc. 176, 8-16. Maxwell, K., Johnson, G., 2000. Chlorophyll fluorescence - a practical guide. J. Exp. Bot. 51, 659-668. McMurry, L.M., Oethinger, M., Levy, S.B., 1998. Triclosan targets lipid synthesis. Nature 394, 531-532. Moreno-Garrido, I., Lubián, L.M., Soares, M., 2000. Influence of cellular density on determination of EC50 in microalgal growth inhibition tests. Ecotoxicol. Environ. Saf. 47, 112-116. Muir, D.C., Howard, P.H., 2006. Are there other persistent organic pollutants? A challenge for environmental chemists. Environ. Sci. Technol. 40, 7157-7166. Naidu, R., Jit, J., Kennedy, B., Arias, V., 2016. Emerging contaminant uncertainties and policy: the chicken or the egg conundrum. Chemosphere 154, 385-390. Nestler, H., Groh, K.J., Schönenberger, R., Behra, R., Schirmer, K., Eggen, R.I.L., Suter, M.J.F., 2012. Multipleendpoint assay provides a detailed mechanistic view of responses to herbicide exposure in Chlamydomonas reinhardtii. Aquat. Toxicol. 110-111, 214-224. NORMAN. Network of reference laboratories for monitoring of emerging environmental pollutants. www.norman-network.net. Ortiz de García, S., Pinto, G., García-Encina, P., Irusta, R., 2013. Consumption and occurrence of pharmaceutical and personal care products in the aquatic environment in Spain. Sci. Total Environ. 444, 451-465. Orvos, D., Versteeg, D., Inauen, J., Capdevielle, M., Rothenstein, A., Cunningham, V., 2002. Aquatic toxicity of triclosan. Environ. Toxicol. Chem. 21, 1338-1349. Paredes, E., Perez, S., Rodil, R., Quintana, J.B., Beiras, R., 2014. Ecotoxicological evaluation of four UV filters using marine organisms from different trophic levels Isochrysis galbana, Mytilus galloprovincialis, Paracentrotus lividus, and Siriella armata. Chemosphere 104, 44-50. Peck, A.M., 2006. Analytical methods for the determination of persistent ingredients of personal care products in environmental matrices. Anal. Bioanal. Chem. 386, 907-939. Phan, T.N., Marquis, R.E., 2006. Triclosan inhibition of membrane enzymes and glycolysis of Streptococcus mutans in suspensions and biofilms. Can. J. Microbiol. 52, 977-983. Pintado-Herrera, M.G., González-Mazo, E., Lara-Martín, P.A., 2013. Environmentally friendly analysis of emerging contaminants by pressurized hot water extraction-stir bar sorptive extraction-derivatization and gas chromatographymass spectrometry. Anal. Bioanal. Chem. 405, 401-411. Prado, R., García, R., Rioboo, C., Herrero, C., Abalde, J., Cid, A., 2009. Comparison of the sensitivity of different toxicity test endpoints in a microalga exposed to the herbicide paraquat. Environ. Int. 35, 240247. Prado, R., García, R., Rioboo, C., Herrero, C., Cid, A., 2015. Suitability of cytotoxicity endpoints and test microalgal species to disclose the toxic effect of common aquatic pollutants. Ecotoxicol. Environ. Saf. 114, 117-125. Prado, R., Rioboo, C., Herrero, C., Cid, A., 2011. Characterization of cell response in Chlamydomonas moewusii cultures exposed to the herbicide paraquat: induction of chlorosis. Aquat. Toxicol. 102, 10-17. Prado, R., Rioboo, C., Herrero, C., Cid, A., 2012. Screening acute cytotoxicity biomarkers using a microalga as test organism. Ecotoxicol. Environ. Saf. 86, 219-226. Rabinovitch, P.S., June, C.H., 1990. Intracellular ionized calcium, membrane potential, and pH. In: Ormerod, M.G. (Ed.), Flow Cytometry. A Practical Approach. Oxford University Press, Oxford, UK, pp. 161-185. Regel, R.H., Ferris, J.M., Ganf, G.G., Broookes, J.D., 2002. Algal esterase activity as a biomeasure of environmental degradation in a freshwater creek. Aquat. Toxicol. 59, 209e223..
(15) Rioboo, C., O'Connor, J.E., Prado, R., Herrero, C., Cid, A., 2009. Cell proliferation alterations in Chlorella cells under stress conditions. Aquat. Toxicol. 94, 229-237. Riva, C., Cristoni, S., Binelli, A., 2012. Effects of triclosan in the freshwater mussel Dreissena polymorpha: a proteomic investigation. Aquat. Toxicol. 118e119, 62-71. Rodil, R., Moeder, M., Altenburger, R., Schmitt-Jansen, M., 2009. Photostability and phytotoxicity of selected sunscreen agents and their degradation mixtures in water. Anal. Bioanal. Chem. 395, 1513-1524. Rodil, R., Quintana, J.B., Concha-Graña, E., López-Mahía, P., Muniategui-Lorenzo, S., Prada-Rodríguez, D., 2012. Emerging pollutants in sewage, surface and drinking water in Galicia (NW Spain). Chemosphere 86, 1040-1049. Sánchez-Avila, J., Tauler, R., Lacorte, S., 2012. Organic micropollutants in coastal waters from NW Mediterranean Sea: sources distribution and potential risk. Environ. Int. 46, 50-62. Santiago-Morales, J., Gómez, M.J., Herrera, S., Fernández-Alba, A.R., García-Calvo, E., Rosal, R., 2012. Oxidative and photochemical processes for the removal of galaxolide and tonalide from wastewater. Water Res. 46, 443-4447. Sauvé, S., Desrosiers, M., 2014. A review of what is an emerging contaminant. Chem. Cent. J. 8 (15), 1-7. Shapiro, H.M., 1995. Practical Flow Cytometry, third ed. Willey-Liss Inc., New York, p. 542. Seoane, M., Rioboo, C., Herrero, C., Cid, A., 2014. Toxicity induced by three antibiotics commonly used in aquaculture on the marine microalga Tetraselmis suecica (Kylin) Butch. Mar. Environ. Res. 101, 1-7. Sieratowicz, A., Kaiser, D., Behr, M., Oetken, M., Oehlmann, J., 2011. Acute and chronic toxicity of four frequently used UV filter substances for Desmodesmus subspicatus and Daphnia magna. J. Environ. Sci. Health., Part A Tox. Hazard. Subst. Environ. Eng. 46, 1311-1319. Singer, H., Muller, S., Tixier, C., Pillonel, L., 2002. Triclosan: occurrence and fate of a widely used biocide in the aquatic environment. Field measurements in wastewater treatment plants, surface waters, and lake sediments. Environ. Sci. Technol. 36, 4998-5004. Stauber, J.L., Franklin, N.M., Adams, M.S., 2002. Applications of flow cytometry to ecotoxicity testing using microalgae. Trends Biotechnol. 20, 141e143. Sumner, N.R., Guitart, C., Fuentes, G., Readman, J.W., 2010. Inputs and distributions of synthetic musk fragrances in an estuarine and coastal environment; a case study. Environ. Pollut. 158, 215-222. Tatarazako, N., Ishibashi, H., Teshima, K., Kishi, K., Arizono, K., 2004. Effects of triclosan on various aquatic organisms. Environ. Sci. 11, 133-140. Tovar-Sánchez, A., Sánchez-Quiles, D., Basterretxea, G., Bened e, J.L., Chisvert, A., Salvador, A., MorenoGarrido, I., Blasco, J., 2013. Sunscreen products as emerging pollutants to coastal waters. PLoS One 8, e65451. Villalain, J., Mateo, C.R., Aranda, F.J., Shapiro, S., Micol, V., 2001. Membranotropic effects of the antibacterial agent triclosan. Arch. Biochem. Biophys 390, 128-136..
(16)
Figure
Documento similar
Finally, Krogman also seems to be the first anthropologist to report that the correlation between, “Iepiphyseal union with tooth eruption indicates that the growth process in
Models that tend to work well for short‐term projections based on, Support Vector Machines,
Moreover, Lau demonstrates that in every bivariate endogenous growth model where both variables exhibit a unit root, there will be exactly one cointegrating vector, or one
In order to be competitive in the national agricultural sector, the regions should first improve the growth of their local AGVA, as well as their competitiveness at the regional
‘PM’, ‘Fe+Ca’ and ‘Ca’ were the treatments located on the most positive part of the PC1 axis, indicating that their application contributed to an increase in the properties
In the preparation of this report, the Venice Commission has relied on the comments of its rapporteurs; its recently adopted Report on Respect for Democracy, Human Rights and the Rule
Influence of crystalline admixtures on the short-term behaviour of mortars exposed to sulphuric acid
Physical (mass loss, ultrasonic pulse velocity and capillary water absorption coefficient) and mechanical (compressive strength) properties were studied after the mortars were
In contrast, two populations were found for the mutant: a minor population, with distances ranging between 3.5-7 Å, and a major population, with highly oscillating distances,
