Climate variability and agricultural production in Argentina : the role of risk transfer mechanism
29
0
0
Texto completo
(2) ENSAYOS DE POLÍTICA ECONÓMICA – AÑO 2016 ISSN 2313-979X - Año X Vol. II Nro. 4. CLIMATE VARIABILITY AND AGRICULTURAL PRODUCTION IN ARGENTINA: THE ROLE OF RISK-TRANSFER MECHANISMS Marcos Gallacher1, Daniel Lema2, Laura Gastaldi3 y Alejandro Galetto4 Resumen La investigación relacionada con la variabilidad climática es particularmente importante en las condiciones actuales de la agricultura argentina. Éstas incluyen (a) una mayor especialización en la soja, con la consiguiente reducción de las posibilidades de reducción del riesgo a través de efectos "cartera", (b) mayor importancia de la producción de cultivos en la agricultura argentina, (c) inestabilidad macroeconómica que resulta en una severa contracción e incremento de las tasas de interés del crédito y (d) tendencia al alza en el uso de insumos y en los costos de producción por acre, con el consecuente aumento del rendimiento de las cosechas. Este trabajo resume las investigaciones recientes relacionadas con la variabilidad de la producción en la agricultura argentina, así como las consecuencias de esta variabilidad en la eficiencia y asignación de recursos y presenta una visión general de las estrategias para hacer frente a los eventos climáticos adversos. Estimamos la voluntad de pagar (WTP) de los productores agrícolas por los mecanismos de seguro tipo índice, y esbozamos los requisitos para el desarrollo de un mercado de transferencia de riesgo para los productores agrícolas.. Códigos JEL: Q14, Q18, G22, D82 Palabras Clave: seguro por índice climático, producción de cultivos, demanda de seguros, Argentina. Abstract Research related to climate variability is particularly important in the current conditions faced by Argentine agriculture. These include (a) increased specialization in soybeans, with resulting reduced possibilities of risk-reduction through “portfolio” effects, (b) increased importance of crop production in argentine agriculture, (c) macroeconomic instability resulting in severe contraction and increased interest rates of credit and (d) upward trend in 1 2 3 4. Universidad del CEMA. E-mail: gmg@cema.edu.ar Universidad del CEMA and Instituto de Economía – INTA. E-mail: danilema@gmail.com EEA Rafaela – INTA. E-mail: gastaldi.laura@inta.gob.ar Universidad Austral – Rosario and UTN Facultad Regional Rafaela. E-mail: alejandro_galetto@yahoo.com.ar. 11.
(3) Climate Variability and Agricultural Production in Argentina: The Role of Risk-transfer Mechanisms, pp. 11-38 Marcos Gallacher, Daniel Lema, Laura Gastaldi y Alejandro Galetto. input use and per-acre production costs with consequent increase in break-even crop yields. This paper summarizes recent research related to production variability in Argentine agriculture, as well as the consequences of this variability on efficiency and resource allocation and presents an overview of strategies for coping with adverse climate events. We estimate willingness to pay (WTP) of agricultural producers for index-type insurance mechanisms, and outline the requirements for the development of a risk-transfer market for agricultural producers.. JEL Codes: Q14, Q18, G22, D82 Keywords: weather-based index insurance, crop production, demand for insurance, Argentina. 12.
(4) ENSAYOS DE POLÍTICA ECONÓMICA – AÑO 2016 ISSN 2313-979X - Año X Vol. II Nro. 4. I.. Introduction: Risk transfer in Argentina. In Argentina, as in many Latin American countries, poor functioning of financial markets limit the possibilities of smoothing farmer’s inter-year income variability due to climate shocks. Futures and options markets - of major importance both for price forecasting as well as for the transfer of risk - are insufficiently developed. If export demand for agricultural products is perfectly elastic (as is the case for a small open economy) the impact of “bad” years due to climate is not dampened by price increases and variability of agricultural production translates directly into farm-level income variability. This contrasts with large countries, like the US, where national production shortfalls can be expected to result - at least partially – in some price increases. If individuals have limited opportunities to adapt to climate variability, production risk can have different types of consequences on the farmers, rural areas and the country as a whole. For farmers it can result first, in a decrease in welfare due to the need to adapt to inter-year fluctuations in net incomes. Consumption patterns may be affected, in particular if capital markets do not allow (or allow at a high cost) borrowing in times of financial stress. This of course is more significant for limited-resource producers, where net income levels are not much higher than yearly household consumption. Restrictions in opportunities to cope with production risk can also result in allocative inefficiency: for example a “safety first” (e.g. see Anderson, Dillon and Hardaker, 1977) behavioral pattern may sacrifice profits in order to reduce the probability that profits fall below a certain threshold. In other cases, “conservative” behavior may imply using input levels such that marginal costs are below output prices thus resulting in a loss of net surplus. Alternatively, risk may push farmers into using “excessive” input amounts: for example, under grazing production systems livestock producers may choose “low” stocking rates (low cattle/land ratios) in order to protect themselves against shortfalls in forage production due to drought or excessive rainfall. Or they may invest in forage reserves in the form of silage or hay inventories “in case” pasture production is insufficient. Such inventories, of course, carry a cost. Production risk, income and consumption variability may have impacts beyond the farm gates. The fortunes of rural areas are partially “tied” to what happens in farms. Although caution has to be used in using “multiplier” type of concepts (double counting is a possible error) it appears reasonable to expect “ripple” effects of farm shortfalls on the communities in which farms rely on. Input and credit suppliers, output processors as well as consumer goods retailers are affected by reduced farm incomes. In some cases severe output shortfalls may also result in increased opportunism and moral hazard: for example, nonpayment of debt may be chosen by some even when objectively, payments could be met. This results in an increased difficulty in separating opportunists from those who face real difficulties. Reduced trust among community members may thus result, with a corresponding reduction in exchange and thus efficiency. These effects are perceived as “an important” issue by informed observers, however no clear-cut evidence exists on the implications of this risk at the micro or aggregate levels or. 13.
(5) Climate Variability and Agricultural Production in Argentina: The Role of Risk-transfer Mechanisms, pp. 11-38 Marcos Gallacher, Daniel Lema, Laura Gastaldi y Alejandro Galetto. how to develop institutions able to transfer the production risk in an efficient manner. An important challenge for both public policy as well as private insurance firms is how to expand “non-traditional” insurance products, and in particular how to develop multi-risk coverage for agricultural producers. In Argentina, hail and hail plus “additional” insurance premiums account for more than 95 percent of total premiums, with multi-risk premiums totaling less than 2 percent. Existing multi-risk insurance schemes are tailor-made for individual (in general relatively large) farms. These schemes result in an indemnity if yields fall below certain threshold, indemnity being the difference between the threshold and the observed yield at the farm. Insurance schemes such as these have very high costs, further costs per unit of land increase substantially for smaller as compared to larger producing units. The principle of insurance as a risk-transfer instrument is that, by accepting appropriate premiums from a large number of clients, the insurance company is able to pool the risks. Using information about the frequency and level of claims, the company set the premiums at levels that will enable it to pay all the indemnities (pure premium) plus a margin for operating costs and profit. This means that the expected value of the insurance contract is negative from the point of view of the farmer. In consequence, commercial insurance is purchased only for risk averters: individuals that are willing to pay a premium greater than the expected loss (actual loss times probability). A key question is how large is the difference between the pure premium and the commercial premium. Asymmetric information problems increase the costs of providing commercial insurance and limit the application of traditional crop insurance in rural areas, particularly in developing countries. Informational asymmetry occurs when one of the parties of the contract has more or better information about a risky outcome than the other. Two main problems of asymmetric information are pervasive in agricultural insurance markets: adverse selection and moral hazard. Adverse selection occurs when potential insurance clients have hidden information about their risk exposure that is not available to the insurance company, who then becomes more likely to erroneously assess the risk. Adverse selection problems increase the costs, and insurance companies must set a higher premium if informational asymmetry makes it impossible to identify the clients with higher risk. Moral hazard occurs when one of the parties engage in hidden actions that increase their exposure to risk. Moral hazard is a form of post-contractual opportunism that can leave the insurer exposed to higher levels of risk than had been anticipated when premiums were set. For example, a farmer with multi-risk crop insurance may choose to neglect a poor crop, knowing that the insurer will pay for a shortfall in yields. Monitoring behavior to totally control moral hazard is impossible or very costly and therefore increases the insurance premiums. II. Index insurance: Characteristics, advantages and disadvantages In recent years, weather index (or parametric) insurance products have received increased attention. With index insurance products payment of an indemnity depends on an objective index based, for example, on observations of rainfall, temperature or average area yields,. 14.
(6) ENSAYOS DE POLÍTICA ECONÓMICA – AÑO 2016 ISSN 2313-979X - Año X Vol. II Nro. 4. rather than actual loss. If the index falls below (or rises above) a previously agreed threshold value, then the indemnities are paid by the insurance company. One important condition is that the index should be independent, reliable and beyond the control of both the insurer and the insured. Because there is an objective index, easy to measure at low cost, it is relatively easy to calculate the probability that indemnities are due. It is important to remark that the indemnity is calculated on the results of the weather index (or average area yields) measured in the area where the farm is located, not on the actual farm results on weather or yields. For economic agents exposed to weather-related financial losses, weather index insurance provide a mechanism for coping with risk efficiently. The benefits to such a contract design are several and appropriate to rural areas where covariate risk, asymmetric information and high transactions costs implies that conventional insurance is extremely costly or not available. Under an index contract insurance companies and insured clients need only monitor the index to know when a claim is due and indemnity payments must be made. They do not need to verify claims of individual losses at the farm, which can substantially reduce the transactions costs of monitoring and verification of the insurance contracts. These gains come at the cost of basis risk, which refers to the imperfect correlation between an insured’s potential loss experience and the behavior of the underlying index on which the index insurance payout is based. A contract holder may experience the type of losses insured against, but fail to receive a payout if the overall index is not triggered. Conversely, while the aggregate experience may result in a triggered contract, some insured individuals may not have experienced losses yet still receive payouts. The tradeoff between basis risk and reductions in incentive problems and costs is thus a critical determinant of the effectiveness of index insurance products. The lower the basis risk the higher the effectiveness and the efficiency of the risk transfer. The key point here is if the disadvantage of the basis risk may be more than compensated for by the cost advantages of index insurance in terms of lower premiums and administration costs. Agricultural applications of such products are increasingly being discussed since many agricultural production enterprises are highly sensitive to extreme weather conditions (Richards et al., 2004; Vedenov and Barnett, 2004; Chen et al., 2004; Varangis et al., 2002; Mahul, 2001; Martin et al., 2001; Skees et al., 2001; Turvey, 2001, Deng et al. 2007, Chantarat et al. 2009). Index (or “parametric) based insurance schemes allow reduction in delivery costs including in these moral hazard and adverse selection costs. However, they require substantial set-up costs in the form of (i) information on weather, yields and economic impacts, and (ii) potential impact of contract design alternatives. Also, as a new product it can be difficult for stakeholders to understand and time and resources must be invested in explaining how it works. Finally the most important problem is the potential low correlation between the index and farm results, or in other terms when insurance payouts do not match the actual losses – either there are losses but not payout, or a payout is triggered even though there are no losses. This “basis risk” for the insured remains a significant problem. Our research focuses on the possibility of obtaining welfare or production efficiency gains via public policy measures aimed at increasing the use of transfer of risk in agricultural production. We point out that in Argentina there is a considerable potential for some index. 15.
(7) Climate Variability and Agricultural Production in Argentina: The Role of Risk-transfer Mechanisms, pp. 11-38 Marcos Gallacher, Daniel Lema, Laura Gastaldi y Alejandro Galetto. insurance alternatives. For reasons to be discussed in other sections of this paper, public intervention (e.g. in the form of improving the availability of farm-level yields, or sitespecific climate information) may help the decision process of both suppliers and demanders of insurance. If this occurs, efficiency gains could result. The design of index products and the estimation of benefits derived from index insurance is a necessary first step in order to decide whether publicly-sponsored projects such as mentioned should be undertaken. These benefits can be gauged by different methods. Among these willingness-to-pay (WTP) is a convenient and well-tried alternative that allows inferences to be made on aspects such as quantity demanded at different prices, consumer (or producer) surplus and other aspects (see, e.g. Hanemann, 1984; Kealy, Montgomery and Dovidio, 1990; Mitchell and Carson, 1989). WTP for insurance will vary substantially among productive regions and farm types. This occurs because, as mentioned in previous sections, alternatives open to the farmer for risk reduction include not only insurance but production diversification, access to the non-farm labor market, renting out machinery or land and others. Following sections discuss the design of index insurance products and WTP for two study cases (soybeans and milk) in argentine agriculture. III.. Index insurance in soybean production. III.1. Climate index and crop yields Considerable potential exists for improving insurance contracts such as the one presented in this section. For example, correlation between model predictions and regional or farm yields can be expected to be higher than correlation between simple meteorological data and yields. Indeed, models “build-in” the relevant production function relating multiple weather inputs and yields. Model output could thus be used in agricultural insurance contract: instead of the “trigger” for indemnity payment being calculated on (say) growing season rainfall, it could be based on yields predicted from a crop growth model which takes into account not only the rainfall variable but several other variables determining yield. Constraints have to overcome, however, for this potential to be realized: models have to be developed and calibrated and (most importantly) institutional and legal issues have to be ironed out before contracts can incorporate model results as indemnity trigger mechanisms. The final objective of a climate index is to reflect as accurately as possible the “input” of climate variables to plant growth and ultimately yield. Note that as in any production process, climate input variables (z1, z2, …zn) result in output y, given decision input levels (x1, x2, …xn) chosen by the producer. As in any production process, climate inputs zi substitute among themselves, and substitute with decision input xj. Note that the insurance contract can be based on individual climate inputs zi (e.g. rainfall, temperature) or may be based on a function of climate inputs: z = f (z1, z2, …zn). As an example of the latter, a “days of water stress” index may be constructed on the basis of daily observations of rainfall, temperature and wind. If carefully designed correlation between this index and crop growth or yield should be higher than correlation between an individual variable (rainfall) and temperature.. 16.
(8) ENSAYOS DE POLÍTICA ECONÓMICA – AÑO 2016 ISSN 2313-979X - Año X Vol. II Nro. 4. The “ultimate” climate index result from a full-blown crop growth simulation model that maps climate input variables (z1, z2, …zn) and decision input levels (x1, x2, …xn) to predicted yields y. Models of this type exists and have been used to predict crop yields. Conceptually, the insurance contract could be based on these predicted yields instead of on “raw” climate data. The predicted yield is basically an “aggregate input” of climate variables, where aggregation has been made taking into account the nature of the transformation process (production function) of climate inputs (z1, z2, …zn) to output. For example, an indemnity could result if predicted yield yp is below some threshold yT – that is if growing conditions are sufficiently “unfavorable” so as to result in a “low” yield of yp. While the above is conceptually feasible, “practical” constraints may limit applicability. The production model is in the last instance opaque to interested parties -- crop physiologists are the only ones who understand “what is going on” in calculations. Opaqueness may ultimately result in contractual failure between suppliers and demanders of insurance. The difficulty basing contracts on “high quality but opaque” indexes may force parties to settle for simple but crude climate indexes. For example, as discussed before, a soybean insurance contract may be based on growing-season rainfall. The relevant issue here is whether this contract results in risk-reduction for the producer: that is, given that unfavorable conditions result in a yield drop ∆y, the contract triggers and indemnity I in order to (partially or totally) offset the loss incurred. Agronomic research has found – below some threshold - a linear response of soybean yield to water availability (see e.g. Andrade and Sadras, 2000; Aiken and others, 2011). Insurance contracts have been designed based on this finding (Gastaldi and others, 2011). We analyze here the applicability of the rainfall insurance scheme to soybean production in 32 departments of the main production area of Argentina using rainfall data published by the Servicio Meteorológico Nacional (SMN). Yield data for the 1980/81 – 2009/10 period (30 years) is used to analyze: (i) yield losses in “drought” years and (ii) indemnity payments that would result – under the specified contract – in these years. The insurance contract proposed below is based on three variables: growing-season rainfall (RG), “trigger” rainfall below which indemnity is paid (RT), and a “catastrophe” rainfall level below which indemnity is 100 percent of insured value (RC). The contract is of the following type (Indemnity expressed as percentage of insured crop yield):. (1) RG ≥ RT. Indemnity = 0. (2) RC< RG< RT. Indemnity = 100*[(RT – RG) /(RT - RC)]. (3) RG ≤ RC. Indemnity = 100 %. 17.
(9) Climate Variability and Agricultural Production in Argentina: The Role of Risk-transfer Mechanisms, pp. 11-38 Marcos Gallacher, Daniel Lema, Laura Gastaldi y Alejandro Galetto. Note that (2) implies a linear “loss” of yield when rainfall falls below RT. For the analysis we fix RT = 140 mm5 and RC = 50 mm. We calculate RG for each partido as (2/3) of cumulative rainfall between December and February. We use a 30-year time series of yield history of 32 partidos. Some 873 observations result. Table 1 and Figure 1present summary statistics. The total number of observations (partidos x years) is 873 – resulting roughly from the 30-year period for the 32 partidos (no soybean was planted for some partidos and years, no rainfall data is available for others). We focus attention here on years where yield losses were equal or greater that 20 percent.6 The insurance policy represented by equations (1) – (3) above would have triggered insurance payments in 57 out of the total 142 “incidents” where yield losses were greater than 20 percent. Average yield loss in these 142 “incidents” was 38 percent, and average indemnity payment only 14 percent. Some specific considerations on data follow: a. Table 1: From the total of 873 yield-rainfall observations, 142 (or 16 percent) correspond to a yield drop of 20 percent or more. Somewhat arbitrarily, this output drop is taken as the “threshold” above which negative impact on farm finance begins to kick in. b. Table 1: The insurance contract presented in the previous paragraph would have resulted in an indemnity payment in 57 of these 142 cases with yield drops. Indemnity is paid out in 7 percent of the total 873 observations, less than half of the 142 where a drop in yield (> 20 percent) occurs. c. Table 1: Average indemnity payment (where the average is calculated only for years where indemnity is paid) corresponds closely to average losses in these years (respectively 36 vs 38 percent). However, the fact that indemnity is triggered in less than half of the years where yield drop occurs, results in an indemnity well below average yield loss (14 vs 38 percent). d. Table 1: If no drought occurs, probability of a drop in yields is low. However, if a drought (as defined here i.e. rainfall equal or less than 140 mm during the growing season) occurs, probability of drop of yields being no greater than 20 percent is 62 percent. That is, in “dry” years a relatively high probability exists that yields not be much below average. e. Figure 1: Higher yield losses are associated with higher indemnity payments. However, and as mentioned before, in many years where yield losses occurs, no indemnity is triggered (data points on x-axis). Moreover, an increase in the severity of yield drop is associated with an increased dispersion of indemnity payments: “average” payment may correspond quite well to “average” damage”, however the difference between these two magnitudes may be substantial, in particular when damages are relatively high.. 5. We fix a slightly higher RT than for Pergamino considering a more sensitive average conditions in the pampean region than in this specific site. 6 “Yield loss” for the i-th partido in year t is defined as (y it – yavi)/ yavi, were y it is the (trend) corrected yield and yavi is the (trend corrected) average 30-year yield for the partido. Yearly trend increase was assumed equal for all partidos (1.3 percent per year) – this figure is the average trend for all observations.. 18.
(10) ENSAYOS DE POLÍTICA ECONÓMICA – AÑO 2016 ISSN 2313-979X - Año X Vol. II Nro. 4. Table 1: Rainfall Index Insurance Contract -- 32 partidos Of the pradera pampeana (1980-2010 data) n. %. Total Number of Observations (partidos x years). 873. 100. Observations with yield loss> 20 %. 142. 16. Observations where indemnity is triggered. 57. 7. Average %. Maximum %. Yield Loss. 38. 91. Indemnity - Calculated over all years. 14. 80. Indemnity - Calculated over year sactually paid. 36. 80. The example shown here represents a case where (i) an important number of years with losses do not result in indemnity payment and (ii) indemnity paid averaged only over years actually paid (36 percent) is quite similar to overall average losses (38 percent). However, (i) and (ii) taken together imply (iii) average indemnity over all years (14 percent) is considerably lower than average losses over these years. The issue then is that indemnity – when paid – is on average quite similar to average losses, but that many years where losses occur do not trigger indemnity payments. One way of attacking this problem is to raise the threshold RT for indemnity to be triggered – a higher proportion of years would result in payments. However, it is also possible that even when increasing RT, a weak association will emerge between actual losses and indemnity payments. This would result if yield losses are caused by factors other than (conventionally measured) insufficient rainfall.. 19.
(11) Climate Variability and Agricultural Production in Argentina: The Role of Risk-transfer Mechanisms, pp. 11-38 Marcos Gallacher, Daniel Lema, Laura Gastaldi y Alejandro Galetto. Figure 1: Rainfall Index insurance - Indemnity payment as a function Of yield drop (%). 90. % Drop = % Indemnity. 80 70 60 50 40 30 % I ndemni typay ment. 20 10 - 100 - 90. - 80. - 70. - 60. - 50. - 40. - 30. 0 - 20 - 10 0 Yield drop (%). III.2. Rainfall index insurance: Pergamino case study This section explores the design of index insurance or soybean production in the central region of Argentina using detailed data for a specific site. The insurance coverage was designed according rainfall measure in the Meteorological Station of the National Institute for Agricultural Technology (INTA) in Pergamino (province of Buenos Aires) between July 1931 and June 2010. The choice of this time frame and location is based on the availability of climate information, the importance of the soybeans crop (57% of total area in 2006/2007), and the fact that according to farmers, the risk associated with changes in the amount and frequency of rainfall is perceived as a major problem in this zone for the coming next 10 years (Cabrini and Calcaterra, 2008). Also, this is an area where there is a high willingness to take crop insurance. For example, in 2006/2007 95% of the soybean acreage was insured against hail. The average coverage yield was 2.5 ton/ha (Cabrini and Calcaterra, 2008), and the observed average yield was 3.2 ton/ha (SAGPyA). For the design of the insurance coverage the following parameters were considered: • Climate Event: rainfall deficit. • Reference weather station: We used rainfall data from the weather station of INTAPergamino. The data cover the period July 1931 - June 2010 and presented the. 20.
(12) ENSAYOS DE POLÍTICA ECONÓMICA – AÑO 2016 ISSN 2313-979X - Año X Vol. II Nro. 4. following distribution: i) median: 943.10 mm per year; ii) quartile 1: 802.3 mm; iii) quartile 3: 1134.10 mm; iv) maximum: 2014.6 mm for the period July 2006-June 2007; v) minimum: 511.9 mm from July 1949 to June 1950. • Coverage Period (pc): Measured in days. During the pc period the event is liable to be compensated. The proposed coverage period - 21 December to 20 February - was specified considering the critical period of rainfall deficit for the crop. • Climate Index: Cumulative daily rainfall during the coverage period, expressed in millimeters (mmpc). • Trigger Index (mmd): The value of accumulated rainfall during the period of coverage, which activates compensatory mechanism. The 130 mm value was selected, so the insurance guarantees between 20 and 30% of water requirements of soybeans. • Exit Index (mms): Below this index value the compensation is 100%. Selected considering the minimum historical rainfall (50 mm) during the coverage period since 1931 to 2010. • Insured amount: The capital on which compensation is calculated. • Right to compensation: When mmpc< mmd • Amount of compensation (i). If mmpc ≥ mmd. compensation = 0%. If mmd >mmpc> mms. compensation = (mmd - mmpc) / (mmd – mms). If mmpc ≤ mms. compensation = 100%. • Recurrence interval Total years / number of compensations • Likelihood of compensation Number of compensations (years)/ Total years analyzed. Table 2 presents a synthesis of the insurance principal features. The trigger value was defined based on soybean water requirements in Pergamino. According to Andriani (2000) these values vary between 450 to 650 mm. The insurance thus would ensure that at least 20% to 30% of the rain requirements are recorded during the coverage period. If the measured rainfall level is lower, company insurance should pay. The proposal considers two ways to estimate indemnity: progressive (PP) and occurrence-severity (POS). The first indemnity mechanism (PP) is used in Ethiopia and other countries and indemnity. 21.
(13) Climate Variability and Agricultural Production in Argentina: The Role of Risk-transfer Mechanisms, pp. 11-38 Marcos Gallacher, Daniel Lema, Laura Gastaldi y Alejandro Galetto. vary between 0% (accumulated rainfall ≥ 130 mm) to 100% of sum insured (accumulated rainfall < 50 mm). The second mechanism (POS) was proponed in Gastaldi and others (2009). The POS mechanism has a fixed percentage to compensate event occurrence (25% of insurance sum) and the rest (75%) to compensate event severity.. Table 2: Insurance Characteristics and Definitions Concept Crop Insured capital Contract duration Risk insurance Sowing date Coverage period (pc ) Harvest date Climate index Weather Station Trigger index (mmd) Exit index(mm s). Parameters Soybeans (first occupation) Yield (ton) Yearly Drought 1st Week of November 21 December to 20 February Last Week of March Acumulated rainfall (mm) Pergamino – INTA 130 mm 50 mm. Historically, the proposed insurance should have paid 13 of 79 agricultural years and average payment probability was one every six years (see Table 3). The maximum payout would have been in 1942/1943, followed by 1961/1962. In the last 20 years (since 1980/1981), hypothetical insurance should have paid in 1982/1983 and 2008/2009, both periods with severe droughts and with yield loses as measured by the Ministry of Agriculture. Also, insurance would have triggered in periods as 1984/1985, 1987/1988 and 2007/2008 when yield were been normal. These “false strikes” or incorrect payouts are associated with soybean plasticity and adaptation to rainfall variability. The result is that insurance indemnities are paid in some periods despite yield being normal. In contrast, insurance did not result in indemnity in 1993/1994 and 1996/1997, periods when in fact there were yield losses. But, these losses were produced not by insufficient rainfall but by soybean stem canker (Wrather and others, 1997 and 1999b). The coverage assessment was done following the method proposed by Osgood and others (2007). The proposed methodology is a correlation analysis between the time series of hypothetical insurance claims with a series of yield losses of soybean crop. The series were constructed using actual data published by the Ministry of Agriculture of Argentina and simulated yield data using the software “Weather Index Insurance Educational Tool” (WIIET), developed by the International Research Institute for Climate and Society (IRI). This software contains a module to estimate crop water requirements (WRSI) and the results. 22.
(14) ENSAYOS DE POLÍTICA ECONÓMICA – AÑO 2016 ISSN 2313-979X - Año X Vol. II Nro. 4. were used as a proxy for yields. The estimated correlation was 30% for PS and 33% for POS using the Ministry of Agriculture yield data. The correlation associated with WRSI yields was 46% and 38% for PS and POS, respectively7. Estimated premium was 5.9% of insured capital for PP insurance and 8.5% for POS insurance. These premium rates are minimum values and were estimated based on historical rainfall since 1931 to 2010. However, taking into account that climate change has increased rainfall variability, it would be important to include additional climate information, climate forecasts and multivariate climate scenarios to assess the sensibility of estimated premium rates. Results from the analysis are promising, although as pointed out in some years rainfall levels may exceed the trigger level and yields can be nevertheless low due to diseases. In other years the scheme results in indemnity payments even when yields – due to the plasticity of the soybean plant - were normal. The basic problem then is the “basis risk” resulting from less than perfect correlation between the parameter used in the insurance contract (in this case rainfall) and farmer yields.. 7. Data series and yield estimates are not presented due to space limits, but are available on request to the authors.. 23.
(15) Climate Variability and Agricultural Production in Argentina: The Role of Risk-transfer Mechanisms, pp. 11-38 Marcos Gallacher, Daniel Lema, Laura Gastaldi y Alejandro Galetto. Table 3: Rainfall index in Pergamino Premiums and Payouts under different scenarios. Scenario First year. Scenarios for Rainfall 1 2 3 4 5 1931/'32 1960/'61 1980/'81 1990/'91 2000/'01. Last year. 2009/'10 2009/'10 2009/'10 2009/'10 2009/'10. N° of agricultural years. 79. 50. 30. 20. 10. Average rainfall 21 December-20 February (mm). 217. 227. 236. 245. 255. Rainfall CV. 45%. 44%. 43%. 42%. 52%. N° of payouts (years). 13. 7. 5. 2. 2. Average rainfall in payout years (mm). 101. 103. 116. 117. 117. Probability of payout Frequency of payout (years). 16% 6.1. 14% 7.1. 17% 6.0. 10% 10.0. 20% 5.0. Progressive payout scheme Maximum indemnity (% of insured capital) Agricultural year Average indemnity (% of insured capital) Pure premium (% of insured capital). 100% 76% 37% 17% 17% 1942/'43 1961/'62 1982/'83 2007/'08 2007/'08 35.8% 33.7% 17.4% 15.9% 15.9% 5.9% 4.7% 2.9% 1.6% 3.2%. Occurrence-severity payout scheme Maximum indemnity (% of insured capital) Agricultural year Average indemnity (% of insured capital) Pure premium (% of insured capital). 100% 82% 53% 38% 38% 1942/'43 1961/'62 1982/'83 2007/'08 2007/'08 51.8% 50.3% 38.1% 36.9% 36.9% 8.5% 7.0% 6.3% 3.7% 7.4%. III.3. Willingness to pay for index insurance The market analysis of a potential insurance product designed to transfer risk should consider answering the fundamental question: “Are potential buyers willing and able to pay the required premium for an agricultural insurance product?” (Saleem and others, 2008). Obviously, willingness to pay is a function of producer characteristics such as risk aversion, the climate variability, farm size and asset position and the ability to manage risk with other mechanisms. However, relatively few studies focus on the demand for index-based products. Two approaches have been used in these studies: Revealed Preference (RP) or Stated Preference. 24.
(16) ENSAYOS DE POLÍTICA ECONÓMICA – AÑO 2016 ISSN 2313-979X - Año X Vol. II Nro. 4. (SP). The first approach focuses on the observation of consumer behavior at the market to estimate his ex-post willingness to pay. The main assumption is that the information comes from a real fact, a market transaction. The second approach is an alternative that can be used to estimate ex ante willingness to pay for products not available yet in the market using hypothetical data. The RP approach uses revealed preference concept in estimating latent demand for hypothetical insurance. Gautam and others (1994), for example, use two-year panel data to examine the efficiency of drought management strategies used by peasants in India. They find evidence of market viable latent demand for drought insurance in the region. The same approach was utilized in Burkina Faso by Sakurai and Reardon (1997), who find that farmer’s perceived probabilities of droughts and the size of cultivated area have positive impacts on insurance demand, while off-farm income and availability of public and private assistance have negative impacts on insurance demand. The SP approach implies application of field survey studies and experiment in eliciting insurance demand. The common approach, which is also widely used to estimate the value of goods and services that are not traded in the marketplace, is the contingent valuation (CV) method, in which survey questions elicit respondents’ willingness to pay (Mitchell and Carson 1989, Carson and Hanemann 2005, Alberini and Kahn 2006). A relatively small literature applies CV methods to study WTP for agricultural insurance. Patrick (1988) and Vandeveer and Loehman (1994) use a single dichotomous (yes/no) choice question to study producers’ demand for a multiple peril crop insurance, rainfall insurance and other modifications of crop insurance. McCarthy (2003) and Sarris and others (2006) use similar single CV question to study pattern of demand for rainfall insurance in Morocco and Tanzania, respectively. Chantarat, et al (2009) use CV to study index based livestock insurance in Kenya. For the United States, Saalem and others (2008) estimate willingness to pay for different coverage levels in trout production. The CV method is known as hypothetic method because of the way researchers obtain the economic value individuals assign to a good. The standard procedure consists of designing a survey which describes the good characteristics. It directly gives the good valuation and it is compatible with Hicksian welfare measures. In our case, it is the compensating variation or the willingness to pay (WTP) for a welfare gain. The dichotomous or discrete choice format introduced by Bishop and Heberlein (1979) has great acceptance because it only requires responding yes/no in relation with a given payment “A” instead of an exact estimation of the monetary value consumer would be willing to pay. This format is known as “referendum” or “close ended” question with a given value or bid price. It induces more honestly revelation of preferences. However, CV method introduces issues not easily solved such as the optimal sample size for the valuation experiment, the bid values range and the “right” model specification. As the dependent variable has a discrete format, it takes 1 value if the individual is willing to pay the price “A” suggested in the survey and it takes zero value if not. The regression errors are generally assumed to be normal or logistic distributed and estimation procedure is probit or logit respectively.. 25.
(17) Climate Variability and Agricultural Production in Argentina: The Role of Risk-transfer Mechanisms, pp. 11-38 Marcos Gallacher, Daniel Lema, Laura Gastaldi y Alejandro Galetto. Hanemann (1984) and Cameron and James (1987) developed theoretical frameworks to estimate welfare changes compatible with the CV method. Hanemann´s original idea is known as the indirect utility difference model –supported by McFadden random utility framework- while Cameron’s idea is the expenditure difference model to estimate a random WTP. The goal of estimating parametric models from dichotomous choice CV responses is to calculate willingness to pay for the good described. In addition, parametric models allow for the incorporation of respondent characteristics into the willingness to pay functions. This allows learning about the influence of individual preferences or characteristics influence on WTP (the covariate effects). An important methodological question arises from the consistency between statistical and economic assumptions and the choice models selected. Bounds on WTP can be implemented in two ways. One is to estimate an unconstrained model and to truncate the final welfare measure at the calculation stage. The second approach is to estimate a model with the right bounds from the beginning. According with Haab and McConnell (2002), a direct way to achieve this using Cameron’s approach is to specify the following model:. WTPj G ( z j j ) y j (1) Where, 0 G( z j j ) 1 ;. G '( z j j ) 0 And j =1,..,n. Each j individual WTP is a proportion of income (y) and G is a function of an n dimensional vector (z) of characteristics and choice influences. A recommended version of this formulation is:. WTPj . 26. yj 1 exp( z ). (2).
(18) ENSAYOS DE POLÍTICA ECONÓMICA – AÑO 2016 ISSN 2313-979X - Año X Vol. II Nro. 4. If the probability that the jth individual responds yes to the question about his willingness to pay $A for a gain in welfare – a new product - is given for the following expression:. 1. y A Pr( yes) 1 FWTP ( A) 1 exp ( z j ln( j )) / (3) A . The literature has focused on two measures of central tendency (the mean and median of the WTP distribution) to evaluate the change between the initial and final situation for the population. The first is equivalent to apply the Kaldor-Hicks compensating criteria because the mean is positive if the positive values more than compensate the negative values in the distribution. In turn, the median is equivalent to applying the majority criterion: the change is desirable if most of population votes for it. The dichotomous choice or referendum-style approach represents the usual method for contingent valuation implementation. In order to get an unbiased estimate of WTP it is necessary to know whether an individual does not want to pay a particular premium because of the premium itself or simply because the individual does not want to buy the good at any price. Following the approach of Hite, Hudson, and Intarapapong (2002) our surveys contained a follow-up question. Individuals who refused to pay the stated premium where asked: “Would you pay any positive amount?” This follow up maintains the single bounded nature of the question but allows differentiation between positive WTP responses from zero (or negative) WTP responses. For the WTP study case we use a single-price contingent valuation instrument to examine mean willingness to pay, as well as the factors that influence individual willingness to pay, for index insurance for soybean production in Argentina. We conducted a survey in the pradera pampeana region of Argentina. The survey area is North-west of the province of Buenos Aires (Leandro N. Alem, Lincoln, Chacabuco, Junin, Trenque Lauquen, Pergamino, Rojas) and south-west of the province of Santa Fe (General Lopez). To conduct the survey we contracted with local operators and extension agents who select the participants using a quota system to guarantee that the sample represented the appropriate farm size population. The final survey data contains productive and socioeconomic characteristics of 200 soybean producers. A hypothetical insurance scheme was proposed to the farmers to investigate the WTP. To avoid moral hazard and adverse selection problems the idea is to use an objectively measured index. Specifically, a crop yield insurance scheme assessed over a local area for soybeans was proposed to the producers. It is not easy to choose between an index based on crop yields (as used in this survey) and one based on a climate (e.g. rainfall) variable. Advantages and disadvantages are. 27.
(19) Climate Variability and Agricultural Production in Argentina: The Role of Risk-transfer Mechanisms, pp. 11-38 Marcos Gallacher, Daniel Lema, Laura Gastaldi y Alejandro Galetto. associated with both. At the beginning of this section we analyzed the performance of an (albeit crude) rainfall-index insurance scheme in the pradera pampeana, concluding that additional “fine tuning” is necessary for the rainfall index to be reasonably correlated with losses incurred at the farm level. We chose here for the WTP evaluation a yield index, under the assumption that farmers will find it easier to understand a contract based on area yield, than one based on rainfall. Indeed, while farmers have a keen appreciation of the impact of climate on yields, few have had the opportunity to analyze the relationship between specific values of rainfall and resulting yields8. Each respondent of the survey was given an explanation about the proposed yield index insurance scheme and the costs of the hypothetical product. The explanation was as follows:. Suppose that a company offers an insurance product based on an index of local yields with the following characteristics: If at the end of the crop season the soybean index yield in the County (or local area) is less than XX kg / ha, the insurance company pays an indemnity. Compensation shall be calculated as the difference between XX kg / ha and the final average yield obtained in the area. The average yield in the area is measured from an index built with objective information. If the index is below the pre-agreed value insurance is automatically triggered. It is important to understand that compensation is paid and triggered by the index value without checking the actual damage in the individual field. That is, you can collect the insurance and no loss of production and vice versa. (the XX value was randomly assigned with variation over a specific interval for each region/zone) We estimate the WTP for the insurance product using the results of the two survey questions presented below. Q1: In the above example, would you be willing to purchase the insurance if the premium is XX kg per insured hectare? (Different pre-specified premiums were randomly asked by region/ zone. See Table 4) Q2:. If your answer to Q1 is NO, would you be willing to pay any amount for this policy?. 8. That is, it may be difficult for a given farmer to understand and assess the risk-reducing impact of a contract that offers to pay an indemnity of x if rainfall falls below y.. 28.
(20) ENSAYOS DE POLÍTICA ECONÓMICA – AÑO 2016 ISSN 2313-979X - Año X Vol. II Nro. 4. Table 4. Proposed Premiums by Region (soybean kg/hectare) Partido/Departamento. 1. 2. 3. PERGAMINO. 100. 140. 180. CHACABUCO. 120. 170. 220. JUNIN. 110. 150. 200. LINCOLN. 140. 200. 250. LEANDRO N.ALEM. 100. 140. 180. TRENQUE LAUQUEN. 140. 200. 250. ROJAS. 120. 170. 220. SAN GREGORIO (GRAL LOPEZ, STA FE). 100. 140. 180. An answer to question 1 in the affirmative implies that the pre-specified premium rate is the lower bound of the distribution of the WTP, while infinity marks the upper bound. Question 2 serves as a follow-up question in the event of a negative response to question 1. An affirmative response to question 2 indicates that zero represents the lower bound and the pre-specified premium rate represents the upper bound. However a negative answer to question 3 means the lower bound of the distribution is negative infinity and the upper bound is zero. III.4. Estimation Methodology We use a probit model with sample selection (Van den Ven and van Praag, 1981) to estimate mean WTP from the survey data. Choosing to pay for a potential index based insurance product (at the specific coverage and asked premium rate expressed in soybeans kg/hectare) is contingent on whether an individual wants to buy the index insurance in the first place. Given the specific characteristics of the index insurance it is likely that some individuals do not want to buy index based insurance at any price. Thus, individuals who stated that they did not want to buy index insurance at any price (i.e. that responded “No” to the follow-up question) could be classified as non-users of insurance. The probit model with selection has the following structure:. Y1i* = X1iβ1 + 1i Y2i* = X2iβ2 + 2i. 29.
(21) Climate Variability and Agricultural Production in Argentina: The Role of Risk-transfer Mechanisms, pp. 11-38 Marcos Gallacher, Daniel Lema, Laura Gastaldi y Alejandro Galetto. Where Y2i*is the utility function of an individual reflecting one´s overall attitude towards an index based insurance (signified by a “No” response to buying insurance at any price) and Y1i* is the utility difference between buying the index insurance at the suggested price and not buying. X1i and X2iare the respective vectors of covariates for individual (i)9, β´s are the associated coefficient parameters andj´s are respective error terms. Yji*and Yji are associated in the following manner:. 1 if Y*ji ≥ 0 For every individual (i), Yji=. for j= 1, 2 0 if Y*ji< 0. However, Y1iis observed only if Y2i =1.. The second probit equation is based on the complete sample and the first probit equation is based on a selected (or censored) sample. The use of the selection model helps to dissociate the types of consumers (potential buyers and non-buyers of insurance at any price) and rectify the potential selection bias. We fit the following joint maximum-likelihood function (Van den Ven and van Praag, 1981) to estimate the model:. N1. N2. N3. i 1. i N 11. i N 21. 2 (1' X 1i , 2' X 2i ; ). 2 (1' X 1i , 2' X 2i ; ). ( 2' X 2i ). Where observations 1…N1 are respondents willing to pay the stated premium rate, observations N1+1…N2 are respondents not willing to pay the stated premium rate but willing to pay some lower price and observations N2+1…N3 are “No”, “No” respondents, 2(.) is CDF of a bivariate normal, is CDF of univariate normal distribution and correlation between 1i and 2i. Estimation was done using the Heckprob procedure in Stata version 10. Mean WTP was calculated using the method for a lineal utility function described in Haab and McConnell (2002).. 9. Table 5 presents the definition of variables used as controls in the econometric estimation.. 30.
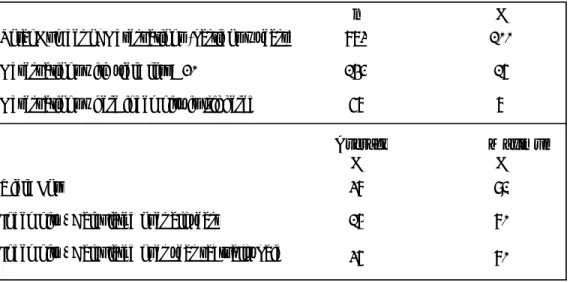
(22) ENSAYOS DE POLÍTICA ECONÓMICA – AÑO 2016 ISSN 2313-979X - Año X Vol. II Nro. 4. Table 5 presents definitions and variables used in estimations. Table 6 present the estimated coefficients of the probit models with selection correction. Table 7 presents the mean WTP values based in the estimated coefficients, conditioning by zone and fixing the independent variables at the mean. Average WTP is calculated in soybeans kg/hectare and can be interpreted as the premium for insuring a farm yield equivalent to the 60% of the average yield in the region. As a reference, the average yield for early season soybeans is3.0 t/hectare in Argentina. Following the estimates of Table 7, the WTP for an index insurance of 60% of the average regional yield is approximately 6.30%of the average yield per hectare (189/3000). Findings of the estimates include the following: 1. Demand for insurance is negatively sloped – higher premiums result in less insurance being demanded. This result is as expected, however in surveys such as this it is not implausible to obtain non-significant results as regards to the price variable. 2. WTP varies across production areas. For example, WTP is higher for the partidos of Lincoln and Trenque Lauquen. This is as expected, as these are located in a “mixed” farming area, a-priori riskier than the “central” production area of the country. 4. Production risk, as measured by yield CV10 (control variable cvsoy) has “correct” (and significant) sign. 5. The planted area, age and education variables are not significant. We can conclude from our estimates that insurance is a relevant option for the transfer of risk; however, research aimed at analyzing constraints for the development of the insurance market has been practically non-existent. We analyze possible demand for index-insurance products in soybean production in Argentina and our WTP survey and estimation results shows potential for the development of the market. However, market-making will probably require substantial public investment in climate and yield data, as well as improved knowhow on the practical aspects of insurance delivery. Close cooperation between the public and the private sector appears to be necessary for growth of the insurance market. In particular, the “heavy artillery” of the public sector as relates to climate and agronomic yield research needs to be combined with the agility and problem identification capacity of private sector firms. Indeed, know-how gained by these firms in marketing conventional insurance products can help the introduction of new, index-type policies. Although insurance has the potential for improving risk management, in the area studied here many other options exist for the reduction or transfer of risk. Multiple cropping systems, improved capital flows into agriculture, non-farm income and other alternatives compete directly with insurance as risk management tools. A “systems” or “holistic” approach to risk analysis therefore seems called for.. 10. The yield CV was obtained from a triangular distribution. Respondents of the survey were asked to estimate the minimum, maximum and most likely value of soybeans yields expected in the farm, and from this subjective assessment the triangular distribution was calculated.. 31.
(23) Climate Variability and Agricultural Production in Argentina: The Role of Risk-transfer Mechanisms, pp. 11-38 Marcos Gallacher, Daniel Lema, Laura Gastaldi y Alejandro Galetto. Table 5: Definition of Variables. Variable WTP Premium cvsoy Age Edu. Definition Dummy variable (Yes=1) Premium (kg/ha) Coefficient of Variability of Soybean yields (from individual subjective assessment) Age of the farmer (years) Education. Maximum level attained 1=primary school; 2=high school;3=college degree Dummy Variable (Zone 1=1). Z1. Argentina: Pergamino- Chacabuco- Junín- Rojas. Dummy Variable (Zone 2=1) Z2. Argentina: Alem – General Lopez. Dummy Variable (Zone 3=1) Z3 Selection. Argentina: Lincoln- Trenque Lauquen Dummy Variable (0 if “No” in response to Q1 and “No” in response to Q2. 1 otherwise) Area under soybean cultivation. area. 2009- 2010 (thousand of ha). Risk. Willingness to take financial risks in a 1 to 5 scale. 1=highly unwilling; 5= highly willing. female. Dummy Variable (1 if female and 1 otherwise). inc agins area. 32. Dummy variable. 1 if 80% or more of total income is from farming activities and 0 otherwise Dummy variable. 1 if the farmer uses agricultural insurance and 0 otherwise Total area of the farm (thousands of ha).
(24) ENSAYOS DE POLÍTICA ECONÓMICA – AÑO 2016 ISSN 2313-979X - Año X Vol. II Nro. 4. Table 6: Coefficient estimates. Probit model with selection Soybean Variable. Coefficient. RobustStd. Error. P>|z|. WTP premium z1 z2 Cv Areasoy Age Educ _cons. -0.018*** -0.986*** -1.575*** -2.550* -0.189 -0.001 0.016 4.939***. 0.003 0.256 0.258 1.515 0.119 0.007 0.157 0.749. 0.00 0.00 0.00 0.09 0.11 0.79 0.91 0.00. 0.024 -0.455 -0.093 -0.001 0.163 0.277 1.570*** 0.193** -0.032* 2.941 -1.711 -1. 0.339 0.345 0.258 0.008 0.202 0.265 0.225 0.080 0.018 2.423 1.032 0.000. 0.940 0.190 0.720 0.880 0.420 0.300 0.000 0.020 0.080 0.230 0.430. Selection z1 z2 Female Age Educ Inc Agins risk Area Cv _cons Observations CensoredObs. Non CensoredObs. Log likelihood. 199 37 162 -150.82. Wald test (r = 0). Prob> chi2 = 0.00. Waldchi2(7) chi2(1) =. 35.22. Prob> chi2 = 0.00. ***Significant at 1%; **Significant at 5%; *Significant at 10%. Table 7: WTP (Mean). Soybean yield insurance. Zone. WTP (kg/ha). Zone 1. 184. Zone 2. 151. Zone 3. 240. Mean (Average Zone). 189. 33.
(25) Climate Variability and Agricultural Production in Argentina: The Role of Risk-transfer Mechanisms, pp. 11-38 Marcos Gallacher, Daniel Lema, Laura Gastaldi y Alejandro Galetto. IV. Conclusions Agricultural production is of primary importance in Argentina, not only does it contribute to a major part of export earnings, it also supplies practically the total food consumed by the population of the country. The agricultural and agribusiness sector, moreover, accounts for a significant portion of total employment. Our research focuses on the value of the use of risk transfer mechanisms, in particular index insurance products, in agricultural production. In many Latin American countries, poor functioning of financial markets limit the possibilities of smoothing inter-year income variability. Futures and options markets - of major importance both for price forecasting as well as for the transfer of risk - are insufficiently developed. In these countries production variability of grain and oilseeds translates directly into farm-level income variability. Production risk may have impacts beyond the farm gates. The fortunes of rural areas are partially “tied” to what happens in farms. This paper has shown that production risk is a factor to be taken into account when analyzing the agricultural sector. Despite its importance, not much is known about risk and its impacts on resource allocation, efficiency and welfare in rural areas. Insurance is an important mechanism for risk-transfer that has grown significantly during the last years; however the majority of insurance policies base indemnity payments on damage assessment at the individual farm level. Index or “parametric” insurance is non-existent. The research shows evidence that insurance policies based on area-wide indexes are valued by farmers: WTP results from questionnaires are in principle sufficiently high so as to merit further attention on the part of policy makers, producer organizations and researchers. WTP derived from questionnaires have obviously to be taken with a “grain of salt” as they result from answers to hypothetical questions and not actual choices revealed in the market. For the soybean study case a yield insurance scheme was proposed to the producers. To avoid moral hazard and adverse selection problems the idea is to use some more objectively measured index that is less subject to the influence of the insured. One such index is crop yield assessed over a local area so as to avoid the moral hazards of insuring yields on an individual farm or field basis. WTP may be expressed as a fraction of “expected yield”: for early-season soybeans our estimates are 2.8 t/hectare. WTP, varies across production areas; for example is higher for the partidos of Lincoln and Trenque Lauquen. This is as expected, as these are located in a “mixed” farming area, a-priori riskier than the “central” production area of the country (also, in these partidos expected indemnities are higher). Summarizing our soybean results, a comparison of WTP and expected indemnities suggests possible opportunities for risk-transfer via insurance. Our data base allows additional analysis that will further illuminate this issue. Most of the existing agricultural insurance systems in the world are heavily subsidized. Abundant research exists on this topic in many countries. The challenge of course is to provide some guidelines for an insurance program to cope with agricultural risk that is able to “stand on its own” in the sense that public participation is limited to aspects such: 1. Producing basic information used for insurance contracts (weather and yield data, soil types, farm numbers, planted area etc.) 34.
(26) ENSAYOS DE POLÍTICA ECONÓMICA – AÑO 2016 ISSN 2313-979X - Año X Vol. II Nro. 4. 2. Providing specialized scientific and technical support 3. Acting as a facilitator or coordinator of activities of different parties, 4. Acting as a liaison with institution in other countries that can transfer their experience. For example, the FAO, the World Bank, USDA, IFPRI, Agriculture Canada and others. 5. Providing know-how for the setting up of private mechanisms for mediation and conflict resolution 6. Proposing changes in legislation related to agricultural insurance 7. In limited cases, helping insurance companies to reach agreements with reinsurers. 35.
(27) Climate Variability and Agricultural Production in Argentina: The Role of Risk-transfer Mechanisms, pp. 11-38 Marcos Gallacher, Daniel Lema, Laura Gastaldi y Alejandro Galetto. V. References Agromercado, various issues. Aiken, R., Lamm, F., & Aboukheira, A. A. (2011, February). Water use of oilseed crops. In Proceedings of the 23rd annual central plains irrigation conference (pp. 181-189). Alberini, A. and J.R. Kahn. (2006). Chapter 20, Handbook on Contingent Valuation, Edward Elgar, Northampton, MA. Anderson, J.R. (1979), Impact of climatic variability in Australian agriculture: a review. Review of Marketing and Agricultural Economics 47(3): 147-177. Anderson, J.R., J.L. Dillon and J.B. Hardaker (1977), Agricultural Decision Analysis. Iowa State Univ. Press. Andrade, F.H. and V.O. Sadras (2000) Efectos de la sequía sobre el crecimiento y rendimiento de los cultivos. En: Andrade, F.H. and V.O. Sadras, editores, Bases para el manejo del maíz, el girasol y las soja. EEA INTA Balcarce. Argentina. Andriani J. (2002). Estrés hídrico en soja. Revista IDIA XXI: N°3, pp. 48-51 Bishop, R and Heberlein, T (1979) Measuring Values of Extramarket Goods: Are Indirect Measures Biased? American Journal of Agricultural Economics, 61(5), pp. 926-930. Cabrini, S. and C. Calcaterra (2008). Los Sistemas de Producción en la Cuenca del Arroyo Pergamino. Resultados de una Encuesta a Productores. Centro Regional Buenos Aires Norte, Estación Experimental Agropecuaria Pergamino “Ing. Agr. Walter Kugler”. Ediciones INTA. Cameron, T and James, M. (1987). Cameron, T. A., & James, M. D. (1987). Efficient estimation methods for "closed-ended" contingent valuation surveys. The review of economics and statistics, 69 (2), pp. 269-276. Carson, Richard T. and Hanemann, Michael W. (2006) Contingent Valuation. Chapter 17 in Karl-Gran Mler and Jeffrey R. Vincent Handbook of Environmental Economics Volume 2, Valuing Environmental Changes Edited, Elsevier North Holland. Chantarat, Mude, A. and Barrett C. (2009). Willingness to pay for index based livestock insurance: results from a field experiment in northern Kenya. Working Paper Index Based Livestock Insurance. Chen, G., Roberts, M. C. and Thraen, C., (2004). Weather derivatives in the presence of index & geographical basis risk: hedging dairy profit risk. Paper presented at the NCR-134 conference on applied commodity price analysis, forecasting, and market risk management, St. Louis, Missouri. Deng, X., Barnett, B., Vedenov, D. and West, J. (2007). Hedging dairy production losses using weather-based index insurance. Agricultural Economics 36(2), pp. 271-280.. 36.
(28) ENSAYOS DE POLÍTICA ECONÓMICA – AÑO 2016 ISSN 2313-979X - Año X Vol. II Nro. 4. Gastaldi L, Osgood D, Podestá and Lema, D. (2011). Seguro basado en índice climático para la producción de soja en Argentina. Paper presented at 2011 AAEA Conference. In press Gastaldi, L., A. Galetto and D. Lema (2009). El seguro como herramienta para la administración del riesgo climático en empresas tamberas del norte de Santa Fe, Argentina. Revista Argentina de Economía Agraria. Vol. XI No.1:5:28. Gautam, M., Hazell, P. & Alderman, H. (1994). Rural demand for drought insurance. World Bank, Policy Research Working Paper No. 1383. Haab, T. and McConnell, K. (2002). Valuing Environmental and Natural Resources. The Econometrics of non-market valuation. Edward Elgar Publishing. UK. Hanneman, W.M. (1984), Welfare evaluations in contingent valuation experiments with discrete responses. American Journal of Agricultural Economics, 66(3), pp. 332-341. Hite, D. Hudson, D., Intarapapong, W. (2002). Willingness to pay for precision application technology: the case of Mississippi. Journal of Agricultural and Resource Economics 27, pp. 433-449. Kealy, M.J., M. Montgomery and J.F. Dovidio (1990). Reliability and predictive validity of contingent values: does the nature of the good matter? Journal of environmental economics and Management, 19, pp. 244-263. Mahul, O. (2001). Optimal insurance against climatic experience. Agricultural & Applied Economics Association, 83:593–604 Martin, S., Barnett, B., & Coble, K. (2001). Developing and Pricing Precipitation Insurance. Journal of Agricultural and Resource Economics, 26(1), 261-274. McCarthy, N. (2003). Demand for rainfall index-based insurance: A case study from Morocco. International Food Policy Research Institute, EPTD Discussion Paper 106 Mitchell, R.C. and R.T. Carson (1989), Using surveys to value public goods: the contingent valuation method. Resources for the Future. Washington DC. Osgood, D.E, McLaurin, M. Carriquiry, M., Mishra, A., Fiondella, F., Hansen, J., Peterson, N., and Ward,N. (2007). Designing Weather Insurance Contracts for Farmers in Malawi, Tanzania, and Kenya: Final Report to the Commodity Risk Management Group, ARD, World Bank. International Research Institute for Climate and Society (IRI), Columbia University, New York, USA. Patrick, J.F. (1988). Mallee wheat farmers’ demand for crop and rainfall insurance. Australian Journal of Agricultural Economics, 32(1), pp. 37 – 49. Richards, Timothy, J., Manfredo Mark, R. and Sanders Dwight R. (2004). Pricing Weather Derivatives. American Journal of Agricultural Economics, 86(4), pp. 1005–1017 Sakurai, T., & Reardon, T. (1997). Potential demand for drought insurance in Burkina Faso and its determinants. American Journal of Agricultural Economics, 79(4), pp. 11931207. 37.
(29) Climate Variability and Agricultural Production in Argentina: The Role of Risk-transfer Mechanisms, pp. 11-38 Marcos Gallacher, Daniel Lema, Laura Gastaldi y Alejandro Galetto. Saleem Shaik, Keith H. Coble, Darren Hudson, James C. Miller, Terrill R. Hanson, and Stephen H. Sempier. (2008). Willingness to Pay for a Potential Insurance Policy: Case Study of Trout Aquaculture. Agricultural and Resource Economics Review, 37(1), pp. 41–50 Sarris, A., Karfakis, P. and L. Christiaensen. (2006). Producer demand and welfare benefits of rainfall insurance in Tanzania. FAO Commodity and Trade Policy Research Working Paper, 18. Skees, J., et al., (2001). Developing Rainfall-Based index Insurance in Morocco. World Bank Policy Research Working Paper 2577, World Bank, Washington, DC. Turvey, C. (2001). Weather Derivatives for Specific Event Risks in Agriculture. Review of Agricultural Economics, 23(2), pp. 333-351. Van den Ven W., van Praag, B. (1981). The demand for deductibles in private health insurance: a probit model with simple selection. Journal of Econometrics, 17, pp. 229-252. Vandeveer, M. L. & Loehman, E. T. (1994). Farmer response to modified crop insurance: a case study of corn in Indiana. American Journal of Agricultural Economics, 76(1), pp. 128-140. Varangis, P., J. Skees y B. Barnett (2002). Weather Indexes for Developing Countries. World Bank, University of Kentucky and University of Georgia. Vedenov, D. and Barnett, B. (2004). Efficiency of Weather Derivatives as Primary Crop Insurance Instruments. Journal of Agricultural and Resource Economics, 29(3), pp. 387-403. Wrather J. A., Anderson, T. R., Arsyad, D. M., Gai, J., Ploper, L. D., Porta-Puglia, A., Ram, H. H., and Yorinori, J. T. (1997). Soybean disease loss estimates for the top 10 soybean producing countries in 1994. Plant Disease, 81(1), pp. 107-110 Wrather J.A., Anderson T.R., Arsyad D.M., Gay J., Ploder L.D., Porta-Puglia A., Ram H. Hand Yorinori J.T. (1999). Soybean disease loss estimates for the top ten soybean producing countries in 1998. Canadian Journal of Plant Pathology, 23(2), 115-121.. 38.
(30)
Figure


+2

Documento similar
Although some public journalism schools aim for greater social diversity in their student selection, as in the case of the Institute of Journalism of Bordeaux, it should be
In the “big picture” perspective of the recent years that we have described in Brazil, Spain, Portugal and Puerto Rico there are some similarities and important differences,
The paper is structured as follows: In the next section, we briefly characterize the production technology and present the definition of the ML index as the geometric mean of
Keywords: Metal mining conflicts, political ecology, politics of scale, environmental justice movement, social multi-criteria evaluation, consultations, Latin
In the previous sections we have shown how astronomical alignments and solar hierophanies – with a common interest in the solstices − were substantiated in the
Given the much higher efficiencies for solar H 2 -generation from water achieved at tandem PEC/PV devices ( > 10% solar-to-H 2 energy efficiency under simulated sunlight) compared
Díaz Soto has raised the point about banning religious garb in the ―public space.‖ He states, ―for example, in most Spanish public Universities, there is a Catholic chapel
In the preparation of this report, the Venice Commission has relied on the comments of its rapporteurs; its recently adopted Report on Respect for Democracy, Human Rights and the Rule
