Differences in knee sensorimotor control by physical activity level and sex
7
0
0
Texto completo
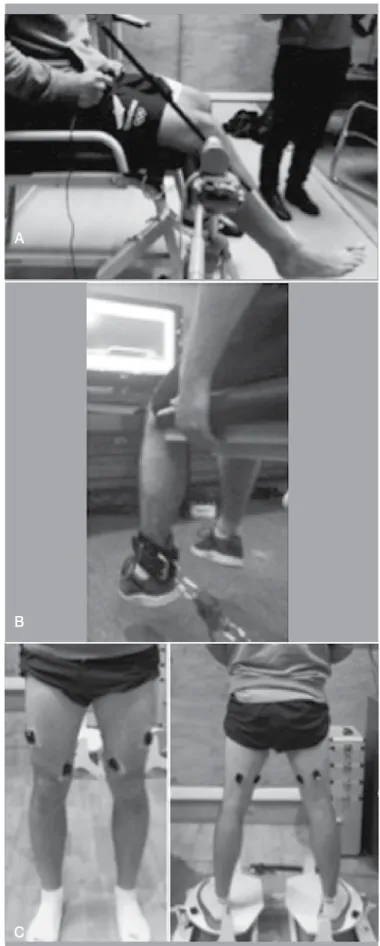
(2) sense (JPS), steadiness and onset of muscle activation, relating them to level of physical activity, gender and differences between the two extremities. MATERIALS AND METHOD Subjects The sample is composed of 51 voluntary healthy subjects; 27 men (24,27 ± 3,28 years; 1,76 ± 0,06 m; 75,91 ± 8,54 Kg) and 24 women (24,67 ± 3,53 years; 1,64 ± 0,06 m; 58,71 ± 8,73 Kg), with a level of physical activity with a score of 2 to 8 on the Tegner´s scale.5 Each one of the participants signed an informed consent previous to the assessments that were performed. This study was approved by the bioethics committee of the Pontificia Universidad Católica de Chile (Protocol number 14-146). Outcomes Measurement. A. JPS Test The aim of this test was to evaluate JPS, the ability of subjects to actively replicate a previously determined joint position. A uniaxial electrogoniometer (Kinectecnic Ltda, Santiago, Chile) for the measurement of the knee articular angle in 3 ranges of motion was used: 90º – 60º, 60º – 30º y 30º – 0º (Figure 1A). The subject was in sitting position with their knees initially in 90° of flexion. In each repetition the difference between the angle reached by the subject and the target angle is calculated by averaging the difference of 10 repetitions for each angle and extremity. For signal processing, the Igor Pro 6.0 (WaveMetrics Inc, Lake Oswego, USA) program was used. Steadiness. Sensation of muscle tension The purpose of this assessment was to evaluate the ability of subjects to maintain a constant force at 15% of maximum voluntary isometric contraction, which reflects fine muscle control.6 First, the maximum voluntary isometric contraction (MVIC) was assessed. The patient was sitting with a knee flexion angle of approximately 90º anchoring to the distal end of the leg a load cell where the subjects were asked to perform a maximum isometric voluntary contraction of the extensor muscles of the knee. This was measured using an S beam load cell (Interface, Arizona, USA). The signal was captured using a Trigno Wireless System (Delsys, Boston, USA) with a sampling frequency of 2000 Hz. Knee isometric steadiness was evaluated with the same setup as the MVIC assessment. Each subject was asked to exert knee extensor force to reach a specific target, a trapezoidal figure which represented the 15% of their MVIC (Figure 1B). Subjects were asked to reproduce this paradigm that lasted 20 seconds. To quantify fine muscular control, the coefficient of variation was calculated between the paradigm displayed on the screen and the exerted force of the the subject. B. Onset of Muscle Activation The onset of muscle activation in the knee muscles was estimated utilizing surface electromyography, a method that was previously used in other studies.7 EMG bipolar sensors (Delsys, Boston, USA) were positioned on the vastus medialis, vastus lateralis, semitendinosus, and biceps femoris muscles of each subject according to SENIAM recommendations.8 The subjects were ask to stand over two destabilizing platforms (Figure 1C). A sudden fall of the platforms causes 20° of inversion at the ankle in a weight-bearing condition. The drop of the platforms was captured with a triaxial accelerometer, which was synchronized with sEMG signals. Both signals were sampled at 2000 hz. Activation latency for each muscle was calculated as delta time between the onset of acceleration during perturbation and onset of muscle activation. Acta Ortop Bras. 2019;27(1):20-6. C Figure 1. (A) Shows the joint position sense test with the uniaxial electrogoniometer. (B) Shows the steadiness test with the load cell and the paradigm to 15% of the MVIC. (C) Shows the knee muscle onset test with the position of the sEMG sensors and the platform.. 21.
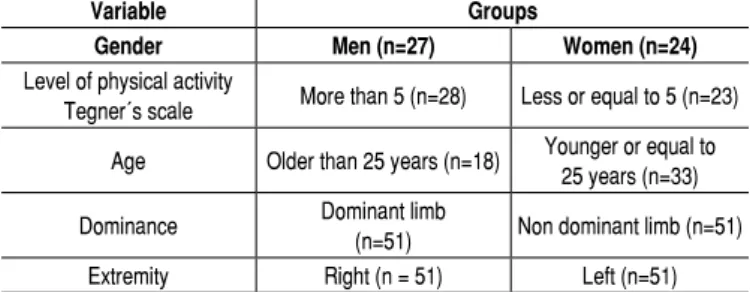
(3) Each one of the assessments was performed on both extremities in all subjects. In order to make comparisons, subjects were divided into different groups depending on their individual characteristics (Table 1). In all assessments, each of the data obtained between the different groups was compared. Statistical analysis To evaluate the normal distribution of the data the Shapiro-Wilk test was used. The difference mean test was used in the case of data with normal distribution and the signed rank Wilcoxon test otherwise. A statistically significant result was considered when the p value was less than or equal to 0.05. STATA 9.1 software was used for the statistical analysis. For the different measured tests (JPS, Steadiness and onset of muscle activation) gender differences, differences between groups with different levels of physical activity, differences between the dominant and non-dominant limb, and differences between right versus left limb of the same subject were compared. RESULTS JPS Test A significant difference was found between men and women in the knee JPS test at 90º-60° (p=0,0127) and at 30º-0° (p=0,0034) when comparing the right extremities of both genders (Figure 2 A). When comparing left extremities a significant difference was found in the range of 60º-90° (p=0,0034) (Figure 2 B). In both comparisons men had better results. The group with higher level of physical activity had significantly better values in at 90º-60° (p=0,0328) in the right limb and 30º-0° (p=0,0173) in the left limb compared with the group that performed a lower level of physical activity (Figure 2 C and 2 D). No significant differences were found when comparing the dominant limb with the non dominant limb, however the results showed that the left limb showed better results in JPS at 60º-30° (p = 0.0048) (Figure 2 E). (Table 2 A, B) Steadiness Women had significant better values compared to men in the right (p=0,0002) and left limb (p=0,0009), (Figure 3 A). The group with higher level of physical activity had significant better values in right steadiness (p=0,0065) and left (p=0,0173) compared to the group that performed a lower level of physical activity (Figure 3 B). (Table 3 A, B) Onset of Muscle Activation The left limb showed better results in the timing of muscle onset for vastus medialis (p = 0.0466) when compared with the right leg. (Figure 4 E). (Table 4 A, B) Table 1. Mean +/- (standard deviation) of demographic data for subjects who complete the 3 evaluations. Variable Groups Gender Men (n=27) Women (n=24) Level of physical activity More than 5 (n=28) Less or equal to 5 (n=23) Tegner´s scale Younger or equal to Age Older than 25 years (n=18) 25 years (n=33) Dominant limb Dominance Non dominant limb (n=51) (n=51) Extremity Right (n = 51) Left (n=51) Information of each group in which subjects were divided to make comparisons of each evaluation. n = number of subjects per category.. 22. DISCUSSION JPS Test Previous studies have demonstrated significant differences between men and women when comparing knee proprioception.3,9 In these studies women present reduce proprioception ability, which is consistent with the data obtained in our study where worse values in joint repositioning are shown in the female population in the most extreme measurement ranges (90º-60º y 30º-0º). A possible explanation for this is that women have greater articular laxity, so capsuloligamentous receptors would need a greater stimulus to trigger a response equal to that of men.1 Men also have a higher proportion of muscle mass, which could provide them with more quantity of musculotendinous proprioceptive receptors. Subjects with a lower level of physical activity also presented worse values in knee JPS. Some studies in professional footballers4 and in elite tennis players10 agree with our data and confirm that physical activity level is also a factor that can influence the proprioceptive assessment performance. Moreover, higher proprioception ability have been found in competitive athletes .11 Therefore, it is possible to hypothesized that training enhance the proprioception ability. In this study no significant differences were found between the dominant and non-dominant limb. However, when comparing the left and right limb (i.e.: without considering dominance) we found better values in the joint repositioning test in the left side. This is consistent with the results published by Daniel J. Goble12 , which indicates a close relationship between the left side of the body and the right hemisphere of the brain. Moreover, Natio et al. used a regional map with neuroimaging of the brain’s response while applying vibrations to tendons and found that the proprioceptive signals from the proprioceptive receptors generated more information to the right hemisphere of the brain, so the left side of the body should have better proprioceptive values.13,14 Therefore, it seems that the left lower limb have better proprioceptive performance. Steadiness The results of the present study also show better steadiness values in the group of women as compared to men, as the study of Brown et al.15 According to this study, the main difference in steadiness is attributable to the absolute muscle strength, which is higher in men compare to women. Regarding to the physical activity level, results show that subjects with a higher level of physical activity present better isometric steadiness than sedentary subjects. Different studies have shown that strength training improves isometric steadiness due to sensorimotor control improvements, which would explain the better result in trained subjects.16,17 Moreover, this assessment has be related to a greater risk of injury, as seen in various publications that patients with anterior cruciate ligament reconstruction.18 Therefore, this assessment provides an insight in muscle function and may be use in other clinical settings. Onset of Muscle Activation No significant differences were found in most of the onset of muscle activation. Nevertheless, other studies have found that healthy people that have greater anterior knee laxity present an increase in timing of muscle onset of biceps femoris.19 If there is an increased time of muscle onset, it can compromise joint stability, being similar to what happens when there is a ligament injury and damage to receptors that send the afferent signal, and the signal initiating this reflex may be compromised. Acta Ortop Bras. 2019;27(1):20-6.
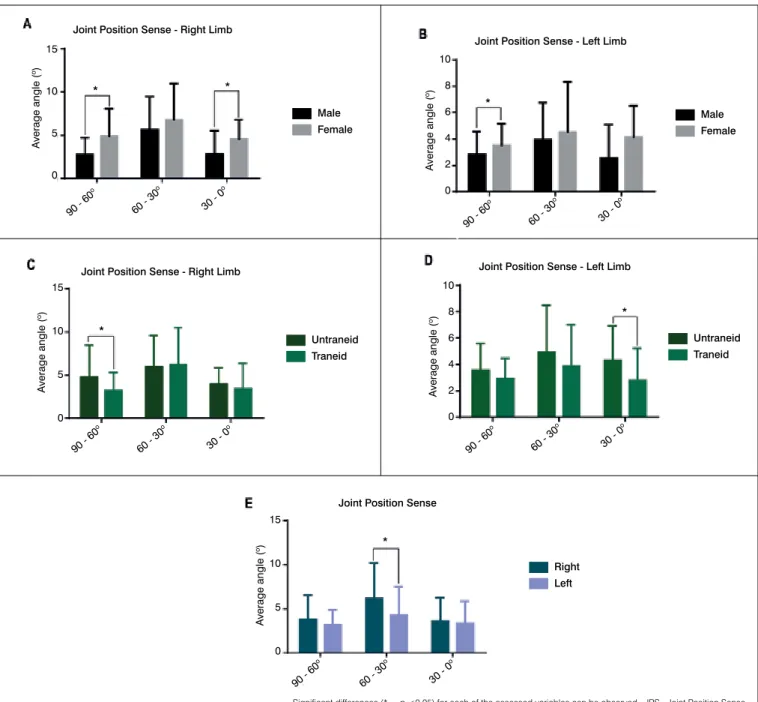
(4) Joint Position Sense - Right Limb. Joint Position Sense - Left Limb 10. *. *. 10. Average angle (o). Average angle (o). 15. Male Female. 5. 0 o. 90. o. 60. -3. 30. *. 6. Female. 4 2. -0. o. 0. 90. -6. o. o. 0. 60. -3. 30. -0. Joint Position Sense - Left Limb. Joint Position Sense - Right Limb 10. *. 10. Average angle (o). 15 Average angle (o). Male. 0. o. 0. 0. -6. 8. Untraneid Traneid. 5. 8. *. 6. Untraneid Traneid. 4 2 0. 0. o. 90. 0 -6. o. 60. 0 -3. o. 30. -0. o. 0. 90. -6. o. o. 0. 60. -3. 30. -0. Joint Position Sense. Average angle (o). 15 * 10. Right Left. 5. 0 o. 0. 90. -6. o. 0. 60. -3. o. 30. -0. Significant differences (* = p <0.05) for each of the assessed variables can be observed. JPS=Joint Position Sense.. Figure 2. Results for joint position senses (JPS) for the comparisons between male - female, trained - untrained and right limb -left limb. All data shown as median and standard deviation. (A) It shows JPS in degrees for the right limb for males and females. (B) It shows JPS in degrees for the left limb for males and females. (C) It shows JPS in degrees for the right limb for trained and untrained. (D) It shows JPS in degrees for the left limb for trained and untrained. (E) It shows JPS in degrees for the left and right limb. Table 2 A. Means Angles Values for Joint Position Sense by gender, physical activity or both limbs. Mean Mean Variable Indicator Limb SD 90º -60º 60º - 30º Right 2,75 1,95 5,59 Male Left 2,82 1,73 3,96 Gender Right 4,88 3,18 6,78 Female Left 3,51 1,65 4,52 Right 3,24 2,07 6,24 Tegner Left 2,93 1,53 3,88 >5 Level of Right 4,77 3,71 5,97 physical activity Tegner Left 3,57 2,01 4,92 ≤5 Right 3,75 2,79 6,15 Limb Left 3,14 1,71 4,22. SD 3,87 2,79 4,20 3,80 4,27 3,13 3,62 3,55 4,03 3,28. Mean 30º - 0º 2,79 2,56 4,52 4,13 3,42 4,92 3,97 4,31 3,60 3,30. SD 2,71 2,53 2,25 2,40 2,94 3,55 1,89 2,59 2,63 2,57. Values expressed in degrees. Abbreviations: SD: Standard Deviation.. Acta Ortop Bras. 2019;27(1):20-6. 23.
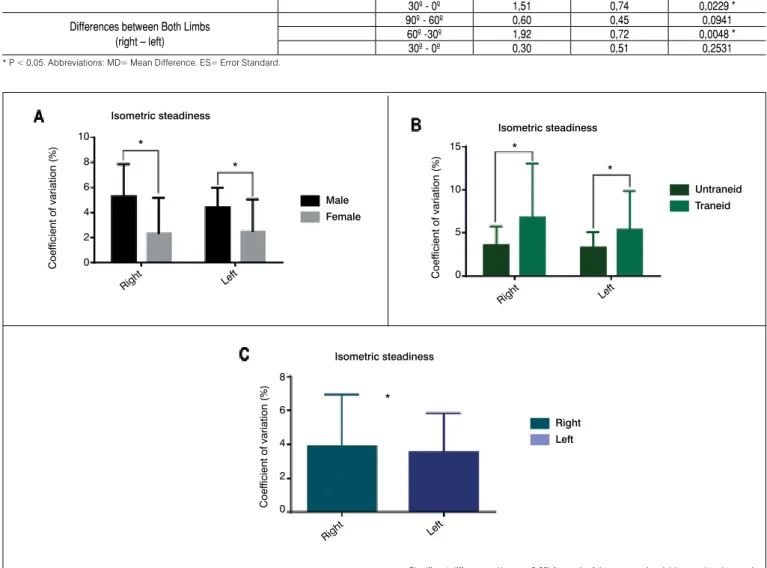
(5) Table 2 B. Comparison of Means Angles Values for Joint Position Sense between gender, physical activity or both limbs. Evaluation Limb Range MD ES 90º - 60º 2,12 1,95 Right 60º - 30º 1,18 1,13 Differences between gender 30º - 0º 1,73 0,70 90º - 60º 0,68 0,47 (Female – Male) Left 60º -30º 0,56 0,92 30º - 0º 1,57 0,69 90º - 60º 1,52 0,80 Right 60º - 30º - 0.27 1,20 Differences between Level of physical activity 30º - 0º 0,54 0,78 90º - 60º 0,64 0,50 (Lower– Higher) Left 60º -30º 1,03 0,97 30º - 0º 1,51 0,74 90º - 60º 0,60 0,45 Differences between Both Limbs 60º -30º 1,92 0,72 (right – left) 30º - 0º 0,30 0,51. P. Value 0,0127 * 0,3358 0,0017 * 0,1311 0,8949 0,0034 * 0,0328 * 0,4109 0,2450 0,1062 1,0374 0,0229 * 0,0941 0,0048 * 0,2531. * P < 0,05. Abbreviations: MD= Mean Difference. ES= Error Standard.. Isometric steadiness. Isometric steadiness. *. 8. 15 Coefficient of variation (%). Coefficient of variation (%). 10. *. 6 Male. 4. Female. 2 0. t. gh. Ri. ft. Le. * *. 10. Untraneid Traneid. 5. 0. ft. t. gh. Ri. Le. Isometric steadiness Coefficient of variation (%). 8 **. 6. Right Left. 4 2 0 t. gh. Ri. ft. Le. Significant differences (* = p <0.05) for each of the assessed variables can be observed.. Figure 3. Results for isometric steadiness for the comparisons between male - female, trained - untrained and right limb -left limb. All data shown as median and standard deviation. (A) It shows the coefficient of variation for the isometric steadiness for males and females. (B) It shows the coefficient of variation for the isometric steadiness for trained and untrained. (C) It shows the coefficient of variation for the isometric steadiness for right limb and left limb. Table 3 A. Mean Percentages for Values Steadiness by gender, physical activity or limb evaluated. Right Limb Left Limb Variable Indicator SD SD Mean Mean Male 5,28 2,57 4,44 1,55 Gender Female 2,32 2,86 2,49 2,58 Level of physical Tegner > 5 3,50 2,24 3,28 1,79 Tegner ≤ 5 6,71 6,23 5,38 4,45 activity Limb 3,88 3,07 3,52 2,30 Values expressed in percentage. Abbreviations: SD: Standard Deviation.. 24. Table 3 B. Comparison of Mean Percentage for Values Steadiness by differences between gender, physical activity or both limbs. Evaluation Limb MD ES P. Value Gender Right - 2,90 0,70 0,0002* Left - 1,90 0,50 0,0009* (Female – Male) Level of physical activity Right 3,20 1,20 0,0065* Left 2,00 0,90 0,0173* (Lower – Higher) Limb 0,30 0,50 0,2531 (right – left) * P < 0,05. Abbreviations: MD= Mean Difference. ES= Error Standard.. Acta Ortop Bras. 2019;27(1):20-6.
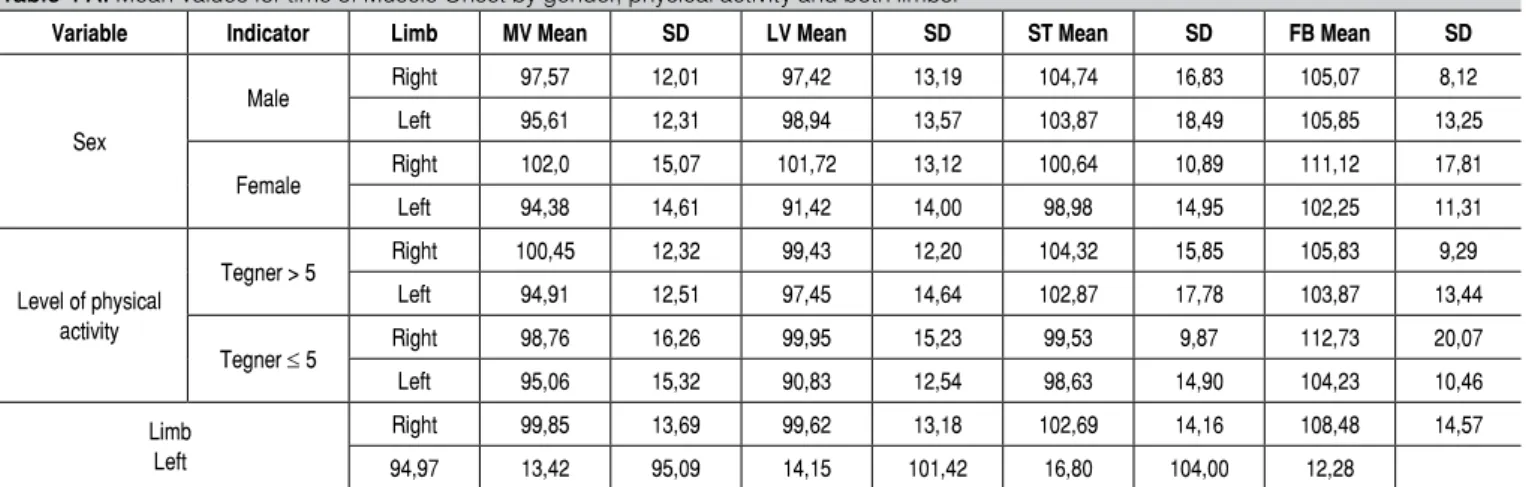
(6) Muscular onset - Left Limb 150. 100. 100. Time (ms). Time (ms). Muscular onset - Right Limb 150. Male Female. 50. 0 VM. VL. ST. *. Male Female. 50. 0. BF. VM. VL. ST. BF. Muscular onset - Left Limb. Muscular onset - Right Limb 150. 150. 100. 100. Time (ms). Time (ms). ** Untraneid Traneid 50. Untraneid Traneid. 50. 0. 0 VM. VL. ST. VM. BF. VL. ST. BF. Muscular onset. Time (ms). 150. *. 100 Right Left. 50. 0. VL. VM. ST. BF. Significant differences (* = p <0.05) for each of the assessed variables can be observed. VM=Vastus Medialis; VL=Vastus Lateralis; ST=Semitendinosus; BF=Biceps Femoris.. Figure 4. Results for muscular onset for the comparisons between male - female, trained - untrained and right limb -left limb. All data shown as median and standard deviation. (A) It shows time of muscular onset for the right limb, for males and female. (B) It shows time of muscular onset for the left limb, for males and females. (C) It shows time of muscular onset for the right limb, for trained and untrained. (D) It shows time of muscular onset for the left limb, for trained and untrained. (E) It shows time of muscular onset for the right limb and left limb. Table 4 A. Mean Values for time of Muscle Onset by gender, physical activity and both limbs. Variable. Indicator Male. Sex Female. Level of physical activity. Tegner > 5 Tegner ≤ 5. Limb Left. Limb. MV Mean. SD. LV Mean. SD. ST Mean. SD. FB Mean. SD. Right. 97,57. 12,01. 97,42. 13,19. 104,74. 16,83. 105,07. 8,12. Left. 95,61. 12,31. 98,94. 13,57. 103,87. 18,49. 105,85. 13,25. Right. 102,0. 15,07. 101,72. 13,12. 100,64. 10,89. 111,12. 17,81. Left. 94,38. 14,61. 91,42. 14,00. 98,98. 14,95. 102,25. 11,31. Right. 100,45. 12,32. 99,43. 12,20. 104,32. 15,85. 105,83. 9,29. Left. 94,91. 12,51. 97,45. 14,64. 102,87. 17,78. 103,87. 13,44. Right. 98,76. 16,26. 99,95. 15,23. 99,53. 9,87. 112,73. 20,07. Left. 95,06. 15,32. 90,83. 12,54. 98,63. 14,90. 104,23. 10,46. Right. 99,85. 13,69. 99,62. 13,18. 102,69. 14,16. 108,48. 14,57. 94,97. 13,42. 95,09. 14,15. 101,42. 16,80. 104,00. 12,28. Values expressed in milliseconds. Abbreviations: SD: Standard Deviation. MV= Medial Vastus. LV= Lateral Vastus. ST= Semitendinosus. FB= Femoral Biceps.. Acta Ortop Bras. 2019;27(1):20-6. 25.
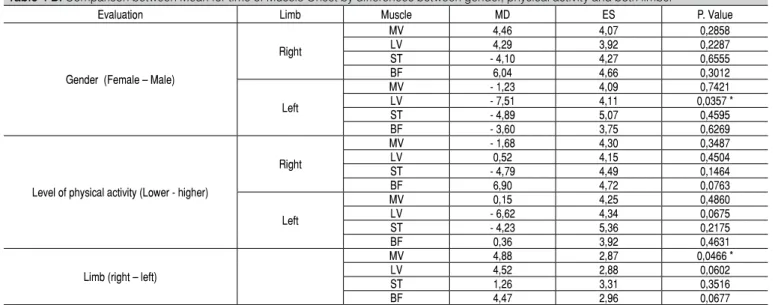
(7) Table 4 B. Comparison between Mean for time of Muscle Onset by differences between gender, physical activity and both limbs. Evaluation Limb Muscle MD ES MV 4,46 4,07 LV 4,29 3,92 Right ST - 4,10 4,27 BF 6,04 4,66 Gender (Female – Male) MV - 1,23 4,09 LV - 7,51 4,11 Left ST - 4,89 5,07 BF - 3,60 3,75 MV - 1,68 4,30 LV 0,52 4,15 Right ST - 4,79 4,49 BF 6,90 4,72 Level of physical activity (Lower - higher) MV 0,15 4,25 LV - 6,62 4,34 Left ST - 4,23 5,36 BF 0,36 3,92 MV 4,88 2,87 LV 4,52 2,88 Limb (right – left) ST 1,26 3,31 BF 4,47 2,96. P. Value 0,2858 0,2287 0,6555 0,3012 0,7421 0,0357 * 0,4595 0,6269 0,3487 0,4504 0,1464 0,0763 0,4860 0,0675 0,2175 0,4631 0,0466 * 0,0602 0,3516 0,0677. * P < 0,05. Abbreviations: MD= Mean Difference. ES= Error Standard. MV= Medial Vastus. LV= Lateral Vastus. ST= Semitendinosus. FB= Femoral Biceps.. CONCLUSION Men presented better JPS and steadiness that women, which may be attributable to a higher laxity of women and higher muscle strength. of men, respectively. Subjects with higher training showed better JPS and steadiness values. This is consistent with the literature, where training results in sensorimotor adaptation.. AUTHORS’ CONTRIBUTIONS: All authors contributed individually and significantly to the development of this article. CSM (0000-0001-9913-3310)*: wrote and reviewed the manuscript, contributed to the intellectual conceptualization of the study and the entire research project. AV: wrote and reviewed the manuscript. IC (0000-0003-3831-6513)*: performed measurements for the assessments and outcome assessment analysis. FJB (0000-0003-3552-8262)*: contributed to the intellectual conceptualization of the study and reviewed the manuscript. CO (0000-0001-7240-1928)*: performed the statistical analysis and reviewed the manuscript. FL (0000-0001-9255-2555)*: performed measurements for the assessments and wrote the manuscript. *ORCID (Open Researcher and Contributor ID).. REFERENCES 1. Riemann BL, Lephart SM. The sensorimotor system, part I: the physiologic basis of functional joint stability. J Athl Train. 2002;37(1):71. 2. Myers JB, Wassinger CA, Lephart SM. Sensorimotor contribution to shoulder stability: effect of injury and rehabilitation. Man Ther. 2006;11(3):197-201. 3. Nagai T, Sell TC, Abt JP, Lephart SM. Reliability, precision, and gender differences in knee internal/external rotation proprioception measurements. Phys Ther Sport. 2012;13(4):233-237. 4. Muaidi Q, Nicholson L, Refshauge K. Do elite athletes exhibit enhanced proprioceptive acuity, range and strength of knee rotation compared with non-athletes? Scand J Med Sci Sports. 2009;19(1):103-112. 5. Tegner Y, Lysholm J. Rating systems in the evaluation of knee ligament injuries. Clin Orthop Relat Res. 1985;198:42-49. 6. Tracy BL, Enoka RM. Older adults are less steady during submaximal isometric contractions with the knee extensor muscles. J. Appl. Physiol. 2002;92(3):1004-1012. 7. Riemann BL, Myers JB, Lephart SM. Sensorimotor system measurement techniques. J Athl Train. 2002;37(1):85. 8. Hermens HJ, Freriks B, Merletti R, et al. European recommendations for surface electromyography. Roessingh Research and Development. 1999;8(2):13-54. 9. Karkousha RN. Sex differences of knee joint repositioning accuracy in healthy adolescents. Bull Fac Phys Ther. 2016;21(1):56. 10. Lin C-H, Lien Y-H, Wang S-F, Tsauo J-Y. Hip and knee proprioception in elite, amateur, and novice tennis players. Am J Phys Med Rehabil. 2006;85(3):216-221.. 26. 11. Han J, Waddington G, Anson J, Adams R. Level of competitive success achieved by elite athletes and multi-joint proprioceptive ability. J Sci Med Sport. 2015;18(1):77-81. 12. Goble DJ, Brown SH. Upper limb asymmetries in the matching of proprioceptive versus visual targets. J Neurophysiol. 2008;99(6):3063-3074. 13. Naito E, Nakashima T, Kito T, Aramaki Y, Okada T, Sadato N. Human limb-specific and non-limb-specific brain representations during kinesthetic illusory movements of the upper and lower extremities. Eur J Neurosci. 2007;25(11):3476-3487. 14. Naito E, Roland PE, Grefkes C, et al. Dominance of the right hemisphere and role of area 2 in human kinesthesia. J Neurophysiol. 2005;93(2):1020-1034. 15. Brown RE, Edwards DL, Jakobi JM. Sex differences in force steadiness in three positions of the forearm. Eur J Appl Physiol. 2010;110(6):1251-1257. 16. Bilodeau M, Keen DA, Sweeney PJ, Shields RW, Enoka RM. Strength training can improve steadiness in persons with essential tremor. Muscle Nerve. 2000;23(5):771-778. 17. Keen DA, Yue GH, Enoka RM. Training-related enhancement in the control of motor output in elderly humans. J Appl Physiol (1985). 1994;77(6):2648-2658. 18. Telianidis S, Perraton L, Clark RA, Pua Y-H, Fortin K, Bryant AL. Diminished sub-maximal quadriceps force control in anterior cruciate ligament reconstructed patients is related to quadriceps and hamstring muscle dyskinesia. J Electromyogr Kinesiol. 2014;24(4):513-519. 19. Shultz SJ, Carcia CR, Perrin DH. Knee joint laxity affects muscle activation patterns in the healthy knee. J Electromyogr Kinesiol. 2004;14(4):475-483. Acta Ortop Bras. 2019;27(1):20-6.
(8)
Figure
+3
Documento similar
The knee OA clinical diagnosis was based on both history and physical examination: pain in the knee was evaluated by the Western Ontario and McMaster Universities OA Index (WOMAC)
The Dwellers in the Garden of Allah 109... The Dwellers in the Garden of Allah
The aim of this work was to study the degree of agreement between consumer liking and the sensory quality scored by the trained panel in charge of the quality control of a
Abstract: The aim of this study was to evaluate the test–retest reliability of a conventional gait model (CGM), the Plug-in Gait model, to calculate the angles of the hip, knee,
The second objective of this study was to determine whether there were differences in the dimensions of burnout, in the students’ personalities and in their fear of COVID-19
Therefore, the aim of this study was to compare the type and frequency of defective deletions found in the SARS-CoV-2 spike gene in patients with mild infection caused by the
Introduction: The aim of this study was to analyze functional results and range of motion and compare them between three groups of patients with total knee arthroplasty: two
The objective of this study was to analyze the clinical and radiological outcomes of conversion to total knee replacement after a high tibial osteotomy and to compare the evolution
