Water quality for agricultural use : in situ analysis of two innovative methodologies for water quality improve and their effects on the agricultural system
72
0
0
Texto completo
(2) Agradecimientos Agradecimientos a la Pontificia Universidad Católica de Chile y al Departamento de Investigación y Postgrado perteneciente a la Facultad de Agronomía e Ingenieria Forestal. De la misma forma, agradecer al proyecto Conicyt Acción Regional “Investigación, desarrollo e innovación para mejorar la eficiencia de uso e inocuidad del recurso hídrico en sistemas de producción hortícola de la Región Metropolitana” (ARII600006), que permitió el establecimiento de los ensayos necesarios para este trabajo.. En segundo lugar, agradecer a la profesora Pilar Gil por la ayuda otorgada y la oportunidad de poder formar parte de su grupo de trabajo. También agradecer al equipo de trabajo que compone al Laboratorio de Agua y Riego por su constante ayuda, tutorizado y paciencia durante el desarrollo de los ensayos.. Agradecimientos especiales a personal del centro experimental de Pirque, en especial a su administrador, Nicolás Vera, y a su jefe de campo, Jose Paz, quienes estuvieron siempre dispuestos a ayudar en la implementación y mantención de los ensayos. Este agradecimiento se extiende al equipo del laboratorio de entomología frutal que aportó con material y conocimientos.. Finalmente agradecimiento a mis padres, hermanos y amigos, los cuales siempre me otorgaron el apoyo necesario para poder salir adelante..
(3) A mis padres, hermanos y amigos..
(4) INDICE 1. Evaluation of the incorporation of ozone via subsurface drip irrigation on lettuce production .............................................................................................. 3. 1.1. Abstract ......................................................................................................... 3. 1.2. Introduction ................................................................................................... 4. 1.2.1. Food safety and water quality ..................................................................... 4. 1.2.2. Use of ozone in food industry and agriculture ............................................... 5. 1.2.3. Ozone decomposition on soil ........................................................................ 6. 1.2.4. Subsurface drip irrigation ............................................................................. 6. 1.3. Material and methods .................................................................................... 7. 1.3.1. Location and experimental design ................................................................ 8. 1.3.2. Hydraulic design ........................................................................................... 10. 1.3.3. Irrigation program.......................................................................................... 11. 1.3.4. Ozone System .............................................................................................. 12. 1.3.5. Oxygen diffusion rate (ODR) ......................................................................... 12. 1.3.6. Soil volumetric water content (θ) ................................................................... 13. 1.3.7. Dry and Fresh weight .................................................................................... 13. 1.3.8. Effect of ozone on soil microorganism........................................................... 13. 1.3.9. Irrigation system pressure and diluted ozone measurements ........................ 14. 1.3.10. Data analysis .............................................................................................. 14. 1.4. Results and discussion ................................................................................. 15. 1.4.1. Irrigation system pressure and diluted ozone measurements ....................... 15. 1.4.2. Oxygen diffusion rate (ODR) ......................................................................... 15. 1.4.3. Soil volumetric water content (θ) ................................................................... 17. 1.4.4. Effect of ozone on soil microorganism........................................................... 19. 1.4.5. Fresh and dry weight ................................................................................... 23. 1.4.6. Vissual appreciation of food safety ............................................................... 27. 1.5. Conclusion ...................................................................................................... 28. 1.6. Resumen ......................................................................................................... 29. 1.7. References .................................................................................................... 30. 1.
(5) 2. Evaluation of the use of buffer strips for enhance physics and microbiological characteristics of water. ................................................................. 35. 2.1. Abstract ......................................................................................................... 35. 2.2. Introduction ................................................................................................... 36. 2.2.1. Water quality problems ............................................................................... 36. 2.2.2. Sediment deposition and buffer strips ........................................................... 37. 2.3. Material and methods .................................................................................... 38. 2.3.1. Experimental design ..................................................................................... 39. 2.3.2. Irrigation ........................................................................................................ 40. 2.3.3. Soil fertilization and species establishment ................................................... 42. 2.3.4. Buffer strip maintenance ............................................................................... 44. 2.3.5. Water flow rate loss and hydraulic conductivity ............................................. 45. 2.3.6. Seddiment accumulation ............................................................................... 46. 2.3.7. Water quality measurements ........................................................................ 47. 2.3.8. Insect description .......................................................................................... 47. 2.3.9. Data analysis ................................................................................................ 47. 2.4. Results............................................................................................................ 48. 2.4.1. Flow rate loss............................................................................................... 48. 2.4.2. Seddiment accumulation ............................................................................... 51. 2.4.3. Water quality analysis ................................................................................... 53. 2.4.4. Insect identification ....................................................................................... 55. 2.5. Discussion...................................................................................................... 56. 2.5.1. Flow rate loss............................................................................................... 56. 2.5.2. Seddiment accumulation ............................................................................... 57. 2.5.3. Water quality ................................................................................................. 59. 2.5.4. Insect identification ....................................................................................... 61. 2.6. Conclusion ...................................................................................................... 62. 2.7. Resumen ......................................................................................................... 62. 2.8. References .................................................................................................... 64. 2.
(6) 1. Water quality for agricultural use: In-situ analysis of two innovative methodologies for water quality improve and their effects on the agricultural system: Evaluation of the incorporation of ozone via subsurface drip irrigation on lettuce production. Erick Bastián Bueno Buker Pontificia Universidad Católica de Chile 1.1. Abstract Erick Bastián Bueno Buker. Water quality for agricultural use: In-situ analysis of two innovative methodologies for water quality improve and their effects on the agricultural system. Evaluation of the incorporation of ozone via subsurface drip irrigation on lettuce production. Tesis, Magister en Fisiología de la Producción Vegetal, Facultad de Agronomía e Ingeniería Forestal, Pontificia Universidad Católica de Chile. Santiago Ozone is a gas that has been used as an effective disinfectant agent of surfaces and water, either in wastewater treatment or as a pathogen disinfection method. Its utilization has expanded in the food industry given its potential uses and rapid decomposition that leaves no residue. It has also been used as an oxygenating agent given the low ozone stability which decomposes and generates molecular oxygen. This study evalauted the use of ozone applied via subsurface irrigation, in physical and biological properties of the soil (oxygen diffusion rate, moisture content, CO2 concentration and presence of microorganisms) and biomass (fresh and dry weight), in two lettuce cultivars (Quenty and Galantine), during two production cycles. The tests were performed under field conditions, in the town of Lampa, Metropolitan Region. Three treatments were applied: (T1) Conventional drip tape irrigation, (T2) Buried drip tape irrigation, (3) Buried tape irrigation using ozonated water. When measuring the concentration of ozone in T3 it was between 0.4 and 0.7 ppm at the end of the irrigation lines. The oxygen diffusion rate, volumetric water content, efflux of CO2, and microorganism presence in the soil did not show significant differences between treatments, while a positive and significant effect was observed on irrigation with ozone water (T3) in fresh and dry weight of lettuce. The above suggests that ozonated water is a possible tool to improve production and advance harvest of leafy vegetables in low aeration soils.. 3.
(7) Key words: Ozone, Subsurface irrigation, low aeration soils.. 1.2. Introduction 1.2.1. Food safety and water quality. Food safety is one of the most important topics in food policy around the world, since it has become an important quality attribute to food industry (Röhr et al., 2005). Also, an increasingly concern for the quality and safety of food have become a common feature of consumers nowadays.. Sources that provide water in the required quantity and quality are fundamental to achieve an optimal food production and safety (Zhang et al., 2015). Global markets and countries are being more restrictive about the microbial load existent in the water used for food production. For example, for water used in production of crops that are eaten uncooked, such as fresh vegetables, the GlobalGap certification standard for water quality, requires values < 1000 ml CFU of Escherichia coli , while water used during post-harvest “shall be of drinking (or microbiologically equivalent) quality” (GlobalGap, 2017). On the other hand, some countries, such as USA, have developed their own restrictions. Havelaar et al., (2017) summarize The Food Safety Modernization act (FSMA) standard rule for microbiological quality, where the law demands the realization of a microbiological water profile for the agricultural water used for growing all the fresh products exported to USA. For this profile, 20 samples over 2 to 4 years must be taken and analyzed. The geometric mean and statistical threshold value of this samples should not exceed 126 and 410 CFU/100ml for E. coli respectively. Corrective measures should be used when the water does not fulfill these requirements, which are based on the importance of E. coli as an indicator of fecal contamination of water and food, and in the increase of outbreaks with impact in the proliferation of gastrointestinal diseases, that in extreme cases can cause vital risks for humans (FAO, 2011).. These reasons, make the use of methods and technologies that achieve an appropriate microbiological water quality, a key step to achieve the food quality 4.
(8) necessary for the food industry. The correct implementation of these methods could greatly determinates the suitability of the product for commercialization.. The development of research that shows the benefits of these methods on crop production may help to increase the interest in the use of technologies that improve water quality in agriculture systems.. 1.2.2. Use of Ozone in food industry and agriculture.. Ozone (03) is a powerful disinfectant agent thanks to its strong oxidant capacity that inactivate microorganis throught the disruption of the cell membranes (Runia, 1994; Newman, 2004) and is had been demonstrated that act as a good bactericide, fungicide and nematicide (Langlais et al., 1991, cited by Martinez et al., 2011; Moore et al., 2000; Guzel-Seydim et a., 2004; Ebihara et al., 2006; Mitsugi et al., 2016). For this reason, ozone has been widely used for the disinfection of wastewaters, drink water and oxidative decomposition of harmful impurities (Martinez et al., 2011).. Ozone use do not produce pollutants or harmful compounds due its quickly decomposition into oxygen (Runia, 1994; Msayleb, 2014), attribute more than attractive to food industry, where ozone is widely used in food storage prolonging the shelf life of fruits and vegetables, showing great action in reducing microorganism, when washed with it, without compromise the product safety (Kim et al., 1999). Enhance of food surface hygiene, sanitization of equipment and reuse of wastewater are some of the applications that can be mentioned (Guzel-Seydim et a., 2004). For example, concentrations between 0.1 and 0.4 ppm of ozone are enough to inactivate E. coli in water (Langlais et al., 1988; 1991, cited by Martinez et al., 2011).. Another use for ozone in agriculture is the sterilization of soils (Ebihara et al., 2011; Msayleb et al., 2013). The use of ozone has demonstrated to be a sustainable alternative to methyl bromide for controlling pathogens such as F. oxysporum, Phytophthora spp and nematodes due to its high efficiency at relatively low concentrations (Msayleb et al., 2013).. 5.
(9) 1.2.3. Ozone decomposition on soil. Ozone is a molecule that under certain conditions of temperature and pressure decomposes quickly into oxygen molecules with a short life span (Remondino and Valdenassi, 2018). Gaseous ozone injected to unsatured soil, exists in two phases on soil pores. One dissolved on the water and the other as a gas phase on the soil pores (Lim et al,, 2002; Yu et al., 2005). Here ozone may accelerate its decomposition in contact with metal oxides (S) existent on soil particles such as iron and manganese, generating catalytic reactions sites (Lim et al., 2002; Yu et al., 2005). Yu et al., 2005, describe ozone decomposition as three major steps. The first step start with the interaction of ozone molecules with metal oxides (catalytic surface sites) were diatomic oxygen (O2) molecules are generated (Eq. 1). Step 2 consist in the interacion of the new generated O2 with other ozone molecules generating oxygen molecules and peroxides (Eq. 2). Finally, step 3 consist in the slow release of the peroxides from the surface sites as O2 molecules (Eq. 3). Factors such as soil organic matter (SOM) and soil water content could accelerate ozone inestability, thus, increasing its decomposition and decreasing its half-life (Lim et al., 2002; Yu et al., 2005). Step 1. O3 + ∗S → O2 + O∗S (Eq. 1) Step 2. O3 + O∗S → O2 + O2∗S (Eq. 2) Step 3. O2∗S → O2 +∗S (slow) (Eq. 3). Equation adapted from Yu et al., 2005. S refers to metal oxides existent on soil.. In all these steps oxygen molecules are released. Some authors states that the use of ozone increases the amount of oxygen on soil and water allowing the right conditions to plant growth (Remondino and Valdenassi, 2018).. 6.
(10) 1.2.4.. Subsurface drip irrigation. The use of subsurface drip irrigation (SDI) have arisen as one of the most efficient irrigation methods, minimizing the losses produced by evaporation, deep percolation and runoff, thus, a more efficient water use is reached (Lamm, 2002). Furthermore, this system grants a localized supply of water on the root zone (Douh et al., 2013). On the other hand, the reduction on the soil moisture and humidity at the surface of the canopy could mean a reduction in plant diseases and better plant health (Lamm,2002; Soussa, 2010), thus, a reduction in critical hazard points affecting the food safety may be achieved.. While numerous studies show the effect of ozone in soil and water sterilization through different methods (Moore et al., 2000; Ebihara et al., 2006;. Msayleb et al., 2013;. Mitsugi et al., 2016), there is no studies that evaluate the effects of the use of ozone, applied to irrigation water and in concentrations to control E. coli, on the physics and biological. properties of soil, and crop growth. Also, little information exists about. oxygen benefits on soil oxygenation for vegetable and plant behavior.. The objective of this study was to evaluate the effect of ozone concentrations used to control E. coli on water and inyected to a subsurface drip irrigation system, on soil properties such as oxygenation, volumetric water content and soil microorganism, and on crops growth, in order to determine possible secondary benefits of its use on agricultural systems.. 1.3. Material and methods The effect of three different treatments that combined the use of ozone and subsurface drip irrigation (SDI) in the properties of soil and vegetal growth of two lettuce (Lactuta sativa) cultivars were evaluated. Three field trials were performed in three different times between May of 2018 and May of 2019. Treatment 1 (T1) consisted of a surface drip irrigation without ozone; treatment 2 (T2) used SDI without ozone; treatment 3 (T3) combined SDI with the injection of ozone generated by an oxygen concentrator at 7.
(11) concentrations between 0.5 and 1.5 ppm. Due to some differences on soil, the experiments were designed as randomized complete block design, with four blocks (Figure 2 and 3). In field trial 1 and 2 (F1 and F2), the blocking factor were observable differences in soil stone content in the site, while in fiel trial 3 (F3) the factor was sligh differences on soil compactation, where block 1,2,3 and 4 shows bulk densities of 1.6, 1.26, 1.3 and 1.45 g/cm3 respectively.. 1.3.1. Location and experimental design F1 and F2 were conducted in an orchard that belongs to Agricola Vegus Ltda. (33°14’47’’ S, 70° 47’3’’ W), located in Lampa, in the northest side of Santiago of Chile. For this site, the soil analysis shows a clay loam texture with 35% of clay, 34% of silt and 31% of sand. F3 was established in Fundación AgroUC (33° 40’12’’ S, 70° 35’7’’ W) located in Pirque, in the south-west side of Santiago. A soil analysis shows a loam texture with 20% of clay, 42% of silt and 38% of sand.. For all the trials, the experimental unit consisted in soil rows of 80 cm width (Figure 1). On F1 and F2 each row had a length of 11 m, while in F3 was 3,5 m. Each treatment had three rows and all the measurements were made in the central row in order to avoid the edge effect. Thus, each block had nine rows and three treatments.. 8.
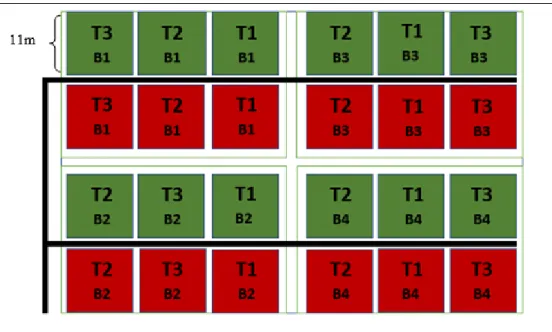
(12) Figure 1. Widht of rows and separation and distribution of lettuce plants. Green lines show the location of the drip tapes placed on soil rows where the plants were planted.. The cultivars Quenty (V1) and Galantine (V2) of lettuce were selected as crops to test In F1 and F2 both cultivars were used. While in F3 only Galantine was established. In F1 and F2, a site of 1000 m2 was selected from the orchard typically used to growth vegetables. In this site, each block had nine rows of 11 meters of Quenty and nine rows of 11 meters of Galantine (Figure 2) . In both trials, 2640 plants of each cultivar were transplanted from seedlings granted by Agricola Vegus. The plants were planted alternately in two rows and the drip irrigation lines were put between them. In each of these rows the plants had 30 cm of distance between them (Figure 1).. In F3, a site of 292 m2 approx. was selected (Figure 3) with no history of been used for crop growth or vegetal cover development. In this site, all the four blocks had also 9 rows. Here, 840 plants from seedlings were used. The planting method was the same used on F1 and F2 (Figure 1).. Figures 2. Field trial 1 and 2 distribution. Each block (B1, B2, B3 and B4) have three treatments (T1, T2, T3) and the cultivars Quenty (green) and Galantine (red).. 9.
(13) Each cultivar had rows of 11 m in length. The black lines show the distribution of the low-density polyethylene where the drip tapes lines were connected.. Figure 3. Field trial 3 distribution. Each block (B1, B2, B3 and B4) have three treatments (T1, T2, T3) and the cultivar Galantine. Each cultivar had rows of 3,5 m in length. The black lines show the distribution of the low-density polyethylene where the drip tapes lines were connected. The transplant in F1 was made in the first week on June of 2018. In F2 the transplant was made between November 15 and 24 of 2018, and due to plants death and weed problems, block 1 was not considerate for the measurements. The transplant in F3 was made February 27 of 2019.. 1.3.2. Hydraulic design For all the treatments, the irrigation was delivered using drip tapes (Rivulus, D1000, Israel) with a diameter of 16 mm, a wall thickness of 0.15 mm and a slit outlet system that minimize the risk of soil suck-back when the system is shut down that allows its use in subsurface drip irrigation systems.. The emitters in the lines were separated by 30 cm and have a nominal flow rate of 1.5 l/h with a pressure of work between 0.8 to 1.2 bar and an optimum of 1 bar.. 10.
(14) In F1 and F2 the water for the irrigation system was extracted from a connection made with the pipe matrix in a section placed before the node that irrigates a sector nearby the site of the trial. The water flow was driven to the irrigation shed housing by a 2” lowdensity polyethylene.. Due to the loss of pressure generated by the distance between the point of extraction and the shed housing, a centrifugal pump (Speroni, SM50) of 0,5 hp, was used to achieve the correct pressure of work for the drip tapes. After the pump, independent hydraulic conduction systems were used to control the flow delivered to the treatments. Each one of them had a ball and a gate valve to regulate the flow of water and a manometer to check the pressure of work. Systems for T1 and T2 direct the water flow directly to the blocks using 1” low-density polyethylene. T3 system directs the flow back to the shed housing were the ozone system is installed. The water combined with ozone is directed to the blocks by 1” low-density polyethylene. Due to the loss of pressure produced in the ozonation, two centrifugal pumps of 0,5 hp were installed before and after the ozone system in order to achieve a correct pressure of work for the drip lines that irrigates T3.. Finally, in order to minimize the loss of pressure in the irrigation system, the lines of low-density polyethylene in which the drip tapes were connected, were placed in the center of the blocks, in the separation between the two cultivars (Image 1).. In F3, the extraction of water was from the irrigation shed house used for a vineyard site nearby. The same ozone system and independent hydraulic systems were used. Due to the proximity of the irrigation system with the extraction point, no external centrifugal pumps were needed to achieve the work of pressure.. 1.3.3. Irrigation program Irrigation times and frequency were calculated considering the physical and hydric properties of the soil, the atmospheric demand (Eto calculated from Penman-Monteith method), and a single crop coefficient (Kc) adjusted according to the crop growth stage (Yagüe, 1999). A teorichal irrigation threshold of 30% was considered. 11.
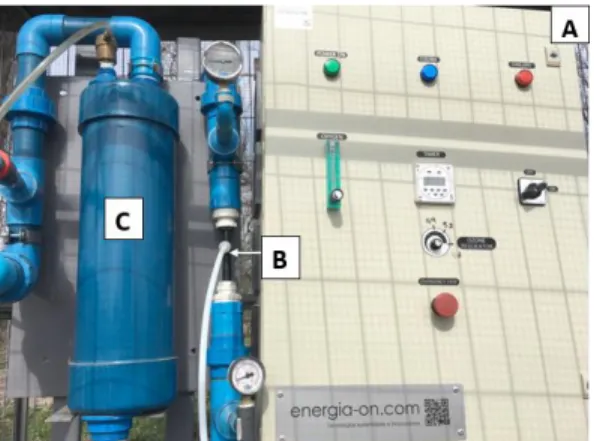
(15) 1.3.4. Ozone system The ozonification of water, was achieved using an ozone generator equipment (Energia On, EON-0G20FO2, Australia) that uses oxygen concentrators for the production of gaseus ozone. The injection into the irrigation system was made via a venturi system (Figure 4). After the injection, a tank is used to disperse the undiluted ozone into the atmosphere (Figure 4). Finally, the flow of water with diluited ozone is directed to the blocks. This system grant concentrations between 0.5 and 1.5 ppm of ozone. Thus considering the nominal flow rates of the emitters (1.5 l/h), an irrigation duration of 1 h and the concentrations granted by the system, teorichal dozes between 0.75 mg and 2.25 mg of ozone applied to soil via the irrigation system could be expected during each irrigation.. Figure 4. Ozonification system with a ozone generator equipment (A), venturi system for ozone inyection (B) and a tank to disperse undileted ozone (C).. 1.3.5. Oxygen diffusion rate (ODR) To evaluate the effect of ozone irrigation in the properties of soil, the oxygen diffusion rate (ODR) was measured using an ODR meter (Oxygen Difussion Meter, Eijkelkamp, Netherlands). The method used for this instrument consist in measure the electric current generated by the reduction of O2 that occurs at the surface of a cylindrical wire electrode (McIntyre, 1970). The reduction its generated by the electrical potential. 12.
(16) applied between the electrode (in this case a platinum electrode) and a reference electrode (in this case a silver-silver chloride electrode filled with saturated KCl) as illustrated by Letey and Stolzy (1964). The readout gives a dimensionless value that must be transformed to µg m-2 s-2 by multiplying it by 3.5. The measurements were made 20 minutes after irrigation on satured soil in the north side of the central row of each treatment, inserting the platinum electrode (Pt-electrode) at a depth of 10-15 cm at 15-20 cm of distance from the irrigation line. 1.3.6. Soil volumetric water content (θ) A ProCheck interphase device and a GS1 sensor were used to measure the volumetric soil water content (θ). The measurements were made before irrigation in F1 and before and after irrigation in F2 and F3. All the measurements were made in the south side of the central rows of each treatment at least once a week at depths of 15 cm.. 1.3.7. Dry and fresh weight Five plants from the same side of the central row of each treatment were collected. The harvest time was according the weight reached by the plants, considering a commercial weight between 150 to 200 g . The samples were placed on paper bags and weighted with a digital balance to obtain fresh weight. After that, all the samples were placed in a stove at 70° C for five days and weighted again in order to obtain dry weight.. In F1 the samples were obtained 40, 55, 72, 81 and 93 days after transplant (DAT). While in F2 and F3 the samples were recollected in a single date on January 18 and May 16 of 2019 respectively.. 1.3.8. Effect of ozone on soil microorganism.. To assert the effect of the ozone application on soil microorganism, soil samples were obtained in F1 on two different dates. Samples were collected four and seven weeks after the start of ozone injection on august 6 and august 28 respectively, in all the treatments and blocks, in order to evaluate the effect of continuous ozone application on soil microorganism. In this samplings, composite samples and independent samples 13.
(17) were taken for tratments without ozone application (T1 + T2) and with ozone application (T3) respectively. The samples were composed of three sub-samples collected on the central row of each treatment. Each sub-sample was made collecting 1 kg of soil along the experimental unit. All the samples were carried to the Molecular Phytopatology laboratory belonging to the Faculty of Agronomy and Forestry Engineering of the Pontificia Universidad Católica de Chile, where the Colony Forming Units (CFU) of fungi and bacteria were obtained and counted.. For F2 and F3, at the end of each trial and in three points of the central row of all treatments, the soil CO2 efflux (SCE) was measured using an Environmental gas monitor device (EGM-4, PP Systems, USA) and an SRC-1 soil respiration chamber (SRC-1, PP systems, USA). The procedure utilized was the one provided by the manufacturer (PPsystems) for closed system soil respiration measurements. The readout gives a value of efflux in g CO2 m-2 h-1, which was converted to μmol CO2 m2 S-1 by dividing it by 0.1584. All the measurements were made at least 15 cm of distance from the plants in order to avoid interference produced by root respiration.. 1.3.9. Irrigation system pressure and diluted ozone measurements To confirm that the pressure of work and the ozone concentration in water were the correct, periodic measurements were taken throughout the trials.. For pressure, a glycerin pressure gauge was used and the measurements were taken at the end of the central row drip tapes of each treatment .. For diluted ozone in water, measurements were made using a portable digital sensor (Eco sensor, D03, USA). The samples were taken at the end of the drip irrigation lines of the central row of each treatment.. 1.3.10. Data analysis. Data is shown as means and standard error (SE). The Shapiro-Wilk test was used to evaluate the feasibility to use ANOVA and Fisher´s LSD to analyze the effects of treatments on ODR, θ before and after irrigation, SCE and dry and fresh weight. For. 14.
(18) non-parametric variables the Kruskal-Wallis was performed. The statistical analysis was conducted using the InfoStat statistical program.. 1.4. Results and discussion 1.4.1. Irrigation system pressure and diluted ozone measurements In F1 and F2 the work pressure reached on the drip tapes ranged between 0.6 and 0.8 bars in T1, and between 0.8 and1.0 bars in T2 and T3 (data not shown). For F3 the pressure of work was between 0.9 and 1.0 bars (data not shown).. The final ozone concentrations observed on the drip tapes in T3 ranged between 0.4 and 0.7 ppm (data not shown). Thus, unlike the teorichal dozes expected, dozes between 0.6 and 1.05 mg per irrigation (flow rates of 1.5 l/h and an irrigation duration of 1h) of ozone were applied. This results show that along the trials, the concentrations and dozes reached were always between the values that allows the control of E. coli (Langlais et al., 1988; 1991, cited by Martinez et al., 2011).. 1.4.2. Oxygen diffusion rate (ODR). No significant differences in ODR for all the treatments and cultivars were found, where the values ranged between 23-34 µg m-2 s-1 on F1, 32-35 µg m-2 s-1 on F2 and 28-31 µg m-2 s-1 on F3 (Data not shown) .. Letey and Stolzy (1964) made an early review of different investigations that measure the ODR of soils using a platinum electrode in different species. They conclude that an ODR of 0.2 µg cm-2 min. -1. and 0.3 µg cm-2 min. can retard it. However, the limiting and critical values varies. -1. and below can inhibit root growth, while values between 0.2. according species (Glinski and Stepniewski, 1985).. If the ODR values given by the previous study are transformed to the units used by the ODR meter, the values that inhibit root growth are between 33 and 50 µg m-2 s-1. In this study, all the treatments were way below 50 µg m-2 s-1. These values are normal according to information shown by Letey (1985), where measurements of ODR made in 15.
(19) soils at different depths, shown that one day after irrigation the oxygen diffusion rate at depths above 10 cm still had values below the critical limit of 0.2 µg cm-2 min -1. Thus, another factor that could explain the results and lack of differences, was the satured water conditions existent when measurement were performed, suggesting that longer times between irrigation and measurements are needed.. The above imply a challenge to evaluate the effect of ozone on ODR considerating the characteristics of ozone decomposition in soils and water, were its half-life could be of only minutes.. The rate of decomposition is strongly influenced by metal oxides, soil organic matter (SOM), organic contaminants and water content present in soils (Lim et al, 2002; Yu et al., 2005). Thus, ozone particles are highly instable in this medium and its half-life could greatly vary. Yu et al. (2005) studied the kinetics of ozone decomposition in colums packed with sand previously washed and containing only metal oxides; and found that the decompositions reactions followed first-order kinetics with a half-life of 1 hour, a decomposition 8.7 and 13.1 times faster than the observed on empty columns and colums packed with glass beads respectively. Nevertheless, the presence of SOM also greatly decrease ozone half-life, wich is respalded by others studies that shows SOM is the principal consumer of ozone in soil (Jung et al.,2008). Thus the combination of SOM and metal oxides could decrease its half-life to only minutes.. Lim et al. (2002) studied the kinetics of ozone decomposition in soils with and without organic matter and found that the instant demand of ozone (ID) and its decay are highly influenced by SOM with half-life as low as 100 seconds. Additionally, when organic matter is present, the concentration of sand and the size of sand particles play a major role on ozone consumption. The results in this study show that small sand particles accelerate ozone decay, while an increase is also observed with higher concentration of sands. Thus, they conclude that ID and ozone decay rate have a strong dependence on the mass of SOM bounded to the sand surface.. On the other hand, ozone also have a reduce half-life in solutions. In water, the decomposition of ozone is influenced by factors such as pH, temperature and organic. 16.
(20) contaminants present in water, with half-life as low as few minutes or seconds in some conditions. (Harding et al., 2013).. Possible differences on SOM and metal oxides between the sites of the field trials could mean the presence of more or less elements that consume ozone molecules and accelerate its decomposition. Therefore, the dynamics of ozone consumption and decomposition could greatly vary between this sites.. All this facts suggest that ozone applied to soil via irrigation could have a very short half-life both in water and soil due to its inestability, thus, the exact time were the reaction that generate O2 occurs may not have matched with the ODR measurements made in this study. Also, the possible differences on SOM of each site suggest that an understanding of the individual characteristics and kinetics of the ozone decomposition and its half-life on each soil of the trials could have been a key step to obtain ODR measurements that show the real effect of ozone decomposition on soil oxygenation.. 1.4.3. Volumetric water content When results in volumetric water content were observed,. F1 shows significant. differences (p=0.0013) before irrigation only in Galantine cultivar, where the mean for T3 was significantly lower than the mean forT1 and T2 (Table 1).. This may be due to the depth were the drip tapes were established in this trial. For treatments T2 and T3 a depth of 5 cm was selected. Douh et al. (2013) states that subsurface drip irrigation system at depths of 5 cm present more variations in soil moisture uniformity, wet areas and stability than systems that are buried at greater depths. Thus, subsurface drip irrigation buried at 5 cm is more sensitive to problems in irrigation system and scheduling. During this trial due to orchard management problems, some days the irrigation duration was not the correct one. This could had affected the measurements in some points of measurement of T 3, which can be seen in some measurement made were the values were below the expected (data not shown).. 17.
(21) Table 1. Means and standard error (SE) for volumetric water content (θ) before irrigation of cultivar Galantine in field trial 1 and 3 (F1 and F3) for surface drip irrigation without ozone (T1), subsurface drip irrigation without ozone (T2) and subsurface drip irrigation with ozone injection (T3). Different letters show significant differences between treatments for each cultivar according LSD Fisher.. θ before irrigation(m3/m3). Trial. F1. F3. Galantine. Galantine. T1. 24. 0.23±0.01 b. T2. 24. 0.21±0.01 b. T3. 24. 0.17±0.01 a. T1. 32. 0.14±0.01 a. T2. 32. 0.15±0.01 b. T3. 32. 0.16±0.01 b. For F2 no significant differences were found before irrigation and the values ranged between 0.16-0.17 m3/m3 (data not shown). While in F3, before irrigation, significant differences (p=0.04) were only found between the surface treatment and the subsurface treatments before irrigation (Table 1).. In F3, contrary to F1, the burial depths of the drip tapes were aproximetly 10 cm, thus poblems of moisture uniformity due to their location are unlikely the cause of the differences. The differences between treatments with SDI (T2 and T3) and surface drip irrigation (T1) could be due to less water loss produced by SDI systems, that allows a major soil water content between irrigations and a correct water supply in comparison with surface systems that are more susceptible to evaporation, percolation and runoff (Douh et al., 2013).. After irrigation, no significant differences were found, and the values of mean ranged between 0.24-0.26 m3/m3 in F2 and 0.27-0.28 m3/m3 in F3 (data not shown). This show. 18.
(22) that theorichal values near field capacity for soils with clay loam and loam respectively were reached after irrigation (Gil, et al., 2009).. 1.4.4. Effect of ozone in soils microorganism. a. Soil samples. Soil microorganism analysis performed in F1, show no significant effect of ozone use on soil fungi microorganism in both sampling dates (Table 2). For bacteria, no differences were found in samples made on Agust 28th. Samples made on August 6th were impossible to count due to excessive growth of colonies.. Table 2. Colony forming units (CFU) of fungi and bacteria found in soil samples from treatments with ozone application (T3) and composite samples (T1+T2) from treatments without ozone application, made in two dates, Agust 6th and August 28th. Results with x refers to the impossibility to count colonies due to excessive growth. CFU of Fungi Treatment. August 6th. Agust 28th. T3. 1.84*10^5. 5.12*10^5. T1+T2. 5.64*10^5. 3.85*10^5 CFU of bacteria. T3. x. 4.87*10^8. T1+T2. x. 7.30*10^8. Most of the research that study the effect of ozone in soil microorganism, are centered in the direct use of ozone for soil sterilization. For this purpose, dozes higher than the reported in this study have been used. For example, in laboratory experiments using soil samples and different doses of ozone, Msayleb et al. (2013) found that concentrations of 0,84 mg/L ( flow rates of 0,25 l/min) and 0,47 mg/kg (flow rates of 0,5 l/min) inyected as a gas, completely inhibit Fusarium oxysporum and Phytophtora sojea respectively, while, in nematodes, a LD50 was reached at concentrations below 0,39 mg/kg ( flow rate of 0,1 l/min). Mitsugi et al. (2016) found that water with ozone at concentrations between 1 and 4 ppm caused a 100% of mortality over a population of 19.
(23) the nematode C. elegans. Ebihara et al. (2006) found that when ozone was directly injected as a gas into the soil, concentrations of 38,5 ppm at gas flow rate of 3 l/min for 60 minutes (6,93 g of dose) had a 100% of sterilization over soils inoculated with 106 conidia/ml of Fusarium oxysporum. In the same way, Stryczewska et al. (2013), found that dozes of 0.3 and 0.6 g (10 and 20 g/m3 respectively applied for 10 min at flow rates of 3 l/min) reduced colonies of Fusarium oxysporum in 97% and 99% respectively, but no effect on other soil organism was studied.. On the other hand, few studies have reported the effect of ozone soil sterilization on other microorganism different from soil pathogens. Ebihara et al. (2012) found that concentrations of 20 ppm applied for 20 min. at flow rates of 1 l/min (dozes of 0.4 g) inyected directly as gas in soil, reduced bacteria colonies from 3.8*107 to 8.5*106 CFU/cc, and fungi from 1.8*105 to 2.7*104 CFU/cc. Also, this application shows a 16 and 2 fold increase of ammonium (NH4+) and nitrate (NO3-) showing a possible inactivation of nitrifying bacteria that allows the transformation of NH4+ to NO3-, and denitrifiying bacteria that consumes NO3- to form NO2-. This authors conclude that the dozes used for soil sterilization could affect soil beneficial microorganism such as bacterias of the nitrogen cycle.. Mitsugi et al. (2014) concluede that ozone application on soil have a possitive impact on the decomposition of organic matter produced by soil microorganism, and thus an increase of inorganic nitrogen in soil. Here concentrations of 86 g/m3 were applied to 100g of soil samples at flow rates of 1.5 l/min at durations between 1 and 90 min (dozes between 0.1 and 11.6 g). For all the dozes used, concentrations of nitrate and ammonium increased, reching values of 36 and 50 fold respectively of the initial value before ozone application. They also obserbed that a complete degradation of high molecular soil DNA was reached with the highest doze, suggesting a degradation of soil microorganism. Jung et al. (2008), found that concentrations of 20 mg L-1 decrease the heterotrophic bacteria in 90% when ozone was inyected for 30 min on soil columns. They also found that the fatality of the heterotrophic bacteria and soil organic matter were linealy correlated whit a Pearson’s correleation coefficient of -0.95.. 20.
(24) All these studies suggest that more than the concentration produced by the ozonation system, it is the dozes applied (determined by flow rate and time of application) that determine the effect on soil microorganism. In this study, the concentrations and dozes used on each irrigation were significantly lower than the ones usually used in ozone research (0.4-0.7 ppm and 0.6-0.1 mg respectively). On other hand, ozone was not directly applied to soil but to irrigation water. Thus a quickly decoposition of ozone may occur in the luiquid fase of soil pores, decreasing the actual ozone concentration that interacts with soil microorganism, if it is considered, like stated before, that ozone have a very short life in water solutions and is highly reactive in contact with soil metal oxids and organic matter that consume it. Ozone effectiveness in the control of microorganism depends on the residual ozone in the medium that generate the oxidating activity (Pascual et al., 2007; Harding et al., 2013).. The low concentrations and dozes, and its high instability on soils suggest that the ozonation method used in this study did not represent a risk against the soil microorganism. Nonetheless, a quantification of the residual ozone in the medium after irrigation is needed to assert this.. b. Soil CO2 efflux If the CO2 produced by the metabolic activity for support and growth of roots is not considered, much of the soil respiration its consequence of the heterotrophic respiration from microbial communities mostly involved in the decomposition of organic matter (Ryan and Law, 2005; Luo and Zhou, 2006). In this study, all samples were made in order to avoid interference produced by root respiration of plants, thus, the results obtained could be attributed to microorganism respiration.. The results for trials 2 and 3 (Table 3) show that there was no effect of the application of ozone (p>0.05) on soil respiration in comparison with treatments without diluted ozone in water. Therefore, no harmful effect of ozone use on soil microorganism were observed.. 21.
(25) Table 3. Means and standard error (SE) of Soil CO2 Efflux (SCE) in field trials 2 (F2) and 3 (F3) in treatments with surface drip irrigation (T1), subsurface drip irrigation without ozone (T2) and subsurface drip irrigation with ozone injection (T3). Kruskal-Wallis analysis show no significant differences between treatments in field trial 2 (F2) and 3 (F3).. (B)(C)(D)(E)(F) SCE (μmol CO2 m-2 s-1) Trial. Cultivar. Treatments n. mean±SE. T1. 9. 5.60±0.37. T2. 9. 5.78±0.35. T3. 9. 5.81±0.40. Galantine T1. 9. 6.60±0.25. T2. 9. 5.58±0.71. T3. 9. 6.46±0.39. F2. F3. Quenty. Galantine T1. 12 2.68±0.11. T2. 12 2.58±0.11. T3. 12 2.65±0.11. On the other hand, low values of SCE were observed in F3 in comparison with F2. This could be explained by the conditions existent when the measurement were taken. In F2 the measurements were on January of 2019, where the maximum average temperature were close to 30° C, while measurements in F3 were made on May of 2019, with maximum average temperatures of 20°. Apart from carbon content and soil moisture influences,. soil. respiration. its. largely. influenced. by. temperature,. increasing. exponentially with it (Ryan and Law, 2005; Luo and Zhou, 2006; Phillips and Nickerson, 2015), where low temperatures could affect enzymes and soil microbial activity (Luo and Zhou, 2006).. The data obtained in all the trials may suggest that the concentrations of ozone generated, and the method of application, did not represent a risk for the beneficial microorganism or pathogens of the soil. Nevertheless, a quantification, classification. 22.
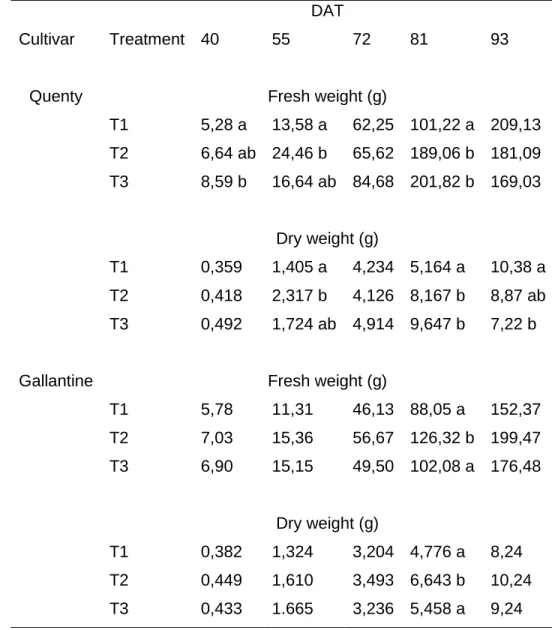
(26) and description of all the microorganism present in the soil after the continuous application of ozone may be needed to assert this.. 1.4.5.Fresh and Dry weight.. In F1, Table 4 shows that significant difference in fresh weight between superficial (T1) and subsurface drip irrigation (T2 and T3) were found at 55 and 81 DAT in Quenty. At 81 DAT T3 and T2 had the highest values, but at 93 DAT both values drop while T1 reach the highest mean of 209,13 g. No significant differences were found between T2 and T3 in all the sample days.. In the same way, significant differences for dry weight were also found at 55 and 81 DAT. At 81 DAT T2 and T3 had higher values in comparison with T1, but this relationship was reverted at 93 DAT were significant differences were found between T1 and T3, where T1 had the highest weight.. This data shows that no effect of the injection of ozone in fresh and dry weight was found in this trial. Nevertheless, an effect of the use of subsurface drip irrigation could be found. This effect was mostly observed at 81 DAT were T2 and T3 reached the highest weight of all the days. For Quenty, this fact and the weight loss for these treatments observed at 93 DAT could mean that unlike T1, the use of subsurface irrigation allowed faster growth and development in this cultivar. This was not observed in Galantine where at 93 DAT all the treatments had a gain in weight in comparison with 83 DAT, and the highest values were obtained for treatments with SDI.. 23.
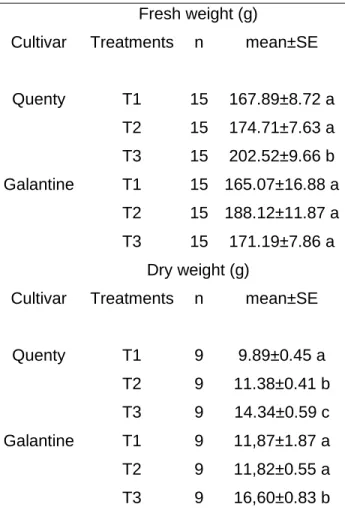
(27) Table 4. Means for fresh and dry weight at 40, 55, 72, 81 and 93 days after transplant (DAT) for cultivars Quenty (V1) and Galantine (V2) obtained in field trial 1. DAT Cultivar. Treatment 40. Quenty. 55. 72. 81. 93. Fresh weight (g) T1. 5,28 a. 13,58 a. 62,25 101,22 a 209,13. T2. 6,64 ab 24,46 b. 65,62 189,06 b 181,09. T3. 8,59 b. 16,64 ab 84,68 201,82 b 169,03. Dry weight (g) T1. 0,359. 1,405 a. 4,234 5,164 a. 10,38 a. T2. 0,418. 2,317 b. 4,126 8,167 b. 8,87 ab. T3. 0,492. 1,724 ab 4,914 9,647 b. Gallantine. 7,22 b. Fresh weight (g) T1. 5,78. 11,31. 46,13 88,05 a. 152,37. T2. 7,03. 15,36. 56,67 126,32 b 199,47. T3. 6,90. 15,15. 49,50 102,08 a 176,48. Dry weight (g) T1. 0,382. 1,324. 3,204 4,776 a. 8,24. T2. 0,449. 1,610. 3,493 6,643 b. 10,24. T3. 0,433. 1.665. 3,236 5,458 a. 9,24. In F2, for fresh weight, significant differences (p=0.03) were found between T3 and the two other treatments in Quenty (Table 5), while no significant differences were found in Galantine (p=0.42). For dry weight, significant differences (p<0.001) between treatments were found, where T3 had the highest values, followed by T2 and last T1 (Table 5). In Galantine T3 shows significantly (p=0.01) more dry weight than the others two.. 24.
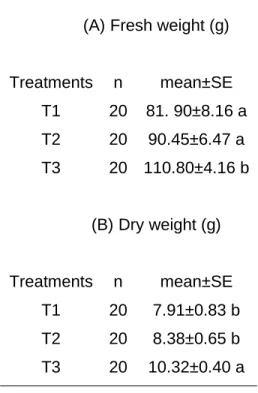
(28) Table 5. Means and standard error (SE) for lettuce fresh and dry weight in field trial 2. Different letters show significant differences between treatments for each cultivar according LSD fisher.. Fresh weight (g) Cultivar. Treatments. n. mean±SE. Quenty. T1. 15. 167.89±8.72 a. T2. 15. 174.71±7.63 a. T3. 15. 202.52±9.66 b. T1. 15 165.07±16.88 a. T2. 15 188.12±11.87 a. T3. 15. Galantine. 171.19±7.86 a. Dry weight (g) Cultivar. Treatments. n. mean±SE. Quenty. T1. 9. 9.89±0.45 a. T2. 9. 11.38±0.41 b. T3. 9. 14.34±0.59 c. T1. 9. 11,87±1.87 a. T2. 9. 11,82±0.55 a. T3. 9. 16,60±0.83 b. Galantine. Different from F1 and F3, the plants in F3 were harvested before reaching an acceptable commercial weight (Table 6), this was mostly due to the stem ramification observed, showing the common elongation observable prior to flowering. This may had been produced by the soil compactation observed in the site, were blocks 1 and 4 showed bulk densities of 1.6 and 1.45 g/cm3 respectively (data not shown). Soil compactation affects the macropores system of the soil, modifying physical soil. 25.
(29) properties such as soil water, soil aereation and soil temperature, therefore, root and potetntial crop growth could be affected (Boone and Veen, 1994).. Regardless of this, in F3, significant differences in fresh weight (p=0.01) and dry weight (p=0.02) were found, where T3 was the only one that reached weights close to the commercial ones (Table 6), showing an effect of ozone application in these low aereation conditions. Also, while no significant differences were found, higher values for T2 on fresh and dry weight were found in comparison with T1 ( Table 6).. Table 6. Means and standard Error (SE) for lettuce fresh and dry weight in field trial 3. Different letters show significant differences between treatments for each cultivar, according LSD Fisher.. (A) Fresh weight (g). Treatments. n. mean±SE. T1. 20. 81. 90±8.16 a. T2. 20. 90.45±6.47 a. T3. 20 110.80±4.16 b. (B) Dry weight (g). Treatments. n. mean±SE. T1. 20. 7.91±0.83 b. T2. 20. 8.38±0.65 b. T3. 20. 10.32±0.40 a. The results in F2 and F3 are consistent with other studies that evaluate the effect of ozone in plants growth. In a recent study conducted by Vázquez-Ybarra et al. (2015), significant increases in stem diameter and fresh and dry biomass of roots and shoots in. 26.
(30) comparison with the control (16%, 23%, 89%, 15% and 11% increase respectively) were observed when concentrations between 2.66 and 3.96 mg/l where applied to a culture medium in hydroponic lettuces. Nevertheless, this authors sustained that the effect of ozone in plant growth was due to the phenomenon of hormesis, that implicates a set of responses through which a chemical, biological or physic agent at low doses can activate and adaptative response that increments the stress resistance of the organism, nonetheless, the same agent at high doses could be harmful. Thus, the effect of ozone in plant growth is determined by the crop tolerance to different doses.. Graham et al. (2011) found that ozone utilized for water remediation in a recycling water irrigation system used on hydroponic tomato, significantly increases leaf area, shoot dry matter and stem thickness when concentrations of 3 mg/l where used. In this study, the improvement on plant performance was attributed to the control that ozone made on algae, that commonly compete for nutrients, limit the oxygen diffusion to the roots, generate toxins and can create habitat auspicious for fungus and other pests. Similar to this findings, Llerena et al. (2015) found that concentrations of 4 mg/l in the irrigation water controlled the pathogen M. fijiensis, that resulted in a better performance of banana trees. Mitsugi et al. (2014) found that concentrations of 86 g/m3 applied to 1000g soil samples at flow rates of 1.5 l/min with application times between 1 and 3 hous, showed different effects on growth of radish plants. Both the lowest and highest time of applications showed an increase on inorganic nitrogen on soil. Nevertlest applications of 1 hour showed significant higher stem length, and therefore, faster growht in comparison with control and application times of 3 hours. This study shows that the higher dozes of ozone produced ph reductions in soil surface and 3 cm under soil surface from 6.8 to 4.7 and 5.9 respectively, disturbing plant growth. Thus, there is an optimum ozone doze for plant growth that avoid the problems of soil acidity and promote plant development, but they concluded that more research on this subject must be performed.. Chan et al. (2007) made one of the few studies that evaluated the response plants to ozonated water irrigation. They used concentrations between 0.5-1.5 ppm and found that the use of low and medium concentrations enhanced plant coverage, fresh weight,. 27.
(31) antioxidant enzymes and antioxidant. They conclude that the response of plant to ozonated irrigation vary among plant species and growth stages. Regardless of this results, this study did not specified flow rate and time of irrigation in order to assert an optimum doze of ozone application.. All these studies suggest the existence of different mechanism throught wich ozone enhance plant growth. In this study, the dozes applied did not had an impact on soil microorganism, thus the result on plant growth are not explained by a possible sterilization of soil pathogens. On the other hand, no effect of ozone on soil oxygenation was observed, suggesting that the parameters measured in this study were not enough to understand influence of ozone in the growth of lettuce plants.. 1.4.6.. Visual appreciation of food safety. Through the development of this study, visual differences on food safety between surface and subsurface drip irrigation could be observed. While in SDI lines under the surface are not in direct contact with the crops, in T1 it was a common occurrence to see drip lines with dirt accumulation in direct contact with the leaves of lettuces (Figure 5). Additionally, drip tapes in the surface were more susceptible to damage and the occurrence of fissures. In these cases, the formation of puddles occurred. Therefore, critical hazard points that could affect the food safety were observer in surface drip irrigation.. 28.
(32) Figure 5. Accumulation of dirt in drip tapes in direct contact with the crop.. 1.5.. Conclusion. In this study, the use of ozone in irrigation water at low residual concentrations and dozes show no significant effect over the properties of soil (ODR, water content and microorganism). On the contrary, improves in lettuce growth were observed. The lack of effect on ODR could be attribuited to the complex kinetics that ozone decomposition have in soil that present difficulties to match the measurements with the reactions and moment where oxygen is released. The increase in weight of lettuce and the lack of risk to the microorganism of soil lead to the belief that low dozes of ozone used under subsurface drip irrigation systems are not only suitable agent to improve water quality, but also a mechanism that could grant secondary benefits on plant growth. This findings could help to increase the interest in the use of ozone as a new technology to enanche the microbiological water quality on orchards.. 29.
(33) 1.6. Resumen. El ozono es un gas que se ha utilizado como un efectivo agente desinfectante en superficies y aguas, ya sea en tratamiento de aguas residuales o como medida de desinfección de patógenos. Su uso se ha expandido en la industria alimentaria dada sus potenciales usos y su rápida descomposición que no deja residuos. También se ha utilizado como agente oxigenante dada la baja estabilidad del ozono el cual al descomponerse genera oxígeno molecular. En este estudio, se evaluó el uso de ozono aplicado vía riego subsuperficial, en propiedades físicas y biológicas del suelo (tasa de difusión de oxígeno, contenido de humedad, concentración de CO2 y presencia de microorganismos) y biomasa (peso fresco y peso seco), en 2 variedades de lechuga (Quenty y Galantine), durante 2 ciclos de producción. Los ensayos fueron realizados en condiciones de campo, en la localidad de Lampa, Región Metropolitana. Tres tratamientos fueron aplicados: (1) Riego por cinta convencional, (2) Riego por cinta enterrada, (3) Riego por cinta enterrada utilizando agua ozonada. Al medirse la concentración de ozono en el T3 esta se encontraba entre 0,4-0,7 ppm al final de las líneas de riego. La tasa de difusión de oxígeno (ODR), el contenido de humedad volumétrica (θ), el eflujo de CO 2 (SCE), y microorganismos presentes en el suelo, no mostraron diferencias entre tratamientos, mientras que sí se observó un efecto positivo y significativo del riego con agua ozonada (T3) en el peso fresco y seco de las lechugas. Lo anterior sugiere que el agua ozonada es una posible herramienta para mejorar producción y adelantar cosecha de hortalizas de hoja en suelos de baja aireación.. Palabras clave: Ozono, riego enterrado, suelos de baja aireción.. 30.
(34) 1.7. References Boone, F. R., and Veen, B. W. 1994. Chapter 11 - Mechanisms of Crop Responses to Soil Compaction. In Soane, B. D., and van Ouwerkerk, C. (Ed). 1994. Soil Compaction in Crop Production. Pp 237-264. Netherlands: Elsevier Science B. V. Chan, G.Y.S. 2007. Effects of ozonated water on antioxidants and phytomorores level of vegetables. Sustainable Agri-Food Industry Use of Ozone and Relative Oxidants. October 29- 31, 2007. Valencia, Spain Douh, B. and Khila, S. 2013. Effect of subsurface drip irrigation system depth on soil water content distribution at different depths and different times after irrigation. Larhyss Journal 13:7-16.. Ebihara, K., Takayama, M., Ikegami, T., Ogata, K., Stryczewska, H. D., Gyoutoku, Y., and Sakai, T. 2006. Development of Agricultural Soil Sterilization Using Ozone Generated by High Frequency Dielectric Barrier Discharge. Journal of Advanced Oxidation Technologies, 9(2).doi:10.1515/jaots-2006-0210. FAO. 2011. Preventing E. Coli in Food. Disponible on http://www.fao.org/food/foodsafety-quality/a-z-index/e-coli0/es/. Gil, P; Sellés, G; Ferreira, R., Barrera, C. 2009. Manual de riego para paltos y cítricos. V región, Chile. 146 pp. Glinski, J., and W. Stepniewski. 1985. Soil aeration and its role for plants. CRC Press, Boca Raton, Florida, USA.. Graham, T., Zhang, P., Woyzbun, E., & Dixon, M. 2011. Response of hydroponic tomato to daily applications of aqueous ozone via drip irrigation. Scientia Horticulturae, 129(3): 464–471. doi:10.1016/j.scienta.2011.04.019. Guzel-Seydim, Z. B., Greene, A. K., & Seydim, A. C. 2004. Use of ozone in the food industry.. LWT. -. Food. Science. and. Technology,. 37(4):. 453–. 460. doi:10.1016/j.lwt.2003.10.014. 31.
(35) Harding, K., Ntimbani, R., Mashwama, P., Mokale, R.,Mothapo, M., Gina, N., and Gina, D. 2013. Decomposition of Ozone in Water. Chemical Technology. 6-10.. Havelaar, A. H., Vazquez, K. M., Topalcengiz, Z., Muñoz-Carpena, R., and DANYLUK, M. D. 2017. Evaluating the U.S. Food Safety Modernization Act Produce Safety Rule Standard for Microbial Quality of Agricultural Water for Growing Produce. Journal of Food Protection, 80(11): 1832–1841.doi:10.4315/0362-028x.jfp-17-122. Instituto de Investigación Agraria. 2017. Manual de producción de lechuga (N°9). INIA. Retrieved from: http://www.inia.cl/manuales-de-produccion/. Jung, H., Sohn, K.-D., Neppolian, B., & Choi, H. 2008. Effect of soil organic matter (SOM) and soil texture on the fatality of indigenous microorganisms in intergrated ozonation and biodegradation. Journal of Hazardous Materials, 150(3): 809– 817. doi:10.1016/j.jhazmat.2007.05.032. KIM, J.-G., YOUSEF, A. E., and DAVE, S. 1999. Application of Ozone for Enhancing the Microbiological Safety and Quality of Foods: A Review. Journal of Food Protection, 62(9), 1071–1087.doi:10.4315/0362-028x-62.9.1071. Lamm, F.R. 2002. Advantages and disadvantages of subsurface drip pers, fewer laterals,. shallower. emitter. placement,. cheaper. irrigation.. Available. at. http://www.oznet.ksu.edu/sdi/Reports/2002/ ADofSDI.pdf (verified 26 Aug. 2004). Originally presented at In- (non-pressure compensated) emitters, and easier hanternational meeting on advances in drip/micro irrigation, Puerto dling of problematic or nonuniform conditions. The pro- de La Cruz, Tenerife, Canary Islands. 2–5 Dec. 2002. Kansas State posed method can be utilized as a safety factor for parUniversity, Colby, KS.. Landa-Fernández, I. A., Monje-Ramirez, I., and Orta, M. T. 2018. Tomato Crop Improvement Using Ozone Disinfection of Irrigation Water. Ozone: Science and Engineering. https://doi.org/10.1080/01919512.2018.1549474. 32.
(36) Letey, J., and L.H. Stolzy. 1964. Measurement of oxygen diffusion rates with the platinum microelectrode. I. Theory and equipment. Hilgardia 35:545-554.. Letey,J.1985.Relationship between soil physical properties and crop production. Adv. Soil Sci. 1:276– 294.. Lim, H.-N., Choi, H., Hwang, T.-M., & Kang, J.-W. (2002). Characterization of ozone decomposition in a soil slurry: kinetics and mechanism. Water Research, 36(1): 219–229. doi:10.1016/s0043-1354(01)00239-1. Llerena, A. et al. 2015. Relación de la concentración y frecuencia de aplicación de ozono con el nivel de daño de la Sigatoka Negra en banano, diseño de un protocolo de riego con agua ozonificada. Alternativas 16: 66-75.. Luo, Y., and Zhou, X. 2006. CHAPTER 2 - Importance and Roles of Soil Respiration. On Soil Respiration and the Environment, Academic Press,Pages 17-32.. Martínez, S. B., Pérez-Parra, J., & Suay, R. 2011. Use of Ozone in Wastewater Treatment to Produce Water Suitable for Irrigation. Water Resources Management, 25(9): 2109–2124. doi:10.1007/s11269-011-9798-x. McIntyre, D. S. (1970). The Platinum Microelectrode Method for Soil Aeration Measurement.. Advances. in. Agronomy.. 235–283.doi:10.1016/s0065-. 2113(08)60270-9.. Mitsugi, F., Abiru, T., Ikegami, T., Ebihara, K., Aoqui, S.-I., and Nagahama, K. (2016). Influence of Ozone Generated by Surface Barrier Discharge on Nematode and Plant. Growth.. IEEE. Transactions. on. Plasma. Science,. 44(12):. 3071–. 3076.doi:10.1109/tps.2016.2583664. Moore, G., Griffith, C. and Peters, A. 2000. Bactericidal Properties of Ozone and Its Potential Application as a Terminal Disinfectant. Journal of Food Protection, 63(8): 1100–1106. 33.
(37) Msayleb N., Ramesh Kanwar, J. (Hans) van Leeuwen, Alison Robertson, and Gregory Tylka. 2013. Soil disinfection with ozone (O3) as an alternative to methyl bromide a sustainable practice in agriculture. 2013 Kansas City, Missouri, July 21 - July 24. doi:10.13031/aim.20131597192. Newman, S.E. 2004. Disinfecting irrigation water for disease management. Paper presented at the 20th annual conference on pest management on ornamentals, San Jose, 20–22.. Pascual, A., Llorca, I., and Canut, A. 2007. Use of ozone in food industries for reducing the environmental impact of cleaning and disinfection activities. Trends in Food Science and Technology, 18: S29–S35.doi:10.1016/j.tifs.2006.10.006.. Phillips, C. L., & Nickerson, N. (2015). Soil Respiration. Reference Module in Earth Systems and Environmental Sciences. doi:10.1016/b978-0-12-409548-9.09442-2. Plauborg, F., Andersen, M. N., Liu, F., Ensink, J., & Ragab, R. (2010). Safe and high quality food production using low quality waters and improved irrigation systems and management: SAFIR. Agricultural Water Management, 98(3):377–384. doi:10.1016/j.agwat.2010.05.020. Remondino, M., and Valdenassi, L. 2018. Different Uses of Ozone: Environmental and Corporate Sustainability. Literature Review and Case Study. Sustainability, 10(12): 4783. doi:10.3390/su10124783. Röhr, A., Lüddecke, K., Drusch, S., Müller, M. J., and Alvensleben, R. v. 2005. Food quality and safety––consumer perception and public health concern. Food Control, 16(8): 649–655. doi:10.1016/j.foodcont.2004.06.001. Runia, W.Th. (1994). Disinfection of recirculation water from closed cultivation systems with. ozone.. Acta. Hortic.. 361,. 388-396. doi: 10.17660/ActaHortic.1994.361.39. 34.
(38) Ryan, M. G., and Law, B. E. (2005). Interpreting, measuring, and modeling soil respiration. Biogeochemistry, 73(1): 3–27. doi:10.1007/s10533-004-5167-7. Soussa, H.K. 2010. Effects of drip irrigation water amount on crop yield, productivity and efficiency of water use in desert regions in Egypt. Nile Basin Water Sci. Eng. J . 3: 96–109. Stryczewska, H. D., Pawłat, J., & Ebihara, K. (2013). Non-Thermal Plasma Aided Soil Decontamination.. Journal. of. Advanced. Oxidation. Technologies,. 16(1).. doi:10.1515/jaots-2013-0103. Vázquez-Ybarra, J. A., Peña-Valdivia, C. B., Trejo, C., Villegas-Bastidas, A., BenedictoValdéz, S. and Sánchez-García, P. 2015. Promoting growth of lettuce plants (lactuca sativa l.) with sublethal ozone doses applied to culture medium. Rev. Fitotec. Mex. Vol. 38 (4): 405 – 413.. Yagüe, J. L. 1999. Técnicas de Riego. México. Mundi-Prensa México, S.A De CV.. Yu, D.-Y., Bae, W., Kang, N., Banks, M. K., and Choi, C.-H. 2005. Characterization of Gaseous Ozone Decomposition in Soil. Soil and Sediment Contamination: An International Journal, 14(3): 231–247.doi:10.1080/15320380590928302.. Zhang, X., Guo, Q., Shen, X., Yu, S., and Qiu, G. (2015). Water quality, agriculture and food. safety. management.. in. China: Journal. Current of. situation,. Integrative. trends,. Agriculture,. interdependencies, 14(11):. and. 2365–2379.. doi:10.1016/s2095-3119(15)61128-5.. 35.
(39) 2.. Water quality for agricultural use: In-situ analysis of two innovative methodologies for water quality improve and their effects on the agricultural system: Evaluation of the use of buffer strips for enhance physics and microbiological characteristics of water Erick Bastián Bueno Buker Pontificia Universidad Católica de Chile. 2.1. Abstract. Erick Bastián Bueno Buker. Water quality for agricultural use: In-situ analysis of two innovative methodologies for water quality improve and their effects on the agricultural system: Evaluation of the use of buffer strips for enhance physics and microbiological characteristics of water . Tesis, Magister en Fisiología de la Producción Vegetal, Pontificia Universidad Católica de Chile. Santiago, Chile. Fresh vegetable production requires a high water quality of the sources used for irrigation in order to avoid major hazard points that affect food safety and consumers health. Apart from diffuse pollution of water,sediment load is one of the major factors that worsen water quality when carries soil particles and absorbed chemicals. The use of vegetated buffer strips (VBS) had arisen as a best management practice that intercept sediments and pollutants via infiltration and deposition, avoiding the contamination of surface waters. In this study, the effect of the use of three different species as VBS on water microbiological and physic quality was evaluated. The treatments were applied to border strips of 3x11 m, where the following vegetation covers were applied: (a) bare soil without vegetation, (b) Festuca arundinacea (tall fescue), (c) Cortaderia seollana, and (d) the combination of Cyperus papyrus and Cyperus alternifolia. In all the strips, irrigation hoses with sluicegates were installed in order to applied regulated flow rates of water, and PVC gutters were placed at the bottom side to allow the exit and collection of waters. To evaluate the effect of buffer strips on water quality, samples of water were collected at the end of the trial and carried to laboratory for fecal coliforms (FC) and total suspended solids (TSS) analysis. Also, sediment accumulation was measured in four points of the strips. Sediment accumulations higher than control and Cyperaceous species, suggest the suitability of. 36.
(40) F. arundinacea and C. seollana to be used as buffer strip, while results of water quality suggest the importance of vegetation cover for achieve a high buffer strip efficiency.. Key words: Water quality, vegetated buffer strips, sediment, fresh vegetables.. 2.2.. Introduction.. 2.2.1. Water quality problems.. Agriculture is one of the major consumers of water worldwide, reaching a 70% of use from the existent sources (Ongley, 1996; FCH, 2018), and its increasing expansion have generated limited resources of water left in rivers and aquifers (Sharma et al., 2015). On the other hand, agricultural and forestry activities are major responsible for the diffuse pollution of water (González, 2007), causing surface and groundwater resources degradation, through erosion and chemical runoff (Ongley, 1996). Contamination with agrochemicals like pesticides and herbicides and salt and nutrient loads, are some of the factors that worsen water quality (Scanlon et al., 2007).. In addition to this, water scarcity has become a major problem worldwide. In Chile, on august of 2019, seventeen communes of the Metropolitan region were labeled as agricultural emergency zones due to water scarcity problems, where precipitations show a deficit of 70% (Minagri, 2019).. The combination of this two scenarios and the consequent decrease of sources with the water quality and quantity required, have become a major concern nowadays (Sharma et al., 2015), considering that the existence of this sources are fundamental to achieve an optimal food production and safety in agriculture (Zhang et al., 2015). This problem affects greatly to fresh vegetable production, where most of its products are fresh consumed and requires a high water quality of the sources used for irrigation in order to avoid major hazard points that affect food safety, mostly caused by pathogens such as Escherichia coli, considered as an indicator of fecal contamination of water and food,. 37.
(41) responsible of the proliferation of gastrointestinal diseases, that in extreme cases can cause vital risks for humans (FAO, 2011).. 2.2.3. Sediment deposition and buffer strips. When factors that worsen water quality are analyzed, sediment deposition arise as one major pollutant (Liu et al., 2008). Sediments cause water pollution affecting the physical quality of water leading to excessive turbidity, and the chemical quality when soil particles carries adsorbed chemicals like phosphorus, chlorinated pesticides and metals, mostly provided by agricultural activities (Ongley, 1996). Also, bacteria attachment to sediment particles is an important factor that have effect on the contamination level of water (Wu et al., 2019). Considering the problems that sediments and agricultural activities cause on water quality, the implementation of systems that enhance water quality and minimize water sources pollution, must be one of the main concerns in agriculture for the sake of achieve the quality requirements demanded by consumers and clients around the world.. In the interest of control this problems, the use of vegetative buffer strips (VBS) has arisen as a best management practice (BMP) that allows to enhance water quality from agricultural and nature systems ( Dillaha et al., 1989; Liu et al., 2008). Buffer strips are areas of permanent vegetation that intercept and reduce runoff velocity, allowing sediment filtration, infiltration and deposition (Helmers et al., 2008; Blanco and Lal, 2010; Lobo and Bonilla, 2017). There are a wide range of buffers strips either in agricultural or nature systems. Some of them are riparian buffers, filter strips, grass barriers, grassed waterways, field borders, and windbreaks. Their design, management. vegetation type, density and height, and width and length vary among them (Blanco and Lal, 2010). Nevertheless, Festuca arundinacea (tall fescue), a cool season and long lived perennial grass (CABI, 2018), is commonly used as grass strip on agricultural systems, mostly due to its large root development and ability to grow in a wide variety of soils and climatic conditions (Scarponi et al., 2009). Nonetheless, the species used. 38.
(42) must guarantee an appropriate height and vegetative cover that contact the water flow (Dillaha et al., 1989; Helmers et al., 2008).. The objective of this study was to evaluate the effect of the use of three different species as VBS on water microbiological and physic quality of irrigation water after entering the orchard.. 2.3. Material and methods. The use of three different species as buffer strips and their effect in the physic and microbiological water quality were evaluated. A field trial in Pirque ( 33°40’22’’ S, 70° 35’6’’ W), Santiago, was conducted over a year between march of 2018 and may of 2019. The trial was performed in Fundación Agro UC Pirque, where a site of 700 m 2 was selected (Figure 1).. In this zone the source of water used for agriculture is supplied by the Maipo river that fulfill the 90% of the irrigation water necessities of the Metropolitan Region (Niemeyer, 1982). The most common characteristic of its waters is the excessive turbidity (Venegas, 2006), produced by the presence of important mining operations placed on its major tributaries like Volcan river (Niemeyer, 1982). On the other hands, the high suspended solid load due to sediment drag from high mountain is other major factor that promotes the presence of permanent turbidity on its waters (Venegas, 2006).. 39.
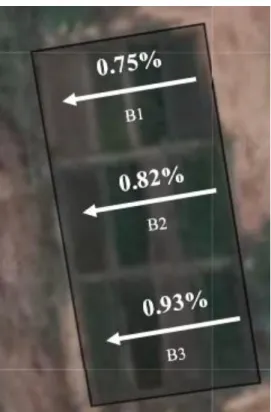
(43) Figure 1. Experimental site and differences in slope as factor to make a randomized complete block design of three blocks (B1, B2 and B3).. 2.3.1. Experimental design Due to slight differences of slope in the site (Figure 1), a randomized complete block design with three blocks was considered for the experimental design. The experimental units were border strips of 3 x 11 m, where four treatments were applied, each with three repetitions. In all the strips, a slope off 0.84% was considered (Figure 2).. Soil barriers of 10-15 cm tall were placed at the edges of each strip to maintain the water flow inside the strip and to prevent water ingress from the collection ditches.. 40.
(44) Figure 2. Buffer strip design. Each strip have 11 m in length and a slope of 0.84%. At the upper side, the waters enters via an irrigation hose with sluicegates . At the bottom of the buffer strips, the water exits the system to a collection ditch through a PVC gutter. Dashed lines show the position of the rulers. Adapted from Sullivan et al. (2007). The specifications of the treatments are as follow: a. Negative control (T0): consist in bare soil and no use of vegetative species. b. Positive control (T1): Consist in the use of Festuca arundinacea (tall fescue) c. Treatment 2 (T2): Consist in the use of Cortaderia seollana, an erect perennial species of the Poaceae family native to South America. This species can grow up to 2-4 m in tall and 1-2 m in width (CABI, 2018). d. Treatment 3 (T3): Consist in the combination of two species from the Cyperaceous family, Cyperus papyrus and Cyperus alternifolia. C. papyrus is commonly known for its importance in the production of paper (papyrus) and other fabrics and can growth up to 5 m tall (CABI, 2018). C.alternifolia is a stove grass that can grow in a wide variety of soils and can reach a height of 61 cm approx. (Pink, 2004).. Although C. seollana and C.alternifolia are considered aggressive and invasive species in some countries (CABI, 2018), they are also used as ornamental plants. 41.
Figure


+7


Documento similar