TítuloEffect of an educational intervention in primary care physicians on the compliance of indicators of good clinical practice in the treatment of type 2 diabetes mellitus [OBTEDIGA project]
10
0
0
Texto completo
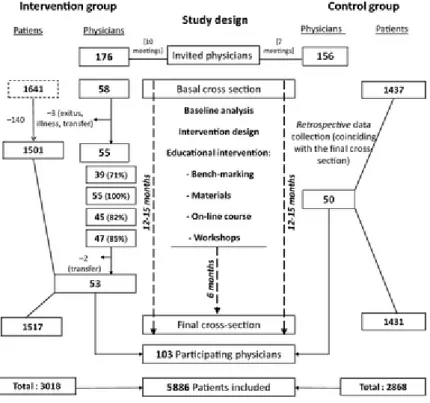
(2) Methods Study design The study was conducted in Galicia (north-west Spain) and consisted of two independent cross-sectional evaluations performed 1 year apart (2008 and 2009). Between the evaluations, an intervention was implemented among the physicians of the intervention group (IG). In the control group (CG), baseline data collection was done retrospectively, coinciding with the final evaluation (Figure 1).. Figure 1. Participation and study design flow-chart. Participants Participating physicians were selected by stratified random sampling (by primary care area) from the list of physicians with a stable job, without any intention to change place of work in the immediate future and with an assigned population of at least 500 people aged 40 or over. The control group was recruited immediately before the second cut to avoid modifications in behaviour between the evaluations owing to participation in the study. Selection of diabetic patients Each participating physician provided information from 30 diabetic patients, randomly selected from the total list of diabetic patients aged 40 years and above and with more than 1 year of diagnosis of type 2 diabetes. There were two independent sampling processes. Women with gestational diabetes were excluded from the study. Sampling considerations Sample size was calculated to detect an absolute difference of 5% between the two groups at the end of the intervention in accomplishment of the indicators analysed, assuming a proportion of 50% in the control group and with errors α = 0.05 and β = 0.2 (power = 0.8).
(3) Data collection Participating physicians answered a questionnaire with demographic characteristics and data from their workplace, whereas information on the patients was obtained from the patient medical records by a team of independent trained nurses. This included: social and demographic data, family and personal history of disease, characteristics of the patient's diabetes, anthropometry and analytical data. Body mass index (BMI) was computed (weight/height2) and classified as normal (18.5 ≤ BMI < 25), overweight (25 ≤ BMI < 30) and obesity (BMI ≥ 30). The criterion of Adult Treatment Panel- III (ATP-III) was used for central obesity (waist circumference ≥ 102 centimetres in men and ≥ 88 centimetres in women). Indicators used to assess quality of care, derived from the ‘Health Plan’ of Galicia [27], were previously defined in detail [26]. Educational intervention Baseline results [26] were used to identify needs and define the intervention to be implemented in the IG. It comprised the following activities through 6 months: Bench-marking (audit and feedback) Overall results were presented to the participating physicians in a group session. Every physician received the data from his/her own practice, which allowed him/her to compare every indicator with peers. Teaching activities (i) Delivery of printed material on DM-2: a Clinical Guide and materials to facilitate (developing automatisms) the management of the diabetic patient. (ii) A comprehensive on-line course that included reading and reference materials, learning tasks (problem-solving based on clinical scenarios) and other teaching resources (forum, tutorial and case-resolution). The course also included a final test to evaluate the students. Those who completed the course were given 12.5 h in CME credits. The on-line platform that remained open 1 month permitted adapting the completion of the course to the personal time availability of every participating physician thus facilitating completion of the course. (iii) Face-to-face training workshops on management of type 2 diabetes: in 1 day, there were three consecutive workshops of 90 min each on the following topics: (i) diagnosis, management and control objectives in DM-2; (ii) therapeutic update in type 2 diabetes; (iii) how to explore the diabetic foot. CME credits were given to the participating physicians in the workshops. Statistical analysis Mean and standard deviation (SD) or proportion were used to describe the characteristics of physicians and patients. In every evaluation (baseline and final), IG and CG were compared by means of Student ttest, Mann–Whitney U-test or Chi-squared (adjusted by the cluster effect of the physician). Proportion (and 95% confidence interval) of compliance of every quality indicator was estimated in every group (IG and CG) and the hypothesis of equality pre- and post-intervention was tested by means of corrected Chi-square. In the final evaluation, a logistic regression model was developed to compare the fulfilment of criteria between the intervention and control groups. The dependent variable in each model was the corresponding indicator (1 = compliant, 0 = non-compliant) and the independent variable was the group (intervention-control); other variables included in the model for adjustment were characteristics of the patient and the proportion of compliance of each physician at baseline. Finally, the physician was considered as a clustering variable to adjust the variance. The adjustment variable was defined as follows: (i) the percentages of compliance of each doctor in the baseline were calculated, (ii) each patient's final cross-section was given the basal rate for their physician. CG was the reference group for calculating the adjusted OR: therefore, an OR > 1 indicated that belonging to the IG improved the performance of the indicator, and an OR < 1 indicated that it worsened the performance. Adjusted OR and 95% confidence intervals are presented..
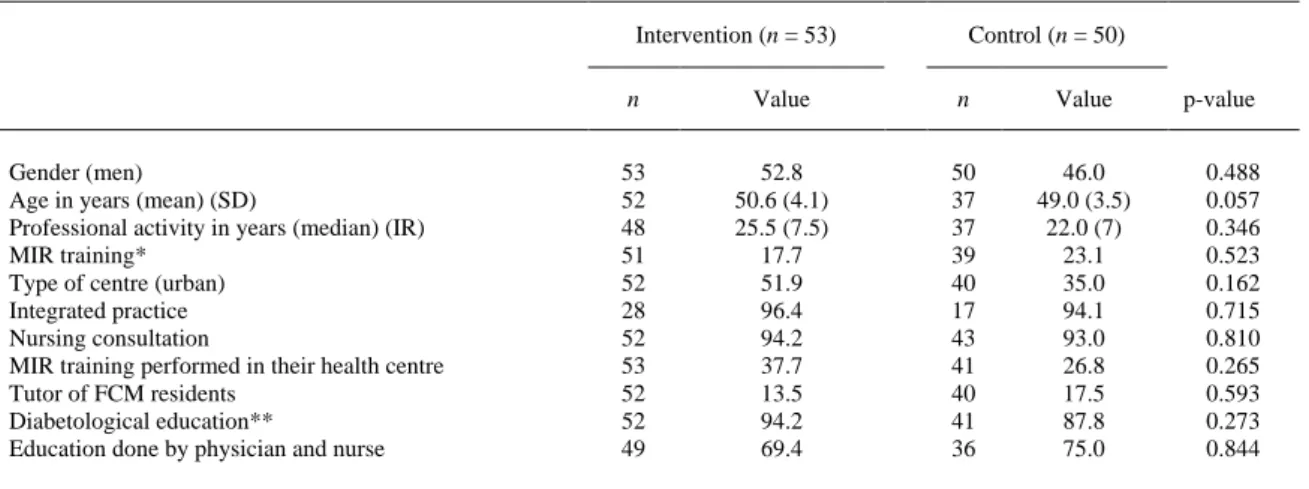
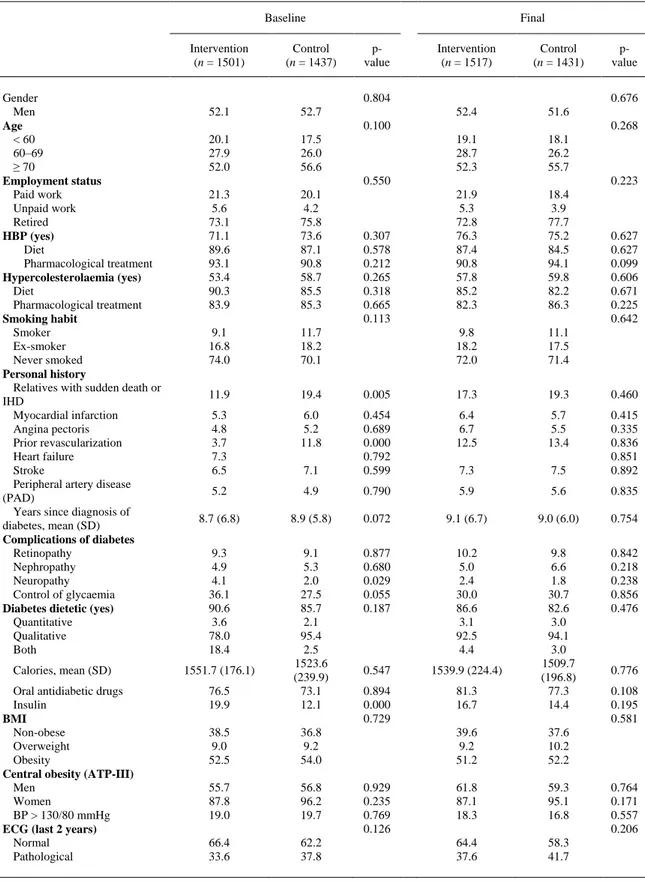
(4) Ethical issues The study was approved by the Ethical and Clinical Research Committee of Galicia. All patients received information about the study and signed an informed consent form. Information from diabetic patients was collected anonymously and the individual evaluations of physicians were treated as confidential. Results Five of the 58 physicians of the IG did not complete the study for important reasons (death, illness and three changes of workplace), giving a completion rate of 91%. Data for the remaining 53 physicians who completed the study are presented in Figure 1. Regarding participation in the different components of the intervention: (i) Every physician (100%) in the IG received the feedback information in electronic support and the written materials in his workplace. (ii) 71% attended the presentation of baseline results and bench-marking. (iii) 82% followed the on-line course and 85% participated in the formative workshops on diabetes. Overall, 76% of the physicians participated in at least two of the three components of the intervention (42% participated in all three). There are no differences between the two groups in the characteristics of the physicians and their clinical practices (Table 1).. Table 1. Characteristics of primary care physicians. Comparison of the groups Intervention (n = 53). Gender (men) Age in years (mean) (SD) Professional activity in years (median) (IR) MIR training* Type of centre (urban) Integrated practice Nursing consultation MIR training performed in their health centre Tutor of FCM residents Diabetological education** Education done by physician and nurse. Control (n = 50). n. Value. n. Value. 53 52 48 51 52 28 52 53 52 52 49. 52.8 50.6 (4.1) 25.5 (7.5) 17.7 51.9 96.4 94.2 37.7 13.5 94.2 69.4. 50 37 37 39 40 17 43 41 40 41 36. 46.0 49.0 (3.5) 22.0 (7) 23.1 35.0 94.1 93.0 26.8 17.5 87.8 75.0. p-value 0.488 0.057 0.346 0.523 0.162 0.715 0.810 0.265 0.593 0.273 0.844. Results in percentages (unless otherwise stated). IR, interquartile range. *MIR training: professionals who were trained in family and community medicine (FCM) for at least 3 years after graduating in Medicine. †Type of centre where they work (urban or rural). ‡Integrated practice: Full time family physicians. §Nursing consultation: Nurse who has her own and independent consultation from the physician. ¶Tutor of FCM residents: the participating physician is tutor of FCM physicians in training. **Diabetological education: Diabetic patients are educated in diabetes.. Table 2 compares the groups of patients. Differences between the intervention and control groups are slight and not statistically significant, except for some variables at baseline such as family history of ischaemic heart disease, personal history of prior coronary revascularisation, presence of neuropathy and insulin use. Some differences in the variables favour one group and others the other one..
(5) Table 2. Characteristics of patients included. Comparison between intervention and control groups at baseline and final exam Baseline. Gender Men Age < 60 60–69 ≥ 70 Employment status Paid work Unpaid work Retired HBP (yes) Diet Pharmacological treatment Hypercolesterolaemia (yes) Diet Pharmacological treatment Smoking habit Smoker Ex-smoker Never smoked Personal history Relatives with sudden death or IHD Myocardial infarction Angina pectoris Prior revascularization Heart failure Stroke Peripheral artery disease (PAD) Years since diagnosis of diabetes, mean (SD) Complications of diabetes Retinopathy Nephropathy Neuropathy Control of glycaemia Diabetes dietetic (yes) Quantitative Qualitative Both Calories, mean (SD) Oral antidiabetic drugs Insulin BMI Non-obese Overweight Obesity Central obesity (ATP-III) Men Women BP > 130/80 mmHg ECG (last 2 years) Normal Pathological. Intervention (n = 1501). Control (n = 1437). 52.1. 52.7. 20.1 27.9 52.0. 17.5 26.0 56.6. 21.3 5.6 73.1 71.1 89.6 93.1 53.4 90.3 83.9. 20.1 4.2 75.8 73.6 87.1 90.8 58.7 85.5 85.3. 9.1 16.8 74.0. 11.7 18.2 70.1. 11.9. 19.4. 5.3 4.8 3.7 7.3 6.5. 6.0 5.2 11.8. Final pvalue. Intervention (n = 1517). Control (n = 1431). 52.4. 51.6. 19.1 28.7 52.3. 18.1 26.2 55.7. 21.9 5.3 72.8 76.3 87.4 90.8 57.8 85.2 82.3. 18.4 3.9 77.7 75.2 84.5 94.1 59.8 82.2 86.3. 9.8 18.2 72.0. 11.1 17.5 71.4. 0.005. 17.3. 19.3. 0.460. 6.4 6.7 12.5. 5.7 5.5 13.4. 7.1. 0.454 0.689 0.000 0.792 0.599. 7.3. 7.5. 0.415 0.335 0.836 0.851 0.892. 5.2. 4.9. 0.790. 5.9. 5.6. 0.835. 8.7 (6.8). 8.9 (5.8). 0.072. 9.1 (6.7). 9.0 (6.0). 0.754. 9.3 4.9 4.1 36.1 90.6 3.6 78.0 18.4. 0.877 0.680 0.029 0.055 0.187. 10.2 5.0 2.4 30.0 86.6 3.1 92.5 4.4. 0.547. 1539.9 (224.4). 0.894 0.000 0.729. 81.3 16.7. 9.8 6.6 1.8 30.7 82.6 3.0 94.1 3.0 1509.7 (196.8) 77.3 14.4. 0.842 0.218 0.238 0.856 0.476. 76.5 19.9. 9.1 5.3 2.0 27.5 85.7 2.1 95.4 2.5 1523.6 (239.9) 73.1 12.1. 38.5 9.0 52.5. 36.8 9.2 54.0. 39.6 9.2 51.2. 37.6 10.2 52.2. 55.7 87.8 19.0. 56.8 96.2 19.7. 61.8 87.1 18.3. 59.3 95.1 16.8. 66.4 33.6. 62.2 37.8. 64.4 37.6. 58.3 41.7. 0.804. 0.676. 0.100. 0.268. 0.550. 1551.7 (176.1). 0.307 0.578 0.212 0.265 0.318 0.665 0.113. 0.929 0.235 0.769 0.126. pvalue. 0.223. 0.627 0.627 0.099 0.606 0.671 0.225 0.642. 0.776 0.108 0.195 0.581. 0.764 0.171 0.557 0.206. Results in percentages (unless otherwise stated). HBP, high blood pressure (if mean arterial pressure is above 130/80); IHD, ischaemic heart disease; BMI, body mass index; ATP-III, Central obesity according to the ‘Adult Treatment Panell III’; BP, blood pressure; ECG, electrocardiogram..
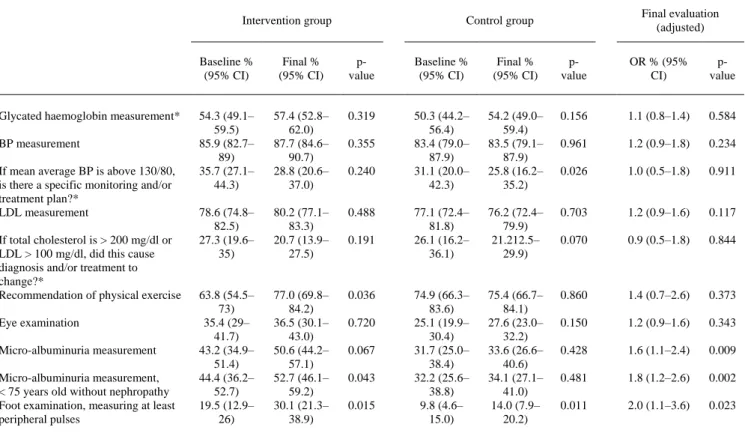
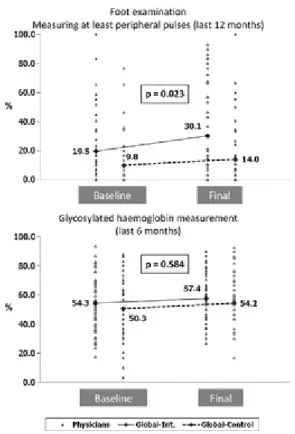
(6) The degree of accomplishment of the indicators in each group before and after the intervention and the comparison of the two groups in the final exam are presented in Table 3. All indicators related to the measurement of risk factors (blood pressure, LDL-cholesterol) have a compliance rate of more than 75% in both groups and at baseline and final exam. The IG had statistically significant improvement in both the micro-albuminuria and foot examination indicators.. Table 3. Quality of care. Absolute degree of compliance of indicators in both groups before and after educational intervention and comparison between both groups at the final cross-section Intervention group. Glycated haemoglobin measurement* BP measurement If mean average BP is above 130/80, is there a specific monitoring and/or treatment plan?* LDL measurement If total cholesterol is > 200 mg/dl or LDL > 100 mg/dl, did this cause diagnosis and/or treatment to change?* Recommendation of physical exercise Eye examination Micro-albuminuria measurement Micro-albuminuria measurement, < 75 years old without nephropathy Foot examination, measuring at least peripheral pulses. Final evaluation (adjusted). Control group. Baseline % (95% CI). Final % (95% CI). pvalue. Baseline % (95% CI). Final % (95% CI). pvalue. OR % (95% CI). pvalue. 54.3 (49.1– 59.5) 85.9 (82.7– 89) 35.7 (27.1– 44.3). 57.4 (52.8– 62.0) 87.7 (84.6– 90.7) 28.8 (20.6– 37.0). 0.319. 50.3 (44.2– 56.4) 83.4 (79.0– 87.9) 31.1 (20.0– 42.3). 54.2 (49.0– 59.4) 83.5 (79.1– 87.9) 25.8 (16.2– 35.2). 0.156. 1.1 (0.8–1.4). 0.584. 0.961. 1.2 (0.9–1.8). 0.234. 0.026. 1.0 (0.5–1.8). 0.911. 78.6 (74.8– 82.5) 27.3 (19.6– 35). 80.2 (77.1– 83.3) 20.7 (13.9– 27.5). 0.488. 77.1 (72.4– 81.8) 26.1 (16.2– 36.1). 76.2 (72.4– 79.9) 21.212.5– 29.9). 0.703. 1.2 (0.9–1.6). 0.117. 0.070. 0.9 (0.5–1.8). 0.844. 63.8 (54.5– 73) 35.4 (29– 41.7) 43.2 (34.9– 51.4) 44.4 (36.2– 52.7) 19.5 (12.9– 26). 77.0 (69.8– 84.2) 36.5 (30.1– 43.0) 50.6 (44.2– 57.1) 52.7 (46.1– 59.2) 30.1 (21.3– 38.9). 0.036. 74.9 (66.3– 83.6) 25.1 (19.9– 30.4) 31.7 (25.0– 38.4) 32.2 (25.6– 38.8) 9.8 (4.6– 15.0). 75.4 (66.7– 84.1) 27.6 (23.0– 32.2) 33.6 (26.6– 40.6) 34.1 (27.1– 41.0) 14.0 (7.9– 20.2). 0.860. 1.4 (0.7–2.6). 0.373. 0.150. 1.2 (0.9–1.6). 0.343. 0.428. 1.6 (1.1–2.4). 0.009. 0.481. 1.8 (1.2–2.6). 0.002. 0.011. 2.0 (1.1–3.6). 0.023. 0.355 0.240. 0.191. 0.720 0.067 0.043 0.015. *Last 6 months; †Last 12 months; ‡Last 24 months; §The variance of the ORs was adjusted in every model by the cluster effect of several patients being treated by the same physician. The logistic regression model for every indicator also included as covariate the baseline situation for that particular indicator (see 'Methods'). LDL, low-density lipoprotein.. Figure 2 shows an example of two indicators with different responses to the intervention. For the foot examination during the last year, there was improvement in the IG (from 19.5% to 30.1%) compared with the CG (from 9.8% to 14%) (p = 0.023). Measuring the glycated haemoglobin in the past 6 months improved similarly in both groups (p = 0.584)..
(7) Figure 2. Foot examination and glycosylated haemoglobin measurement. Compliance and difference between intervention and control groups./LEGEND: The p-value shows the signification of the OR. The OR compares the compliance of the corresponding indicator in the IG vs. the CG in the final evaluation, adjusting for baseline situation. Discussion This study shows that an intervention such as the one performed here, including an audit with personalised feedback and teaching activities (face-to-face and on-line), can achieve improvements of modest magnitude in selected quality of care indicators among diabetic patients, especially those who are far from optimal compliance at baseline. This finding largely corresponds with that presented in other studies [24, 28, 29], especially those where multifactorial interventions have been performed. In our case, the designed intervention aimed at primary care physicians in the public health system was based on the results of a baseline study [26] to be viable in our health system and repeatable in the future. Within a multifactorial intervention such as the one performed here (the type recognised as the most useful) [28-34], it is very difficult to assess the effectiveness of each of the procedures, but it would be of great help to be able to focus efforts on these activities. In our project, special relevance was given to the audit and feedback, as well as the activities of interactive format (face-to-face workshops, on-line courses). These, generally, have proved to be more useful than didactic materials [23, 28, 30, 31, 35-38]. This is particularly true when high participation is achieved, as in this case. As regards the materials used, we believe that some such as the ‘leaflet’ pocket or desk material may, by virtue of their ease of access and readability, be useful for the development of automatisms in clinical practice. It has been reported that concentrating on just a few specific issues with a low degree of compliance improves the outcome [23, 33, 36, 39]. Our intervention was not directed specifically at these issues, but the analysis at baseline allowed us to identify key points where the situation was worse and consider them in designing the intervention. This may partly explain the improvement in some indicators. For example, there was a workshop specifically dedicated to the examination of the foot, and in another, in which the follow-up plan was reviewed, we discussed the indicators with lowest compliance. In addition, benchmarking and corresponding feedback allow every physician to make the necessary improvements. Special consideration needs to be given to the examination of the eye, in which, despite low baseline compliance, no significant improvement was observed. A possible explanation may be that this exploration in Spain is predominantly performed by an ophthalmologist, to whom the patient has to be.
(8) referred. This process may complicate and slow down the accomplishment of this indicator, particularly considering the usual long delay between the time of the referral and the appointment with the ophthalmologist. This is one of those barriers attributable to the system, which in many cases are more difficult to address [25] and may explain part of the gap between knowledge and usual clinical practice [40], which cannot be modified by the intervention performed. One possible limitation is the ‘Hawthorne’ effect, i.e. improvement attributable to being observed. Although the health administration did not take part and all information was treated anonymously, the IG, but not the CG, was aware of being evaluated. Our interpretation is that knowing that one is being evaluated can be considered part of the intervention, something to be considered in future improvement programmes. Another potential limitation is the possibility of ‘contamination’ of the CG by the IG, as both worked in the same healthcare system. Although this cannot be entirely ruled out, we tried to limit the damage by the late inclusion of the CG in the study and the retrospective collection of basal data in this group. The low participation rate of physicians (32 and 33% in both IG and CG) may limit the generalisability of the results. Although it is difficult to verify, in favour of the study, we do know that the participating physicians do not differ in basic characteristics from the population from which they derive [26], suggesting non-selective participation. It should also be mentioned that the intervention, although multifactorial, is only aimed at the physician. Although it is known that effectiveness improves when all team members are involved and there is an opportunity to make structural changes [28, 41-44], this was considered unfeasible in our case. One of the strengths and a singularity of our study is the analysis by participating physicians. The fact that the information was collected by independent teams reduced the possibility of bias as well as the workload of the participating physicians, facilitating their participation. There is still room for improvement in type 2 diabetes care, particularly in some of these indicators. It is necessary to continue efforts to identify effective interventions that could improve them further, such as those that treat the entire organisational system and target all the team members capable of modifying complex problems. The main conclusion of this study is that the identification of variables with very poor compliance and the implementation of a simple intervention among physicians aimed to correct them are effective in the improvement of the quality of care of diabetic patients. Acknowledgements This study was partially financed by an unrestricted grant from Merck Sharp & Dohme (MSD) -Spain and the Fundación Escola Galega de Administración Sanitaria (FEGAS). Neither MSD nor FEGAS participated in the study design, data analysis or the preparation of this manuscript. JMG and TRPC are researchers from the RECAVA network (Instituto de Salud Carlos III. Madrid). Author contributions Vidal Pardo, JI: as the lead investigator contributed to the study concept and participated in study design, fund-raising, recruitment of participants, administration of the intervention, writing of the manuscript and critical revision of the article. Pérez Castro, TR: contributed to recruitment of participants, fieldwork coordination in monitoring of patients, writing of the manuscript and critical revision of the article. López Álvarez, XL: A contributed to recruitment of participants, administration of the intervention, writing of the manuscript and critical revision of the article. García Soidán, FJ: contributed to recruitment of participants, administration of the intervention and critical revision of the article. Santiago Pérez, MI: contributed to statistical data analysis and critical revision of the article. Muñiz Garcia, J: contributed to the study concept, and participated in its design, fund-raising, recruitment of participants, administration of the intervention, writing of the manuscript and critical revision of the article. All the authors have read and given their approval to the final manuscript..
(9) References 1. Soriguer F, Goday A, Bosch-Comas A et al. Prevalence of diabetes mellitus and impaired glucose regulation in Spain: the Diabet.es Study. Diabetologia 2012; 55: 88–93. 2. Wild S, Roglic G, Green A et al. Global prevalence of diabetes: estimates for the year 2000 and projections for 2030. Diabetes Care 2004; 27: 1047–53. 3. American Diabetes Association. Economic costs of diabetes in the U.S. in 2007. Diabetes Care 2008; 31: 596–615. 4. DECODE Study Group. Age- and sex-specific prevalences of diabetes and impaired glucose regulation in 13 European cohorts. Diabetes Care 2003; 26: 61–9. 5. UK Prospective Diabetes Study Group. Intensive blood-glucose control with sulphonylureas or insulin compared with conventional treatment and risk of complications in patients with type 2 diabetes (UKPDS 33). Lancet 1998; 352: 837–53. 6. Sjølie AK, Stephenson J, Aldington S et al. Retinopathy and vision loss in insulin-dependent diabetes in Europe. The EURODIAB IDDM Complications Study. Ophthalmology 1997; 104: 252–60. 7. Martínez-Castelao A, De Alvaro F, Górriz JL. Epidemiology of diabetic nephropathy in Spain. Kidney Int Suppl 2005; 99: S20–4. 8. Martin S, Schramm W, Schneider B et al. Epidemiology of complications and total treatment costs from diagnosis of Type 2 diabetes in Germany (ROSSO 4). Exp Clin Endocrinol Diabetes 2007; 115: 495–501. 9. Giorda CB, Manicardi V, Diago Cabezudo J. The impact of diabetes mellitus on healthcare costs in Italy. Expert Rev Pharmacoecon Outcomes Res 2011; 11: 709–19. 10. Krans H, Porta M, Keen H. Diabetes Care and research in Europe. The Saint Vincent Declaration Action Programme. Ginebra: WHO Regional Office for Europe, 1992. 11. Nicolucci A, Greenfield S, Mattke S. Selecting indicators for the quality of diabetes care at the health systems level in OECD countries. Int J Qual Health Care 2006; 18 (Suppl. 1): 26–30. 12. Wens J, Dirven K, Mathieu C et al. Quality indicators for type-2 diabetes care in practice guidelines: an example from six European countries. Prim Care Diabetes 2007; 1: 17–23. 13. Mata-Cases M, Roura-Olmeda P, Berengué-Iglesias M et al. Fifteen years of continuous improvement of quality care of type 2 diabetes mellitus in primary care in Catalonia, Spain. Int J Clin Pract 2012; 66: 289–98. 14. Gaede P, Vedel P, Parving HH, Pedersen O. Intensified multifactorial intervention in patients with type 2 diabetes mellitus and microalbuminuria: the Steno type 2 randomised study. Lancet 1999; 353: 617–22. 15. Gaede P, Vedel P, Larsen N et al. Multifactorial intervention and cardiovascular disease in patients with type 2 diabetes. N Engl J Med 2003; 348: 383–93. 16. UK Prospective Diabetes Study Group. Tight blood pressure control and risk of macrovascular and microvascular complications in type 2 diabetes: UKPDS 38. BMJ 1998; 317: 703–13. 17. Brenner BM, Cooper ME, de Zeeuw D et al. Effects of losartan on renal and cardiovascular outcomes in patients with type 2 diabetes and nephropathy. N Engl J Med 2001; 345: 861–9. 18. Parving HH, Lehnert H, Bröchner-Mortensen J et al. The effect of irbesartan on the development of diabetic nephropathy in patients with type 2 diabetes. N Engl J Med 2001; 345: 870–8. 19. American Diabetes Association. Standards of medical care in diabetes, 2012. Diabetes Care 2012; 35: S11–63. 20. Bhattacharyya OK, Estey EA, Cheng AY. 2008 CDA. Update on the Canadian Diabetes Association 2008 clinical practice guidelines. Can Fam Physician 2008; 2009(55): 39–43. 21. International Diabetes Federation. Global Guideline for Type 2 Diabetes. Belgium, Brussels: IDF, ed, 2012. 22. National Collaborating Centre for Chronic C. National Institute for Health and Clinical Excellence: Guidance. Type 2 Diabetes: National Clinical Guideline for Management in Primary and. London: Royal College of Physicians (UK). Royal College of Physicians of London. 2008. 23. Jamtvedt G, Young JM, Kristoffersen DT et al. Does telling people what they have been doing change what they do? A systematic review of the effects of audit and feedback. Qual Saf Health Care 2006; 15: 433–6. 24. Renders CM, Valk GD, Franse LV et al. Long-term effectiveness of a quality improvement program for patients with type 2 diabetes in general practice. Diabetes Care 2001; 24: 1365–70. 25. Cabana MD, Rand CS, Powe NR et al. Why don't physicians follow clinical practice guidelines? A framework for improvement. JAMA 1999; 282: 1458–65. 26. Vidal Pardo JI, Pérez Castro TR, López Álvarez XL et al. Quality of care of patients with type-2 diabetes in Galicia (NW Spain) [OBTEDIGA project]. Int J Clin Pract 2011; 65: 1067–75. 27. Plan de Saúde 2006–2010. Santiago de Compostela: Xunta de Galicia. Consellería de Sanidade. Dirección Xeral de Aseguramento e Planificación Sanitaria. 2006: 73–86. 28. Peterson KA, Radosevich DM, O'Connor PJ et al. Improving Diabetes Care in Practice: findings from the TRANSLATE trial. Diabetes Care 2008; 31: 2238–43. 29. Valk GD, Renders CM, Kriegsman DM et al. Quality of care for patients with type 2 diabetes mellitus in the Netherlands and the United States: a comparison of two quality improvement programs. Health Serv Res 2004; 39: 709–25. 30. Forsetlund L, Bjørndal A, Rashidian A et al. Continuing education meetings and workshops: effects on professional practice and health care outcomes. Cochrane Database Syst Rev 2009; 2: CD003030. 31. Davis D, Galbraith R, Committee ACoCPHaSP. Continuing medical education effect on practice performance: effectiveness of continuing medical education: American College of Chest Physicians Evidence-Based Educational Guidelines. Chest 2009; 135: 42S–8S..
(10) 32. Davis DA, Taylor-Vaisey A. Translating guidelines into practice. A systematic review of theoretic concepts, practical experience and research evidence in the adoption of clinical practice guidelines. CMAJ 1997; 157: 408– 16. 33. Nyman MA, Murphy ME, Schryver PG et al. Improving performance in diabetes care: a multicomponent intervention. Eff Clin Pract 2000; 3: 205–12. 34. Knight K, Badamgarav E, Henning J et al. A systematic review of diabetes disease management programs. Am J Manag Care 2005; 11: 242–50. 35. Davis D, O'Brien M, Freemantle N et al. Impact of formal continuing medical education: do conferences, workshops, rounds, and other traditional continuing education activities change physician behavior or health care outcomes? JAMA 1999; 282: 867–74. 36. Jamtvedt G, Young JM, Kristoffersen DT et al. Audit and feedback: effects on professional practice and health care outcomes. Cochrane Database Syst Rev 2006; 2: CD000259. 37. O'Brien MA, Rogers S, Jamtvedt G et al. Educational outreach visits: effects on professional practice and health care outcomes. Cochrane Database Syst Rev 2007; 4: CD000409. 38. Farmer AP, Légaré F, Turcot L et al. Printed educational materials: effects on professional practice and health care outcomes. Cochrane Database Syst Rev 2008; 3: CD004398. 39. O'Brien KE, Chandramohan V, Nelson DA et al. Effect of a physician-directed educational campaign on performance of proper diabetic foot exams in an outpatient setting. J Gen Intern Med 2003; 18: 258–65. 40. Kim C, Williamson D, Mangione C et al. Managed care organization and the quality of diabetes care: the Translating Research Into Action for Diabetes (TRIAD) study. Diabetes Care 2004; 27: 1529–34. 41. Kirkman MS, Williams SR, Caffrey HH, Marrero DG. Impact of a program to improve adherence to diabetes guidelines by primary care physicians. Diabetes Care 2002; 25: 1946–51. 42. Renders CM, Valk GD, de Sonnaville JJ et al. Quality of care for patients with Type 2 diabetes mellitus–a longterm comparison of two quality improvement programmes in the Netherlands. Diabet Med 2003; 20: 846–52. 43. Krein SL, Hofer TP, Kerr EA, Hayward RA. Whom should we profile? Examining diabetes care practice variation among primary care providers, provider groups, and health care facilities. Health Serv Res 2002; 37: 1159–80. 44. Shojania K, Ranji S, McDonald K et al. Effects of quality improvement strategies for type 2 diabetes on glycemic control: a meta-regression analysis. JAMA 2006; 296: 427–40.. Appendix List of participating physicians [OBTEDIGA project]: Coordinating Group: Vidal Pardo, JI; López Álvarez, XL; García Soidán, FJ; López Vázquez, P; Mato Mato, JA; do Muíño Joga, M; Jorge Méndez, S; López Fernández, MD; Muñiz, J; Primary Care Medical Group: Gerencia de Atención Primaria (G.A.P.) A Coruña: de Alcalá Torreiro, EM; de Aspe de la Iglesia, EM; Eirís Pérez, R; Esmorís Méndez, M; Garea Cao, B; López Pan; MM; López Toledo, ML; Mesía Alonso, MJ; Pena Babío, MT; Rey López, A; Veras Castro, R; Vigo Arcas, A; Zapata Medín, ML; G.A.P. Ferrol: Alvarez Escudero, A; Cameo Chenlo, MP; Castro Blanco, A; García del Río, ME; Martínez González, A; G.A.P. Lugo: Álvarez Ferreiro, MI; Campo Dieguez, FJ; Castiñeira Pérez, MC; Cobo Domínguez, C; Cobo Rodríguez, B; Fontenla Villamarín, A; Fouz Ulloa, A; García Sierra, A; González-Anleo Rodríguez, MF (†); López Lens, M; López Martín, I; Martínez González, M; Mourín González, MF; Navaza Dafonte, AM; Palmeiro Díaz, M; Parada Mariñas, R; Pensado Barbeira, F; Porto Iglesias, JA; Rodríguez Suárez, F; Santos García, MC; Valledor Puente, JF; Vázquez Gómez, T; Vázquez Seijas, EJ; Vázquez Vázquez, MJ; G.A.P. Pontevedra: Carrera Ligero, JM; Cores Abalo, M; Fuente Martín, LM; Meijide Calvo, LM; Ogando Canabal, AM; Onega Díaz, C; Sánchez Castro, JJ; Segovia Castro, L; Yun Casalilla, MT; G.A.P. Vigo: Dapena Sánchez, R; Eiras Pérez, J; Estévez Antla, J; Fonseca Moretón, T; Izquierdo Fernández, R; Lora Sánchez, A; Martínez Portela, JM; Mena Cao, JI; Nogueiras Santas, C; Oujo Pujales, J; Pache Muíños, C; Ríos Rey, T; Sánchez Ventin, V; Sanisidro Vilaso, FJ; Torre Díez, JL; Ucha Fernández, J; Vázquez Troitiño, F; Vergara Ruiz, M; G.A.P. Ourense: Alberte Castiñeiras, ML; Antolín Novoa; MD; Avila Alonso, AH; Balado Carballido, A;del Alamo Alonso, AJ; Eirís Cambre, MA; Fernández Silva, MJ;Ferreira González, MI; González Afonso, E; González Reza, E; Lamelas García, JA; Madroño Freire, MJ; Merino Beiro, MO; Outeiriño López, ME; Portuburu Izaguirre, MM; Quintela Fernández, A; Rodríguez Domínguez, G; Rodríguez Ferreiros, AM; Rojo Fernández, JC; Salgado Gómez, MC; Salgado Novoa, MM; Valencia Veloso, M; Veiga Vázquez, A; Vilariño Méndez, CR; G.A.P. Santiago: Bugarín González, R; Caneda Villar, MC; Celemín Colomina, I;Cerqueiras Alcalde, MC; Concheiro Coello, G; Estévez Vila, JA; Fernández González, ME; Juiz Crespo, MA; Lorenzo Tomé, JJ; Pazo Paniagua, MC; Rojo Grandío, Y; Seco Otero, M; Vázquez Cacheiro, J; Ventosa Rial, JJ; Verdes Castro, MC. Nursing group: Rodríguez González, A; Losada Mateo, A; González Castroagudín, S; Prado Nistal, A; Moreira Iglesias, D; Rojo González, S; Alvarez Sequeiro, J; Rodríguez Rey, L..
(11)
Figure
+2
Documento similar