TítuloChanges in frailty status in a community dwelling cohort of older adults: the VERISAÚDE study
15
0
0
Texto completo
(2) 1. Introduction Physical frailty has been described along a continuum of severity (fitness-frailty spectrum) with three stages: non-frailty or robustness, pre-frailty (precursor or latent state) and frailty, and it has been associated with adverse health outcomes such as incident falls and fractures, hospitalization, disability, dependence and premature death [[1], [2], [3]]. Pre-frail state identifies a subset at high risk of progressing to clinically identifiable frail state [2]. Recent literature exploring the natural course of frailty in older adults suggests that it is a gradual dynamic process, characterized by frequent transitions between frailty states in both directions (worsening or improvement) over time [[4], [5], [6], [7], [8], [9], [10]]. It has been shown that transitions are more common between adjacent states (one-step transitions) and from states of lesser frailty to states of greater frailty [6,8,[10], [11], [12]], and they appear to be independent of progression in cognitive status in earliest stages of cognitive impairment [13]. Recent studies have shown that frailty transitions could be modulated by several health and social-related factors [14]. Although these findings suggest that frailty is potentially reversible, pharmacological and nonpharmacological interventions aimed at preventing and reversing the frailty syndrome or its clinical consequences remain elusive [15,16]. In general, it has been suggested that multi-domain (physical and nutritional) interventions may delay or even reverse physical frailty [[17], [18], [19], [20], [21], [22], [23]]. Therefore, the developing and implementation of specific interventions and effective health-care policies aimed at preventing or reducing the level of frailty and postponing its adverse health consequences in old age is one of the most important public health challenges. An important subset of Galician (Northwest of Spain) community-dwelling older adults has been shown to be pre-frail and at high risk of progressing to frailty [24]. Evidence about the natural history of frailty as a modifiable, bidirectional, and dynamic process is scarce, particularly in the reversion of the frailty status. Further understanding of the processes underlying transitions between frailty states (factors that positively or negatively contribute to changing the frailty state) is important for clarifying the natural history of frailty and may help clinical decision-making related to preventive interventions. The adverse health outcomes related to frailty contribute to an increased demand for medical and social care and are associated with increased economic costs. For these reasons, it is important that clinicians know the frailty process and the main determinants of transitions among its levels, so that effective preventive and rehabilitative actions can be taken as early as possible. Since changes in frailty states are of considerable clinical and public health interest, the aim of the present study was to explore the natural transition rates between states of frailty over a 1-year period and identify the determinants or precipitants of such transitions over time in a community-dwelling cohort of older adults.. 2. Methods 2.1. Study population This study was drawn from a sample population of 537 community-dwelling older people aged 65 and over who participated in the Effectiveness of the Comprehensive Gerontological Assessment and longitudinal follow-up in the healthy aging promotion (VERISAÚDE) project Considering the reference population of 632,381 individuals, which represented the absolute number of older adults aged 65 years or older from Galicia according to the municipal register of the 2011 National Health Survey, a sample of 749 older individuals was defined. To ensure a representative sample, the distribution of the sample by age and sex was similar to that of the entire Galician older population. The level of confidence was 95%, accuracy ±4.0% and estimation of data losses 20.0%. The VERISAÚDE study included a first comprehensive gerontological assessment (CGA) with frailty state classified according to the Fried phenotypic criteria [2], and a second CGA one year later. The study protocol has been approved by the Ethics Committee of the University of A Coruña (CE 09/2013) and was in conformity with the principles embodied in the Declaration of Helsinki. Before the data collection, all participants have been informed about the study and signed the corresponding informed consent form. The inclusion criteria for the participants were as follows: (a) being ≥65 years of age, and (2) willingness to sign the informed consent.
(3) form. The exclusion criterion for the sample was inability to perform the CGA. The manuscript was written according to the STrengthening the Reporting of OBservational Studies in Epidemiology (STROBE) statement [25]. 2.2. Frailty assessment and measurement of frailty transitions Fried phenotype was used to objectively diagnose frailty [2]. The 5 frailty criteria were: (a) Unintentional weight loss of ≥4.5 kg in previous year, (b) Self-reported exhaustion, identified by two questions (items 7 and 20) from the Center for Epidemiological Studies-Depression (CES-D) scale, (c) Weakness, defined by handgrip strength in the dominant hand measured with a dynamometer in kilograms, adjusted for gender and body mass index, (d) Slow walking speed, assessed by the walking time (in seconds) over a distance of 4.57 m, adjusting for gender and height, and (e) Low physical activity, measured by the weighted score of kilocalories expended per week, calculated on the basis of the Minnesota Leisure Time Activity Questionnaire, based on each participant’s report, and adjusting for gender. The cut-points used were those proposed by Fried et al. (2001) [2]. At each assessment, participants were classified as non-frail (robust) if they met none of the criteria, pre-frail if they met 1 or 2 criteria, and frail if they met ≥3 criteria [2]. Frailty transitions (progressed, regressed, no change, or death) and associated factors were assessed. 2.3. Comprehensive gerontological assessment The CGA included the assessment of sociodemographic characteristics, sensory impairments, toxic habits, self-rated health, polypharmacy, comorbidity, nutritional status, cognitive and affective function, and functional status at baseline and 1-year follow-up. 2.3.1. Socio-demographic characteristics Information on date of birth, age, sex, and level of education was self-reported. Educational level has been classified into three categories according to years of formal education completed: ≤8 years, 9–17 years, and ≥18 years. 2.3.2. Visual impairment A Snellen eye chart located at a distance of 2.8 m from participant’s eyes was used for screening for visual acuity impairment. Decreased visual acuity was defined as best corrected vision worse than 20/50. 2.3.3. Hearing impairment To determine hearing loss, the whispered-voice test was used [26]. The participants were considered to have a normal hearing if they repeat back at least 3 out of a possible total of 6 letters/numbers correctly, whispered at a distance of 0.6 m behind the participant’s field of vision. 2.3.4. Toxic habits Tobacco and alcohol consumption was self-reported. The variable smoking status (smoker or nonsmoker) was assessed based on the 30 days’ prevalence of cigarette smoking [27]. The exact number of Standard Drink Units (SDU) was calculated using the formula: size of drink in milliliters (Vol) x percent by volume of alcohol (%) x density of ethanol at room temperature (0.789 g/ml) / by gram in standard drink (10 g in Spain). We defined “alcohol abuse” with an upper level of daily consumption >30 g of pure alcohol (3 SDU) per day [28]..
(4) 2.3.5. Self-rated health Self-rated health was assessed with a single question: In general, would you say your health is excellent, good, fair, or poor [29]? 2.3.6. Medication consumption Participants were asked to present their medication history (dispensed medications by their general practitioner), and polypharmacy was defined as the concurrent use of five or more different prescribed medications [30]. 2.3.7. Comorbidity Comorbidity was measured using Charlson Comorbidity Index (CCI) [31]. All the 19 medical conditions assessed were assigned a CCI weight (1, 2, 3 or 6) taking into account their number and seriousness, which ranges from 0 to 37 points. For each patient, the CCI-aged adjusted score was computed, defining three comorbidity levels: 0–1 (no comorbidity), 2 (low comorbidity), and ≥3 (high comorbidity). 2.3.8. Nutritional status The Spanish version (Nestlé Nutrition Institute) of the Mini-Nutritional Assessment-Short Form (MNA-SF) [32] was used for nutritional screening. The sum of the MNA-SF score distinguishes between patients with: 1) normal nutritional status, 12–14 points; 2) at risk of malnutrition, 8–11 points; and 3) malnutrition, 0–7 points. 2.3.9. Cognitive assessment The global cognitive status was assessed using the Spanish version of the Mini-Mental State Examination (MMSE) [33]. Scores, ranging from 0 to 30, were adjusted for age and level of education, and participants were considered as cognitively impaired if they scored <25. 2.3.10. Affective assessment Depressive symptoms were assessed using the Spanish-validated version of the short-form of the Geriatric Depression Scale (GDS-SF) [34], which recommends using a cut-off of ≥5 points to consider the existence of probable clinical depression. 2.3.11. Functional status Functional status was measured using Lawton and Brody Index [35] for the instrumental activities of daily living. The score ranges from 0 (low function, dependence) to 8 (high function, independence). Participants who were unable to perform any one of the activities without the help of another person were considered to be dependent. 2.4. Statistical analysis The frequencies of natural transitions between the three frailty states (non-frail, pre-frail, frail) and death were calculated for those participants who completed the follow-up or died. Thus, worsening transitions (from non-frail to pre-frail states and from pre-frail to frail states) and improvement transitions (from frail to pre-frail states and from pre-frail to non-frail states) at 1-year follow-up were considered as primary outcomes. Participant characteristics were compared across transitions in frailty status using student t-tests for continuous variables, and chi-square tests for categorical variables. For multiresponse variables, column proportions were compared using custom tables (z test). Cohen’s d and h values were reported as indicators of effect size for comparing the mean and proportion values respectively, using the benchmarks for “small” (0.2), “medium” (0.5) and “large” (0.8) in both cases [36]..
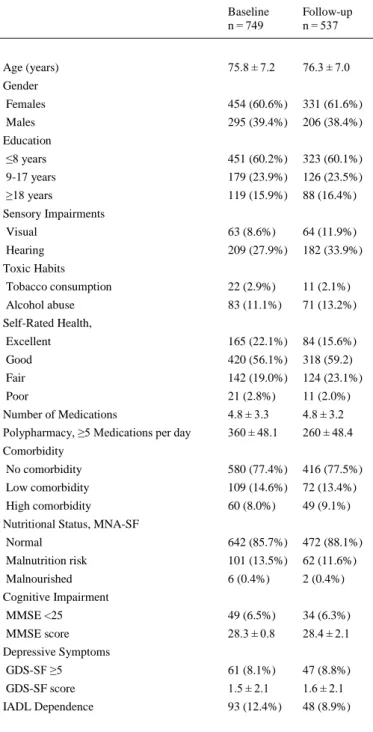
(5) Frailty transition analyses were performed using a forward stepwise multivariate logistic regression method. Odds ratios (OR) and 95% confidence intervals (CI) were calculated for each covariate included in the model. A p-value of <0.05 was taken to define statistical significance. The data analyses were performed using the software package IBM SPSS Statistics v.24.0 (IBM Corp, Armonk, NY, USA).. 3. Results Among the 749 older adults evaluated at baseline, 537 (71.7%) were re-evaluated one year later, and 212 (28.3%) were lost to follow-up. Drop-out rates as a function of frailty level are shown in Fig. 1. An independent t-test revealed that participants who dropped out (n = 212) were slightly older than those who participated in the follow-up assessment (n = 537) (76.6 ± 7.5 vs 75.4 ± 7.0 years respectively; p = 0.035). The characteristics of the participants at baseline (n=749) and follow-up (n=537) are shown in Table 1.. Fig. 1. Drop-out Rates as a Function of Frailty Level..
(6) Table 1. Characteristics of Participants at Baseline and at 1-Year Follow-Up. Baseline n = 749. Follow-up n = 537. 75.8 ± 7.2. 76.3 ± 7.0. Females. 454 (60.6%). 331 (61.6%). Males. 295 (39.4%). 206 (38.4%). ≤8 years. 451 (60.2%). 323 (60.1%). 9-17 years. 179 (23.9%). 126 (23.5%). ≥18 years. 119 (15.9%). 88 (16.4%). Visual. 63 (8.6%). 64 (11.9%). Hearing. 209 (27.9%). 182 (33.9%). Tobacco consumption. 22 (2.9%). 11 (2.1%). Alcohol abuse. 83 (11.1%). 71 (13.2%). Excellent. 165 (22.1%). 84 (15.6%). Good. 420 (56.1%). 318 (59.2). Fair. 142 (19.0%). 124 (23.1%). Poor. 21 (2.8%). 11 (2.0%). Number of Medications. 4.8 ± 3.3. 4.8 ± 3.2. Polypharmacy, ≥5 Medications per day. 360 ± 48.1. 260 ± 48.4. No comorbidity. 580 (77.4%). 416 (77.5%). Low comorbidity. 109 (14.6%). 72 (13.4%). High comorbidity. 60 (8.0%). 49 (9.1%). Normal. 642 (85.7%). 472 (88.1%). Malnutrition risk. 101 (13.5%). 62 (11.6%). Malnourished. 6 (0.4%). 2 (0.4%). MMSE <25. 49 (6.5%). 34 (6.3%). MMSE score. 28.3 ± 0.8. 28.4 ± 2.1. GDS-SF ≥5. 61 (8.1%). 47 (8.8%). GDS-SF score. 1.5 ± 2.1. 1.6 ± 2.1. IADL Dependence. 93 (12.4%). 48 (8.9%). Age (years) Gender. Education. Sensory Impairments. Toxic Habits. Self-Rated Health,. Comorbidity. Nutritional Status, MNA-SF. Cognitive Impairment. Depressive Symptoms. Values are presented as means ± standard deviation for continuous variables or as frequencies (percentages) for categorical variables. MNA-SF: Mini-Nutritional Assessment-Short Form (ranges 0–14 points; 12–14 points indicate normal nutritional status, 8–11 points indicate risk of malnutrition, and 0–7 points indicate malnutrition). MMSE: Mini-Mental State Examination (ranges 0– 30 points; <25 points indicate cognitive impairment), GDS-SF: Geriatric Depression Scale-Short Form (ranges 0–15 points; ≥5 points indicate probable clinical depression). IADL: Instrumental Activities of Daily Living (the score ranges from 0 (low function, dependence) to 8 (high function, independence))..
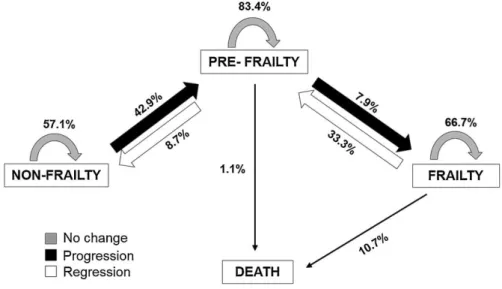
(7) 3.1. Frailty transitions’ rates At baseline, 183 (24.4%) of the participants were non-frail, 538 (71.8%) were pre-frail, and 28 (3.7%) were frail. At 1-year follow-up, 113 (21.0%) were non-frail, 382 (71.1%) were pre-frail, and 42 (7.8%) were frail. Fig. 2 shows changes in frailty status from baseline to 1-year follow-up. During the study period, a total of 408 (76.0%) participants retained their baseline frailty state, and 129 (24.0%) made transitions between states of frailty (16.7% progressed, and 7.3% regressed). Most participants, mainly pre-frail subjects, remained unchanged at their baseline state (57.1% non-frail, 83.4% pre-frail, 66.7% frail). Regarding frailty transitions, 42.9% of non-frail older adults at baseline progressed to pre-frailty status, and 7.9% of pre-frail older adults became frail at 1-year follow-up. Importantly, 33.3% of frail older adults regressed to pre-frailty status and 8.7% of pre-frail older adults regressed to non-frailty status. As expected, none frail subject regressed to non-frailty status directly. Frailty transition patterns at 1-year follow-up are shown in Table 2. As expected, only transitions between adjacent states of frailty were observed. As shown in Fig. 2 and Table 2, direct transitions between states of non-frailty and frailty were not observed. Non-frail females tended to progress into pre-frailty more than non-frail males, who remained unchanged more than females (p = 0.006, h = .321, small effect size).. Fig. 2. Percentage of Frailty Transitions in the VERISAÚDE Population from Baseline to 1-Year Follow-Up. Stability in frailty status is represented as grey thick arrows, worsening is shown in black color, regression (improvement) is shown in white, and percentages of deaths are represented as black thin arrows..
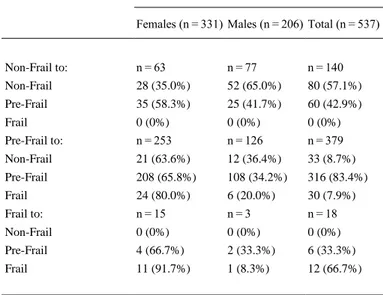
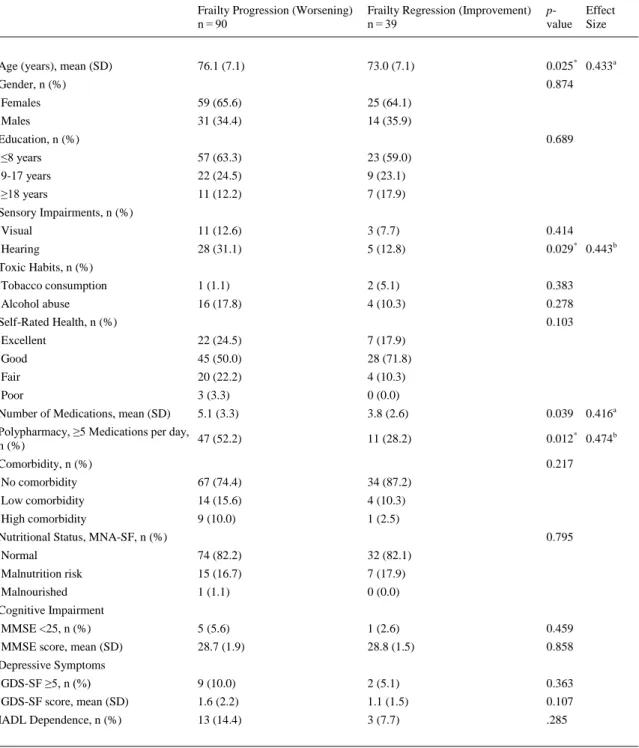
(8) Table 2. Frailty Transitions at 1-Year Follow-Up. Frailty Transitions, n (%) Baseline to 1-Year Follow-Up Females (n = 331) Males (n = 206) Total (n = 537). Non-Frail to:. n = 63. n = 77. n = 140. Non-Frail. 28 (35.0%). 52 (65.0%). 80 (57.1%). Pre-Frail. 35 (58.3%). 25 (41.7%). 60 (42.9%). Frail. 0 (0%). 0 (0%). 0 (0%). Pre-Frail to:. n = 253. n = 126. n = 379. Non-Frail. 21 (63.6%). 12 (36.4%). 33 (8.7%). Pre-Frail. 208 (65.8%). 108 (34.2%). 316 (83.4%). Frail. 24 (80.0%). 6 (20.0%). 30 (7.9%). Frail to:. n = 15. n=3. n = 18. Non-Frail. 0 (0%). 0 (0%). 0 (0%). Pre-Frail. 4 (66.7%). 2 (33.3%). 6 (33.3%). Frail. 11 (91.7%). 1 (8.3%). 12 (66.7%). The prevalence of each clinical condition evaluated by the Charlson Comorbidity Index in the worsening and improvement groups was calculated, showing that just the prevalence of congestive heart failure was significantly different between the groups (24.4% in worsening versus 2.6% in improvement groups, p = 0.003, h = .676, medium effect size). A forward stepwise multivariate logistic regression analysis was made using frailty transitions as a dichotomy dependent variable (worsening versus improvement). Age, hearing impairment, congestive heart failure, number of medications and polypharmacy were included as independent variables, because of the significant differences between groups shown by the bivariate analysis (see Table 3, all medium effect sizes). Results of the regression model revealed that hearing impairment (OR = 3.180, 95% CI 1.078–9.384, p = 0.036), congestive heart failure (OR=10.864, 95% CI 1.379–85.614, p = 0.024), and polypharmacy (OR=2.572, 95% CI 1.096–6.037, p = 0.030) at baseline represent more chance of experience a transition toward a worse frailty state at 1-year follow-up, with the model accurately predicting 70.5% of the worsening cases..
(9) Table 3. Determinants of Transitions Between Frailty States. Frailty Progression (Worsening) n = 90. Frailty Regression (Improvement) n = 39. pvalue. 76.1 (7.1). 73.0 (7.1). 0.025* 0.433a. Females. 59 (65.6). 25 (64.1). Males. 31 (34.4). 14 (35.9). ≤8 years. 57 (63.3). 23 (59.0). 9-17 years. 22 (24.5). 9 (23.1). ≥18 years. 11 (12.2). 7 (17.9). Visual. 11 (12.6). 3 (7.7). 0.414. Hearing. 28 (31.1). 5 (12.8). 0.029* 0.443b. Tobacco consumption. 1 (1.1). 2 (5.1). 0.383. Alcohol abuse. 16 (17.8). 4 (10.3). 0.278. Excellent. 22 (24.5). 7 (17.9). Good. 45 (50.0). 28 (71.8). Fair. 20 (22.2). 4 (10.3). Poor. 3 (3.3). 0 (0.0). Number of Medications, mean (SD). 5.1 (3.3). 3.8 (2.6). 0.039. Polypharmacy, ≥5 Medications per day, 47 (52.2) n (%). 11 (28.2). 0.012* 0.474b. Age (years), mean (SD) Gender, n (%). Effect Size. 0.874. Education, n (%). 0.689. Sensory Impairments, n (%). Toxic Habits, n (%). Self-Rated Health, n (%). 0.103. Comorbidity, n (%). 0.416a. 0.217. No comorbidity. 67 (74.4). 34 (87.2). Low comorbidity. 14 (15.6). 4 (10.3). High comorbidity. 9 (10.0). 1 (2.5). Normal. 74 (82.2). 32 (82.1). Malnutrition risk. 15 (16.7). 7 (17.9). Malnourished. 1 (1.1). 0 (0.0). MMSE <25, n (%). 5 (5.6). 1 (2.6). 0.459. MMSE score, mean (SD). 28.7 (1.9). 28.8 (1.5). 0.858. GDS-SF ≥5, n (%). 9 (10.0). 2 (5.1). 0.363. GDS-SF score, mean (SD). 1.6 (2.2). 1.1 (1.5). 0.107. IADL Dependence, n (%). 13 (14.4). 3 (7.7). .285. Nutritional Status, MNA-SF, n (%). 0.795. Cognitive Impairment. Depressive Symptoms. SD: Standard Deviation. MNA-SF: Mini-Nutritional Assessment-Short Form (ranges 0–14 points; 12–14 points indicate normal nutritional status, 8–11 points indicate risk of malnutrition, and 0–7 points indicate malnutrition). MMSE: Mini-Mental State Examination (ranges 0–30 points; <25 points indicate cognitive impairment), GDS-SF: Geriatric Depression Scale-Short Form (ranges 0–15 points; ≥5 points indicate probable clinical depression). IADL: Instrumental Activities of Daily Living (the score ranges from 0 (low function, dependence) to 8 (high function, independence)). * p < .005. a Cohen’s d effect size. b Cohen’s h effect size..
(10) 3.2. Mortality rates Mortality rate was higher among participants classified as frail at baseline, with no direct transitions from non-frailty to death. Specifically, 1.1% of pre-frail (0.3% females, 2.7% males) and 10.7% of frail (13.0% females, none male) participants at baseline died at 1-year follow-up. Females who were frail at baseline were more likely to die compared to frail males at baseline.. 4. Discussion In the present study, the spontaneous course of frailty was explored in a large community-dwelling cohort of older adults estimating the transition rates among states over a 1-year period, and the main predictors associated with frailty transitions were identified. This is of clinical and public health interest since little is known regarding frailty trajectories within short periods, and the risk factors involved in the transitions. According to previous studies [8,10], most participants (76.0%) remained unchanged at their baseline state, with pre-frail individuals being more likely to remain stable than non-frail and frail individuals. It is important to note that the prevalence of pre-frailty was considerably high in the studied population [24]. Almost a quarter of the participants made transitions between states of frailty (16.7% progressed, and 7.3% regressed), confirming the dynamic and bidirectional nature of frailty syndrome [8]. As expected, transitions towards a worse frailty state were more likely than transitions towards a better frailty state. In previous studies, pre-frail individuals were shown to be more likely to regress or improve than frail individuals [6,10]. Importantly, in our study an important proportion of frail individuals (33.3%) regressed to the pre-frailty state, suggesting that even frail state may be an optimal target for intervention. According to these findings, a significant proportion of participants (9–16%) improved in frailty status in previous studies [6,8,37]. Additionally, females were more likely to decline in frailty status than males in the present study. In contrast, a better chance of frailty improvement has been previously reported in females [9]. Risk and protective factors associated with frailty have been widely explored in longitudinal studies [38]. Socioeconomic, functional or psychological determinants of transitions, or individual clinical/medical characteristics associated with progression or regression over time have been also explored in community-dwelling older adults [4,6,7,[9], [10], [11],39]. In a recent innovative study, it has been shown that factors that determine the worsening or improvement of frailty state differ as a function of gender and that more males than females deteriorate into frailty [9]. In contrast to this finding, females were more likely to decline in frailty status than males in the present study. Our results showed that hearing impairment, congestive heart failure, and polypharmacy were significantly associated with worsening within a relatively short period. According to these findings, in a recent 4-year follow-up study, it was shown that self-reported hearing impairment was significantly associated with greater risk of becoming frail in pre-frail community-dwelling older adults [40]. Hearing impairment, evaluated by the pure-tone-average of hearing thresholds, has been also associated with the risk of frailty and with greater odds of falling in older adults [41]. Altogether, these results suggest that hearing impairment, a common condition in later life associated with comorbidity, disability and poor quality of life [42,43], may accelerate the progression of frailty. Polypharmacy has been also recently associated with a higher incidence of frailty [44,45] and greater mortality [10,46] in longitudinal studies. Specifically, the cumulative exposure to sedative and anticholinergic medications was associated with greater risk of transitioning from the robust to the prefrail state, and each additional medication was associated with greater risk of transitioning from the robust state to death in community-dwelling older men aged 70 and older [44]..
(11) Finally, according to our results, the presence of congestive heart failure was associated with lower likelihood of improvement in frailty status [9,37]. The main strengths of this research are the large representative sample of community-dwelling older adults assessed, and the study of frailty transitions occurring within a short time interval. It is important to highlight that only active older participants in senior centers were assessed in the present study, possibly affecting the generalization of the findings. A limitation of our study is the little information regarding acute events or factors that may have contributed to progression in frailty, such as injury or surgery, acute disease and/or psychological stress. Some losses occurred in the 1-year follow-up period with a 28.3% drop-out rate. It is also unclear how the use of an alternative operationalization of frailty would have influenced the observed transition rates. Finally, it is possible that rates of progression to frailty are related to the presence of specific initial physical criteria (different patterns of frailty), and this point should be further explored, together with frailty transitions at higher time intervals. To sum up, our results confirm the dynamic and bidirectional nature of frailty and suggest the need of preventing and early treating the hearing impairment and cardiovascular diseases, and tightly monitoring polypharmacy in later life in order to optimize health outcomes and minimize the public health burden of frailty. It is important that clinicians know the natural frailty process and the main determinants of changes in frailty status, in order to take early preventive and rehabilitative actions.. Contributors Laura Lorenzo-López made substantial contributions to the study’s conception and design, actively participated in acquisition of data, analysis, and interpretation of data, and drafted the article. Rocío López-López actively participated in acquisition of data, analysis, and interpretation of data, and drafted the article. Ana Maseda made substantial contributions to the study’s conception and design, actively participated in acquisition of data, analysis, and interpretation of data, and revised the article critically for important intellectual content. Ana Buján revised the article critically for important intellectual content. José L. Rodríguez-Villamil revised the article critically for important intellectual content. José C. Millán-Calenti made substantial contributions to the study’s conception and design, and revised the article critically for important intellectual content. All authors saw and approved the final version. All authors meet the criteria for authorship stated in the Uniform Requirements for Manuscripts Submitted to Biomedical Journals.. Conflict of interest The authors declare that they have no conflict of interest.. Funding This research was supported by the Xunta de Galicia project EM 2012/100: “VERISAÚDE project: Effectiveness of the Comprehensive Gerontological Assessment and longitudinal follow-up in the healthy aging promotion”, ED431C 2017/49 and FrailNet network IN607C, 2016/08. LLL is supported by the “Ramon y Cajal” Postdoctoral Senior Grant (RYC-2015-18394) from the Spanish Ministry of Economy, Industry and Competitiveness, co-financed by the European Social Fund; and by the Xunta de Galicia (project ED431F 2017/09). RLL is supported by a predoctoral grant from the Autonomous Government.
(12) of Galicia (I2C programme). Funding sources had no involvement in study design, collection, analysis and interpretation of data, writing of the report, or in the decision to submit the article for publication.. Ethical approval The work was done at the University of A Coruña (Spain), in compliance with institutional guidelines and approved by the Ethics Committee at the University of A Coruña (CE 09/2013) and has conformed to the principles embodied in the Declaration of Helsinki.. Provenance and peer review This article has undergone peer review.. Research data (data sharing and collaboration) There are no linked research data sets for this paper. The data that support the findings of this study are available from the corresponding author upon reasonable request.. Acknowledgments The authors sincerely thank the staff and older users of the 43 senior centers who contributed to this study.. References [1]. [2]. [3]. [4]. [5] [6]. [7]. R.S. Crow, M.C. Lohman, A.J. Titus, M.L. Bruce, T.A. Mackenzie, S.J. Bartels, J.A. Batsis. Mortality risk along the frailty spectrum: data from the national health and nutrition examination survey 1999 to 2004, J. Am. Geriatr. Soc. (2018), https://doi.org/10.1111/jgs.15220 L.P. Fried, C.M. Tangen, J. Walston, A.B. Newman, C. Hirsch, J. Gottdiener, T. Seeman, R. Tracy, W.J. Kop, G. Burke, M. McBurnie. Frailty in older adults: evidence for a phenotype, J. Gerontol. A Biol. Sci. Med. Sci., 56 (2001), pp. M146-M156, https://doi.org/10.1093/gerona/56.3.M146 S. Vermeiren, R. Vella-Azzopardi, D. Beckwée, A.K. Habbig, A. Scafoglieri, B. Jansen, I. Bautmans, I. Bautmans. Frailty and the prediction of negative health outcomes: a metaanalysis, J. Am. Med. Dir. Assoc., 17 (2016), https://doi.org/10.1016/j.jamda.2016.09.0101163.e1-1163.e17 M.A. Alencar, J.M.D. Dias, L.C. Figueiredo, R.C. Dias. Transitions in frailty status in community-dwelling older adults, Top. Geriatr. Rehabil., 31 (2015), pp. 105-112, https://doi.org/10.1097/TGR.0000000000000055 J. De Lepeleire, S. Iliffe, E. Mann, J.M. Degryse. Frailty: an emerging concept for general practice, Br. J. Gen. Pract., 59 (2009), pp. 364-369, https://doi.org/10.3399/bjgp09X420653 S.E. Espinoza, I. Jung, H. Hazuda. Frailty transitions in the San Antonio longitudinal study of aging, J. Am. Geriatr. Soc., 60 (2012), pp. 652-660, https://doi.org/10.1111/j.15325415.2011.03882.x N. Fallah, A. Mitnitski, S.D. Searle, E.A. Gahbauer, T.M. Gill, K. Rockwood. Transitions in frailty status in older adults in relation to mobility: a multistate modeling approach employing a deficit count, J. Am. Geriatr. Soc., 59 (2011), pp. 524-529, https://doi.org/10.1111/j.15325415.2011.03300.x.
(13) [8]. [9]. [10]. [11] [12]. [13]. [14]. [15]. [16] [17]. [18] [19]. [20]. [21]. [22]. [23]. [24]. [25]. T.M. Gill, E.A. Gahbauer, H.G. Allore, L. Han. Transitions between frailty states among community-living older persons, Arch. Intern. Med., 166 (2006), pp. 418-423, https://doi.org/10.1001/archinte.166.4.418 J.S.W. Lee, T.W. Auyeung, J. Leung, T. Kwok, J. Woo. Transitions in frailty states among community-living older adults and their associated factors, J. Am. Med. Dir. Assoc., 15 (2014), pp. 281-286, https://doi.org/10.1016/j.jamda.2013.12.002 C. Trevisan, N. Veronese, S. Maggi, G. Baggio, E.D. Toffanello, S. Zambon, L. Sartori, E. Musacchio, E. Perissinotto, G. Crepaldi, E. Manzato, G. Sergi. Factors influencing transitions between frailty states in elderly adults: the Progetto Veneto Anziani longitudinal study, J. Am. Geriatr. Soc., 65 (2017), pp. 179-184, https://doi.org/10.1111/jgs.14515 N. Bentur, S.A. Sternberg, J. Shuldiner. Frailty transitions in community-dwelling older people, Isr. Med. Assoc. J., 18 (2016), pp. 449-453 Q.L. Xue, K. Bandeen-Roche, R. Varadhan, J. Zhou, L.P. Fried. Initial manifestations of frailty criteria and the development of frailty phenotype in the women’s health and aging study II, J. Gerontol. A Biol. Sci. Med. Sci., 63 (2008), pp. 984-990, https://doi.org/10.1093/gerona/63.9.984 M.S. Chong, L. Tay, M. Chan, W.S. Lim, R. Ye, E.K. Tan, Y.Y. Ding. Prospective longitudinal study of frailty transitions in a community-dwelling cohort of older adults with cognitive impairment, BMC Geriatr., 15 (2015), p. 175, https://doi.org/10.1186/s12877-0150174-1 A. Etman, A. Burdorf, T.J.M. Van der Cammen, J.P. Mackenbach, F.J. Van Lenthe. Sociodemographic determinants of worsening in frailty among community-dwelling older people in 11 European countries, J. Epidemiol. Community Health, 66 (2012), pp. 1116-1121, https://doi.org/10.1136/jech-2011-200027 N. Fairhall, C. Aggar, S.E. Kurrle, C. Sherrington, S. Lord, K. Lockwood, N. Monaghan, I.D. Cameron. Frailty intervention trial (FIT), BMC Geriatr., 8 (2008), pp. 1-10, https://doi.org/10.1186/1471-2318-8-27 P.O. Lang, J.P. Michel, D. Zekry. Frailty syndrome: a transitional state in a dynamic process, Gerontology, 55 (2009), pp. 539-549, https://doi.org/10.1159/000211949 I. Artaza-Artabe, P. Sáez-López, N. Sánchez-Hernández, N. Fernández-Gutierrez, V. Malafarina. The relationship between nutrition and frailty: effects of protein intake, nutritional supplementation, vitamin D and exercise on muscle metabolism in the elderly. A systematic review, Maturitas, 93 (2016), pp. 89-99, https://doi.org/10.1016/j.maturitas.2016.04.009 X. Chen, G. Mao, S.X. Leng. Frailty syndrome: an overview, Clin. Interv. Aging (2014), pp. 433-441, https://doi.org/10.2147/CIA.S45300 H.J. Denison, C. Cooper, A.A. Sayer, S.M. Robinson. Prevention and optimal management of sarcopenia: a review of combined exercise and nutrition interventions to improve muscle outcomes in older people, Clin. Interv. Aging, 10 (2015), pp. 859-869, https://doi.org/10.2147/CIA.S55842 L. Dedeyne, M. Deschodt, S. Verschueren, J. Tournoy, E. Gielen. Effects of multi-domain interventions in (pre)frail elderly on frailty, functional, and cognitive status: a systematic review, Clin. Interv. Aging, 12 (2017), pp. 873-896, https://doi.org/10.2147/CIA.S130794 D.C.D. Chan, H.H. Tsou, R.S. Yang, J.Y. Tsauo, C.Y. Chen, C.A. Hsiung, K.N. Kuo. A pilot randomized controlled trial to improve geriatric frailty, BMC Geriatr., 12 (58) (2012), https://doi.org/10.1186/1471-2318-12-58 M. Serra-Prat, X. Sist, R. Domenich, L. Jurado, A. Saiz, A. Roces, E. Palomera, M. Tarradelles, M. Papiol. Effectiveness of an intervention to prevent frailty in pre-frail community-dwelling older people consulting in primary care: a randomised controlled trial, Age Ageing (2017), pp. 401-407, https://doi.org/10.1093/ageing/afw242 F.J. Tarazona-Santabalbina, M.C. Gómez-Cabrera, P. Pérez-Ros, F.M. Martínez-Arnau, H. Cabo, K. Tsaparas, A. Salvador-Pascual, L. Rodriguez-Mañas, J. Viña. A Multicomponent exercise intervention that reverses frailty and improves cognition, emotion, and social networking in the community-dwelling frail elderly: a randomized clinical trial, J. Am. Med. Dir. Assoc., 17 (2016), pp. 426-433, https://doi.org/10.1016/j.jamda.2016.01.019 L. Lorenzo-López, R. López-López, A. Maseda, C. Diego-Diez, S. Gómez-Caamaño, J.C. Millán-Calenti. Prevalence and clinical characteristics of prefrailty in elderly adults: differences according to degree of urbanization, J. Am. Geriatr. Soc., 64 (2016), pp. 221-223, https://doi.org/10.1111/jgs.13908 J.P. Vandenbroucke, E. Vvon Elm, D.G. Altman, P.C. Gøtzsche, C.D. Mulrow, S.J. Pocock, C. Poole, J.J. Schlesselman, M. Egger. STROBE initiative, strengthening the reporting of observational studies in epidemiology (STROBE): explanation and elaboration, Int. J. Surg., 12 (2014), pp. 1500-1524, https://doi.org/10.1016/j.ijsu.2014.07.014.
(14) [26] [27] [28] [29]. [30]. [31]. [32]. [33]. [34]. [35]. [36] [37]. [38]. [39]. [40]. [41]. [42]. [43]. I.R. Swan, G.G. Browning. The whispered voice as a screening test for hearing impairment, J. R. Coll. Gen. Pract., 35 (1985), p. 197 P. Lantz. Smoking on the rise among young adults: implications for research and policy, Tob. Control, 12 (2003), pp. i60-i70, https://doi.org/10.1136/tc.12.suppl_1.i60 R.K. Foster, H.E. Marriot. Alcohol consumption in the new millennium - weighing up the risks and benefits for our health, Nutr. Bull., 31 (2006), pp. 286-331 M. Kanagae, Y. Abe, S. Honda, N. Takamura, Y. Kusano, T. Takemoto, K. Aoyagi. Determinants of self-rated health among community-dwelling women aged 40 years and over in Japan, Tohoku J. Exp. Med., 210 (2006), pp. 11-19, https://doi.org/10.1620/tjem.210.11 D. Gnjidic, S.N. Hilmer, F.M. Blyth, V. Naganathan, L. Waite, M.J. Seibel, A.J. McLachlan, R.G. Cumming, D.J. Handelsman, D.G. Le Couteur. Polypharmacy cutoff and outcomes: five or more medicines were used to identify community-dwelling older men at risk of different adverse outcomes, J. Clin. Epidemiol., 65 (2012), pp. 989-995, https://doi.org/10.1016/j.jclinepi.2012.02.018 M.E. Charlson, P. Pompei, K.L. Ales, C.R. MacKenzie. A new method of classifying prognostic in longitudinal studies: development and validation, J. Chronic Dis., 40 (1987), pp. 373-383, https://doi.org/0021-9681/87 M.J. Kaiser, J.M. Bauer, C. Ramsch, W. Uter, Y. Guigoz, T. Cederholm, D.R. Thomas, P. Anthony, K.E. Charlton, M. Maggio, A.C. Tsai, D. Grathwohl, B. Vellas, C.C. Sieber. Validation of the mini nutritional assessment short-form (MNA®-SF); a practical tool for identification of nutritional status, J. Nutr. Health Aging, 13 (2009), pp. 782-788, https://doi.org/10.1007/s12603-009-0214-7#citeas R. Blesa, M. Pujol, M. Aguilar, P. Santacruz, I. Bertran-Serra, G. Hernández, J.M. Sol, J. Peña-Casanova, NORMACODEM Group. Clinical validity of the “mini-mental state” for Spanish speaking communities, Neuropsychologia, 39 (2001), pp. 1150-1157, https://doi.org/10.1016/S0028-3932(01)00055-0 J. Martínez, M.C. Onís, R. Dueñas, C. Albert, C. Aguado, R. Luque. Versión española del cuestionario de Yesavage abreviado (GDS) para el despistaje de depresión en mayores de 65 años: adaptación y validación, Medifam, 12 (2002), pp. 620-630, https://doi.org/10.4321/S1131-57682002001000003 M.P. Lawton, E.M. Brody. Assessment of older people: self-maintaining and instrumental activities of daily living, Gerontologist, 9 (1969), pp. 179-186, https://doi.org/10.1093/geront/9.3_Part_1.179 J. Cohen. Statistical Power Analysis for the Behavioural Sciences, (Second ed.), Erlbaum, Hillsdale NJ (1988) L.R. Pollack, S. Litwack-Harrison, P.M. Cawthon, K. Ensrud, N.E. Lane, E. Barrett-Connor, T.T. Dam. Patterns and predictors of frailty transitions in older men: the osteoporotic fractures in men study, J. Am. Geriatr. Soc., 65 (2017), pp. 2473-2479, https://doi.org/10.1111/jgs.15003 Z. Feng, M. Lugtenberg, C. Franse, X. Fang, S. Hu, C. Jin, H. Raat. Risk factors and protective factors associated with incident or increase of frailty among community-dwelling older adults: a systematic review of longitudinal studies, PLoS One, 12 (2017), pp. 1-18, https://doi.org/10.1371/journal.pone.0178383 J.E. McHugh, M. Dowling, A. Butler, B.A. Lawlor. Psychological distress and frailty transitions over time in community-dwelling older adults, Ir. J. Psychol. Med., 33 (2016), pp. 111-119, https://doi.org/10.1017/ipm.2015.67 A.E.M. Liljas, L.A. Carvalho, E. Papachristou, C. De Oliveira, S.G. Wannamethee, S.E. Ramsay, K. Walters. Self-reported hearing impairment and incident frailty in English community-dwelling older adults: a 4-year follow-up study, J. Am. Geriatr. Soc., 65 (2017), pp. 958-965, https://doi.org/10.1111/jgs.14687 R.J. Kamil, J. Betz, B.B. Powers, S. Pratt, S. Kritchevsky, H.N. Ayonayon, T.B. Harris, E. Helzner, J.A. Deal, K. Martin, M. Peterson, S. Satterfield, E.M. Simonsick, F.R. Lin. Association of hearing impairment with incident frailty and falls in older adults, J. Aging Health, 28 (2015), pp. 644-660, https://doi.org/10.1177/0898264315608730 D.S. Dalton, K.J. Cruickshanks, B.E.K. Klein, R. Klein, T.L. Wiley, D.M. Nondahl. The impact of hearing loss on quality of life in older adults, Gerontologist, 43 (2003), pp. 661-668, https://doi.org/10.1093/geront/43.5.661 B. Gopinath, G. Liew, G. Burlutsky, C.M. McMahon, P. Mitchell. Visual and hearing impairment and retirement in older adults: a population-based cohort study, Maturitas, 100 (2017), pp. 77-81, https://doi.org/10.1016/j.maturitas.2017.03.318.
(15) [44]. [45]. [46]. K.M. Jamsen, J.S. Bell, S.N. Hilmer, C.M.J. Kirkpatrick, J. Ilomäki, D. Le Couteur, F.M. Blyth, D.J. Handelsman, L. Waite, V. Naganathan, R.G. Cumming, D. Gnjidic. Effects of changes in number of medications and drug burden index exposure on transitions between frailty states and death: the concord health and ageing in men project cohort study, J. Am. Geriatr. Soc., 64 (2016), pp. 89-95, https://doi.org/10.1111/jgs.13877 N. Veronese, B. Stubbs, M. Noale, M. Solmi, A. Pilotto, A. Vaona, J. Demurtas, C. Mueller, J. Huntley, G. Crepaldi, S. Maggi. Polypharmacy is associated with higher frailty risk in older people: an 8-year longitudinal cohort study, J. Am. Med. Dir. Assoc., 18 (2017), pp. 624-628, https://doi.org/10.1016/j.jamda.2017.02.009 B. Bonaga, P.M. Sánchez-Jurado, M. Martínez-Reig, G. Ariza, L. Rodríguez-Mañas, D. Gnjidic, T. Salvador, P. Abizanda. Frailty, polypharmacy, and health outcomes in older adults: the frailty and dependence in Albacete study, J. Am. Med. Dir. Assoc., 19 (2018), pp. 46-52, https://doi.org/10.1016/j.jamda.2017.07.008.
(16)
Figure

+2
Documento similar
Methods: A cross-sectional study was conducted in community-dwelling participants in the “2008 Span- ish National Disability Survey”, a representative sample of 91,846 households
In this prospective study of community-dwelling older adults, higher serum leptin concentration was associated with greater risk of impairment in mobility, agility, lower
In accordance with that discussed, the aim of the present work was to examine dietary habits, nutritional status, and physical activity engagement in older adults in the city of
The expansionary monetary policy measures have had a negative impact on net interest margins both via the reduction in interest rates and –less powerfully- the flattening of the
The current study shows a prevalence of falls (25.9%) simi- lar to those observed by other authors who also focused their research on older adults living in the community.. 17 The
Relative risks (95% confidence interval) of frailty with the weight loss criteria defined as a 10% weight reduction in 2 years according to categories of sweetened bever-
Plotinus draws on Plato’s Symposium (206c4–5) – “procreate in what is beautiful” – 3 in order to affirm that mixed love (which is also a love of beauty) is fecund, although
The results of the present study are similar to those obtained in previous studies and point that institutions for older adults should offer activities that encourage participation
