Innovations in the Video Game Industry:
Changing Global Markets
Giuditta DE PRATO
Claudio FEIJÓO
Jean-Paul SIMON
Abstract: The paper examines the video game industry in the perspective of being the paradigm of innovation in digital media and content. In particular, it analyses the response to two main factors that have impacted this industry over the last decade. First, it tracks the evolution of its global market and its emerging geography with the rise of Asia. Second, within this global landscape the paper explores how the changes derived from mobile and on-line gaming enabled major transformations of this industry. From here, some conclusions on the lessons from the evolution of this sector for the whole media and content industries are presented.
Key words: games, game industry, video games, mobile games, apps, Asia, China, freemium, free-to-play, mobile, multiscreen, cross-media, smartphones, tablets, virtual goods.
O
ver the last forty years, the video games industry grew steadily, increasing its audiences worldwide, widening its demographics and adding access platforms along the way (video consoles, personal computers, portable consoles, portals, mobile handsets, tablets, etc.). Indeed, supply and demand have changed under pressure from a variety of factors such as technological developments in interfaces, devices, and networks, the emergence of social computing and communitiesand the production of simple and short games ("casual games" 1), capturing
an, until now, unsatisfied demand across age categories, socio-economic classes, or gender (JUUL, 2012, KERR, 2006). In fact, there are 1.2 billion active gamers worldwide as of 2013 2 (1s t semester: WARMAN, 2013a),
from 880 active gamers in 2012 (WARMAN, 2012), and predicted revenues of US $86.1 billion by 2016 and a compound annual growth rate of 6.7%. In other words, this industry is going more and more mainstream 3 and
becoming/has become an established form of entertainment. Besides, the industry is still expanding with new segments such as serious games (STEWART & MISURACA, 2013) and electronic sport (TAYLOR, 2012).
From authors' perspective the key element that accounts for the growth of this industry has been the ability of this digital native to deal with technological changes, in particular to rapidly innovate in synergy not only on the technological side but on the creative side, ushering in pioneering business models 4 and attracting new geographies and users. To argue for
this view, the first section of the paper sums up the main trends identified in a global landscape, namely the role of mobile communications (devices, networks) combined with the rise of the "app economy", and the move toward a multiscreen / cross-media paradigm. Section two analyses the changing geography of the global video markets stressing the rise of the Asia-Pacific region and the new role of China. Section three explores changes in the legacy value chain through the processes of disintermediation and re-intermediation. Some conclusions on the lessons from the evolution of this sector for the whole media and content industries close the paper.
1 Casual game: ease of use games (to learn, to access and to play) spanning all genres.
Classification of videogames is discussed in DE PRATO et al. (2010), see chapter 2 and 6.2.
2 Consultancy Newzoo reported.
3 The Economist (2011) traced back the move from niche to mainstream, to the launch of Sony
Play Station console in December 3rd 1994.
• A new global landscape for supply and demand
Going mobile
According to the sources (ITU, 2013: 1), there were, in 2013, almost as many mobile-cellular subscriptions as people in the world, with more than half in the Asia-Pacific region (3.5 billion users out of 6.8 billion total subscriptions). Wireless Intelligence (2012) estimated the total number of unique (eliminating subscribers with multiple SIM cards) mobile subscribers worldwide at 3.2 billion in 2012. Wireless Intelligence (2013) forecasts 8.5 billion connections by 2017 with 50% operating under the new generation of mobile networks (3G 5: 40%, 4G 6: 10%). According to the Cisco Visual
Networking Index (2013:25): "Mobile data is well on its way to become a necessity for most network users". Indeed, the shift to digital information is scaling up by several orders of magnitude in data volume every couple of years.
China and India are the fastest growing mobile (data) markets in the world. China as a whole surpassed the 1 billion milestone earlier in 2012, with three companies in the top ten mobile operators and China Mobile ranking one (ABBOTT, 2012). In the case of India, 69% of Internet users access via their mobile (McCLELLAND, 2012). India's Bharti Airtel was ranking four in the top ten mobile operators. In 2012, mobile operators revenues in BRIC 7 countries (over US $250 billion out of US $1.16 trillion in
2012, Wireless Intelligence, 2013a) represented almost 22% of total global mobile revenue (up from 16% four years ago) having already surpassed North America in terms of sales during 2011 (Wireless Intelligence, 2013b). These growth markets have already turned into primary markets.
This impressive growth results from the increasing availability (and affordability) of mobile broadband, the increasing availability (and affordability) of smartphones, and the changing role of customers as avid demanders - or even co-creators - of mobile content and applications (FEIJÓO, MAGHIROS et al., 2009). The result is a new circle between
5 3G: HSPA, EV-DO.
6 4G: LTE, TD-LTE and WiMAX. Samsung's flagship Galaxy S3 and Apple's new ¡Phone 5 are
LTE-enabled devices. ' Brazil, Russia, India, China.
supply (network, devices) and demand led by the latter - the "app" economy within which games play a major role as explained below.
Within this framework, the growth of traffic is now mainly driven by consumers (as opposed to business previously) also active as "prosumers". The growth is mainly media-led, with video being the driver (over 50% of the traffic) (Cisco, 2013) 8. In addition, cloud applications allow mobile users to
overcome the memory capacity and processing power limitations of mobile devices; reliance on cloud computing increases demand for the quantity of bandwidth as well (FEIJÓO, 2014). Games contribute decisively to this growth as they are increasingly played both from mobile devices and from the cloud - online gaming. They will also use increasingly more advanced graphics and controls, going from normal definition to high definition and ultimately 3D graphics, and including augmented reality elements (FEIJÓO, GÓMEZ-BARROSO, AGUADO & RAMOS, 2012). In fact, a survey from Information Solutions (2011), with both UK and US online panellists, showed that when asked to identify which gaming-enabled device they played games on most often, 44% cited their phones, ahead of videogame consoles (21%) and computers (30%).
Smartphones and tablets, the new hardware and software platforms The number of smartphones in use worldwide reached 1.4 billion at the end of 2013. As of 2020, 8 1 % of phones sold globally will be smartphones (2.5 billion) from 26% in 2011 (400 million). Tablets are expected to reach 700 million in 2020, from 70 million in 2011, and 450 million in 2013. Tablets are considered as the "fastest ramping mobile device in history" (Morgan Stanley, 2012).
The release of the Apple ¡Phone in late 2007 played a major role to trigger such a migration while mitigating the expected negative impact of the financial crisis in mobile telecoms, as data growth in mature markets accelerated (WEST & MACE, 2009) It was also the appearance of the ¡Phone that dramatically changed the circumstances of mobile gaming from the previous modest version of gaming in feature phones (FEIJÓO et a/., 2012). Tablets and smartphones are now being adopted as gaming devices
° "Global mobile data traffic will increase 26-fold between 2010 and 2015. Mobile data traffic will grow at a compound annual growth rate (CAGR) of 92 percent from 2010 to 2015, reaching 6.3 exabytes per month by 2015". Cisco Visual Networking Index (2012).
for casual game players, driving the demand for wireless games; and becoming in turn one of the most dynamic segments. The survey from Information Solutions (2011) mentioned above showed that smartphone owners were by far the most avid mobile gamers: 93% of smartphone owners said that they played at least once each week, and 45% played daily. Jupiter Research predicts games sales for tablets up to US $ 3.1 billion in 2014 (SNJV, 2012). Gaming is currently the dominant use for tablets accounting for 67% of the time spent on that terminal (MICHAUD, 2013).
As a summary, the smartphones and tablets phenomenon allowed novel ways for users to interact with devices and screens, shifting the patterns of use toward a mobile Internet and all types of mobile media. It paved the way for the creation of new content and an array of new applications whose number has skyrocketed as discussed below.
The rise of the app economy in a platform ecosystem
A simple figure displays the absolute success of the mobile applications: within five years (July 2008-October 2013) the number of apps available for download in the Apple platform has grown from 500 to more than 1,000,000 with 60 billion downloads in total. App stores have changed - or rather disrupted - the value chain of software (distribution and pricing), and also the industries of music, books, and games in particular. The mobile app market is expected to be worth $27 billion in 2013 from revenue generated directly from apps according to Appnation (Appnation, 2013).
Along these lines, the first 'State of the App Economy Report' (Appnation, 2013) predicts that the largest contributor to this growth will be the app-enabled commerce, with revenue from downloads, in-app advertising and virtual goods complementing this. The total size of the 'app economy' is expected to hit US $151 billion by 2017, more than double the US $72 billion forecast for 2013. Revenues from games increased at a 66% CAGR over 2013 (FERGUSON, 2014).
Asia is "the most lucrative app market in the world" (Distimo quoted by COSTELLO, 2014), with 4 1 % of total revenue generated globally in December 2013 coming from this region. In comparison, North America generated 31% of the total, while Europe accounted for 23%.
The top grossing ¡OS and Android apps generally came from games. In September 2012, games accounted for 64% of the combined total, a year later; this had increased to 77%. The ¡OS market (¡Pad, ¡Phone and ¡Pod Touch) generates 89% of its revenues from mobile gaming 9 (Newzoo, 2012
quoted by SNJV, 2012). Also games were the most downloaded apps across the ¡Phone (33%), ¡Pad (48%), from Google Play (37%) and the Amazon Appstore (a remarkable 63%) in 2013, according to a study from Distimo. App Store dominates in mobile game sales, but Google Play is catching up fast. The top three Apple store titles in 2013 were Clash of the Clans (Supercell), Candy Crush Saga (King) and Hay Day (Supercell). For Google Play, the top three grossing apps were Candy Crush Saga, Puzzle & Dragons (GungHo) and messaging title LINE.
Besides, a host of Android-based tablet rivals have also expanded the market considerably, including Amazon's Kindle Fire and its successors, Google's Nexus line and Samsung Galaxy devices; many of them more affordable than Apple products. Thus, the installed base of mobile and portable devices used for gaming will grow from nearly 800 million in 2012 to more than 1.2 billion by 2014, with Android-powered devices seeing the strongest growth in market share at the expense of gaming-optimised handhelds such as the Nintendo DS and Sony PlayStation Vita. According to IDC and App Annie (FERGUSON, 2013), revenue in 2013 is on track to top US $12 billion, with in-app purchases generating the lion's share (51%), followed by paid app sales (44%) and advertising (5%). Each of these platforms uses a particular strategy for the combination of the device and the software to operate it. From relatively close strategies a-la-Apple to open-but-not open strategies a-la-Android (FEIJÓO, 2012).
Moving to a multiscreen / multichannel world: A new allocation of screens
In the US, as of December 2012, more than three-quarters of adults owned a laptop or desktop computers and about 45% of adults owned a smartphone (PEW, 2013); and the number of adult tablet owners grew by about 50% since the summer of 2011, up to 3 1 % (PEW, 2013). 62% of smartphone owners said they consume news on their device weekly, and 64% of tablet owners, (PEW, 2013). In this increasingly multichannel
y Based on the revenues from the 200 most popular games in the ¡Pad, ¡Phone/iPod App Store
scenario, 25% of US consumers play digital games every day, which makes it one of the most common daily activities -29 % read a newspaper and 14 % read a magazine every day (Ericsson, 2013).
Media and content activities are moving toward a five screen world (SIMON, 2012, 2014a): TV, PC, game consoles, connected TVs and mobile devices (smartphones or tablets). The screens are used prevalently sequentially but more and more often simultaneously (multitasking, complementary activities) and the industry starts to approach this scenario with a cross-media approach. In fact, 25% of all US gamers play on all screens (WARMAN, 2013a) and based on a US survey, a Google study claims that, in 2012, 90% of media interactions were screen-based, 4.4 hours per day (38% of media interactions were on smartphones, 9% on tablets, Google, 2012: 8), leaving a mere 10% for non-screen-based (radio, newspapers, and magazines).
As a summary, gamers a few years ago were mostly using console/TV/PC, but now they can allocate their gaming time across two additional screens in combination with the previously existing ones. This proliferation of screens at the same time enables ubiquitous or cross-media gaming (MICHAUD, 2013) across platforms. Therefore, to better track the changes in the games market, the consultancy Newzoo proposed a new screen segmentation: entertainment screen, computer screen, floating screen 10 , and personal screen. As of the first semester of 2013, the
distribution of revenues was the following: computer screen 39%, entertainment screen 36%, floating screen 13%, and personal screen 12% (WARMAN, 2013b).
• Changes in the global video game market
Regional markets for video games: Asia rising
Developed regions such as Europe, the US and Japan, have been the main markets for video games until 2009: these regions accounted for over one half, or €26 billion, of the video games market (IDATE, 2011). The
l u This category appears to be less obvious to grasp, but it basically includes handheld
EMEA 11, once the biggest market for video games among the four major
world regions, was overtaken by Asia-Pacific in 2010. The main engine of this shift is the on-line and mobile segment. If the US is still the leading market, the next three are located in this region, respectively: Japan, China and South Korea. In 2012, Asia-Pacific (APAC) accounted already for 33% of the global market (US $ 22.2 billion of revenues, 298 million gamers) growing at a 13% rate, followed by North America with 32% (21.8 billion, 169 million gamers) growing at a mere 1%, then Europe with 28% (18.8 billion, 274 million gamers) growing at 3% (WARMAN, 2013a). The same consultancy, Newzoo, predicts that 38% of games revenues will be generated by APAC by 2016 (WARMAN, 2013a). In addition, games is the fastest growing Internet category in India (McCLELLAND, 2012).
Online gaming in the People's Republic of China represented one of the largest and fastest growing Internet business sectors in the world (Radoff, 2009). The Chinese games industry reached, as of 2012, estimated revenues of US $9.7 billion (2012 China Games Industry Report, quoted by HANDRAHAN, 2013), online gaming accounted for 90% of this total. Moreover, mobile is expected to grow by 50% year on year until 2015 reaching US $3.5 of revenues and 455 million gamers (ZhenFund, 2013).
Figure 1 - The growth of online gaming in China
online gaming market
^ ^ * _ _ 2*s«L._
m..•Mill
acqs 09 ifl Li u :: M ISSource: Morgan Stanley (2012), China n Gaming Industry Report. Quoted by The Economist (April 2013), Special report: China and the Internet
n 1 Yuan: 0,12 Euro as of April 2014
The Chinese online gaming industry illustrates two striking facts. The first is that the number of consumers and their spending have grown extraordinarily fast: in absolute terms far more people are online to shop,
play games, search, watch videos and use social media in China than in any other country. The second is that consumers are spending almost all of that time and money on Chinese Internet platforms.
Table 2 - Top 20 companies by game revenues '"' (2012)
Company
Activision Blizzard Sony
Microsoft
Electronic Arts (EA) Tencent Nintendo DeNa GREE Ubisoft Konami Zynga Apple Nexon Net Ease
Take Two Interactive Namco Bandai Square Enix Disney Facebook Capcom Country US US US US China Japan Japan Japan France Japan US US South Korea China US Japan Japan US US Japan
Revenues US$ million
4.856 4.589 4.557 3.956 3.627 2.775 1.841 1.735 1.639 1.404 1.281 1.262 1.254 1.248 1.063 1.021 878 857 810 780 Growth rate 2% -20% - 1 % 2% 40% -27% 7% 36% 18% -20% 12% 65% 10% 22% 24% -5% 0% -6% 45% 12%
' ' The consultancy lists revenues from games not only from "pure players" but also from other companies such as Apple or Facebook that derives some of their revenues from games in a significant fashion.
Source: Newzoo (2014).
The data is based on analysis of annual and quarterly financial reports of the universe of relevant publicly listed companies. Revenues exclude hardware sales and other non-game sales where possible. Authors' emphasis. See http://www.newzoo.com/free/rankings/top-25-companies-bv-qame-revenues/#bubkvLzRXq5XPISD.99
As a consequence, China is witnessing considerable changes in its games market. For instance, new alliances are being inked, as illustrated by the July 2012 strategic relationship between Activision Blizzard and Tencent Holdings Limited to bring Call of Duty Online to Chinese game players 12.
Also some international titles are already popular like Temple Run 2, Angry Birds and Fruit Ninja. Rovio opened its Chinese office at the beginning of 2012, and its first Angry Birds activity park in Shanghai at the end of that same year.
US and Japanese companies continue to dominate the market (Table 2) with nine out of 20 among the top companies (by game revenues) for the US and seven for Japan. However, new companies are climbing up reflecting changes in the global market. The entry of two Chinese companies (Tencent, NetEase) with very high growth rates of revenues (40% and 22%: 2011-2012) is to be noted. The two companies were not even included in the top 20 in 2009 (DE PRATO et a/., 2010: 41). During the 1s t semester of
2013, Tencent became n°1 (Newzoo, 2014). By the same token, the entry of Apple is noticeable with a comparable growth rate indicating the strength of its ecosystem. Zynga's position reveals as well the strength of mobile and social networks, main distributors of "Free-to-Play" games like Zynga, hence the position of Facebook in the table, illustrating an extreme case of interdependence between players. Google entered the ranking 13 in 2013,
with an even higher rate of growth: 250%. These fast changes illustrate the dynamism of this industry but its versatility as well.
Declining segments: consoles and PC-based games
There are some significant differences in the dynamics of individual segments in terms of platforms (PC video games, home consoles and handheld console games vs. online games and mobile games). Some segments are declining (consoles and PCs), while other are growing fast (on-line and mobile games). Regions display specificities with the respective share of each platform.
Games sold for home consoles and handheld devices have still the highest share in the total sales of video games: 49% in 2011 (IDATE, 2012: 36% for home consoles and 13% for handheld devices) but down from 70% in 2004 (PWC, 2009). North America remains the main market for this segment: in 2011 49% of the US households owned a dedicated game console (ESA, 2012), up to 56% in 2012 (Nielsen, 2012). The EMEA and Asia-Pacific regions followed respectively. Although declining in relative share, the new consoles are likely to reignite the segment for some time; in
fact IDATE forecasts some growth until 2016, to be followed by a decline (MICHAUD, 2013). The market share of PC-based games was steadily growing up to 2000, but has been declining since. PC-based gaming is very significant in the EMEA area in comparison with the other regions. The decline of the PC video games market is not yet as marked as it is in North America, although with national differences. Nevertheless, accessing to highly-diffused genres of games, such as Massively Multiplayer Online Games (MMOGs), still required a PC, and this will bring an element of stability to the market for some time. The PC business context reflects low entry barriers, which are free from proprietary restriction and manufacturers' licensing fees, and benefit from lower development costs compared to consoles (no need for specific - and highly expensive - software development kits, with very low costs of duplication and deployment).
On-line and mobile games as engines of growth
Second to consoles, on-line and wireless video games 1 4 are the next
largest product segments, reaching a 44% share (on-line games: 32%, mobile games: 12%) (IDATE, 2012). The basic distinction for online games is drawn between single user games and multiplayer games. The former are generally available as "browser games", which are played by means of a web browser and typically do not require additional software, specific to the game, to be installed. Multiplayer games, however, are instead usually (still) played in the form of "client-based games", where the activity required of the client machine is still relevant, its performance and elaborating power still matter.
On-line and mobile games are characterized by two major business models: pay (subscription usually the case for MMOGs) and freemium (with free basic features: free trial period, full version for a fee) which is alternatively called also free-to-play (F2P: the content is made available for free on line) 15. The free-to-play business model is now dominating in the
world-wide market for mobile games (Mobile Game Arch Roadmap, 2013). The transition is even speeding up with an unprecedented wave of MMO
14 These kinds of games do not have the same technological features and are not in the same
segment, however it is easier to present together as they differ from all former platforms.
1 5 Freemium is often included within the F2P category, the distinction is not stabilised and
keeps on moving. There is some "hybridization" between pay and free models: see DAVIDOVICI-NORA (2014: 14) in this issue.
games going from a paid subscription model to the F2P model) (MICHAUD, 2013). According to research by NPD Group's Insights into the Freemium Games Market report (2012, quoted by Mobile Business Briefing): "Freemium games appear to have a high retention rate, with 84 percent of users continuing to play after their initial interactions".
Since 2004, the online and wireless market has grown with remarkable rapidity, driven by the increase in the number of broadband subscribers, the innovation in available games, the transition to handheld devices, and the newest generation consoles: e.g. Nintendo DS Wifi Connection was launched in November 2005, and both Microsoft and Sony launched their online services for gaming consoles between late 2003 and early 2004. 16
Now as smartphones provide the engine for growth the mobile segment is likely to become the fastest-growing video games sector over the next five years according to PriceWaterhouseCoopers (PWC, 2013) with revenues increasing from US $8.8 billion in 2012 to US $14.4 billion in 2017 with a CAGRof 10%.
Asia-Pacific is leading for on line and mobile games and has been a pioneer in the field. Freemium is also the leading business model in Asia according to Distimo (COSTELLO, 2014). With sales of US $9 billion (PWC, 2010), the Asia-Pacific region was already the biggest market of online and wireless video games in 2009. Mobile Multiplayer Games (MMG) will be the largest share by 34% of the total mobile games by 2017 in Asia 17, and
spending on virtual economy / in-game transaction will increase from current 20 to 52% over the same period. It is expected that the Asia mobile gaming market will reach 50% of total global value (AHMAD, 2013). The emerging revenue stream from selling virtual goods on line, an innovation born in Asia with leading companies like Tencent for social networking and online gaming (SNOW: Wi, 2009, In-Stat, 2010 a,b), is gaining momentum. Tencent has converted most of its hundreds of millions of social-media users into paying customers, mainly for virtual items in games.
I b It must be taken into account that figures on online games only refer to subscription fees,
while retail purchases of games are accounted for in the relevant categories: PC, console or handheld.
1 7 The consultancy includes the following sub-regions: Asia-Pacific, Southeast Asia, Central
Box 1 - Tencent. King of SNOW
Founded in November 1998, Tencent has grown into one of China's largest and most used Internet service portals. On June 16, 2004, Tencent Holdings Limited (SEHK 700) went public on the main board of the Hong Kong Stock Exchange. In 2012, total revenues were US $6,983.3 million, an increase of 54 % over the year ended December 31,2011.
As one of the four online platforms of Tencent, Tencent Games (QQ Game Platform for online games) is an online game developer and operator, and is recognized as the largest online game community in China. Other services include QQ, Weixin and WeChat (400 million users) for communications; Qzone for social networking; QQ.com for information; as well as an eCommerce open platform. Tenpay has a 2 1 % share of the online payment market.
Games revenues are included in the revenues from Internet value-added services (IVAS) US $5,090.3 million, and in mobile & telecommunications value-added services: US $592.3 million). The company stresses that for IVAS, item-based sales enjoyed a strong year-on-year revenue growth; and that for MVAS, mobile games and mobile books continued to grow significantly.
More than 50% of Tencent employees are R&D staff. Tencent has obtained patents relating to the technologies in various areas: instant messaging, e-commerce, online payment services, search engine, information security, gaming, and many more. In 2007, Tencent invested more than RMB 100 million in setting up the Tencent Research Institute, China's first Internet research institute, with campuses in Beijing, Shanghai, and Shenzhen. The institute focuses on the self-development of core Internet technologies, in pursuing its development and innovation for the industry.
Sources: http://www. tencent. com/en-us/at/abouttencent. shtml, http://www. tencent. com/en-us/content/ir/news/2013/attachments/20130320.pdf
Social networks like Facebook contributed to popularize the games on these platforms (Zynga's Farmville being a main example) offering simple games, however based on servers allowing the kind of interaction offered by MMOGs, and fuelling audience and revenue growth in the online games segment. The Chinese game Happy Farm (2008) was included in Wirecfs list of "The 15 Most Influential Games of the Decade" (at 14), for its major influence on social network games, inspiring dozens of Facebook clones like
FarmVille (RADOFF, 2009). Social networks are now a fully-fledged platform
on their own (MICHAUD, 2013), experiencing exponential growth since 2010, reaching 186.7 million gamers in 2013. In fact, 45.7% of gamers play online games on social networks according to IDATE (MICHAUD, 2013).
The social gaming market amounted to 55.3% of the total online gaming market (MICHAUD, 2013).
• From disintermediation to re-intermediation
The previous section reviewed the role of online and mobile games as an engine of change with regard to previous dominant platforms. In this section we will quickly 18 shed some light on the potential transformations that this
value chain might incur as a consequence of the disruptive trends brought by these two new platforms: online and mobile.
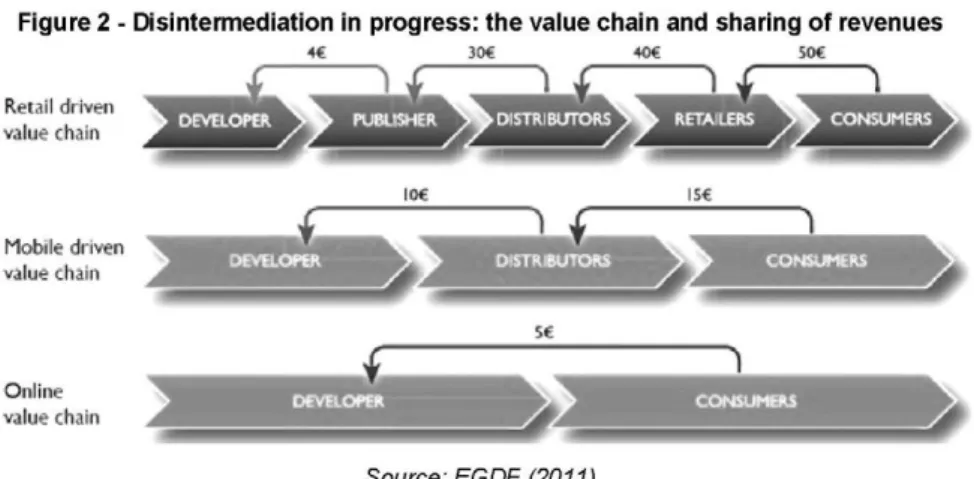
Indeed, online digital distribution has affected the value chain structure, resulting in a convergence of the roles of the distributor and of the retailer under the range of activities of the publisher. Online gaming introduced new distribution methods and started to rearrange the relative roles and interaction dynamics among the actors at the different levels in the supply chain. A whole part of the core business involving publishers, distributors and retailers has basically disappeared as there is no longer any need to duplicate physical products because these can be distributed over the network. The publisher, in many cases, directly distributes games, without the need for a distributor to act as intermediary between the publisher and the retailer: i.e. "disintermediation" is taking place, cutting out the role of the distributor. By the same token, it creates opportunities for developers to circumvent existing intermediaries and to sell directly to the end customers as illustrated by Figure 2.
These changes to the value chain of online video games, as compared with that of "traditional" video games, affect not only the interactions between the actors in the value creation process, but also the type and number of actors involved. Different types of games are affected to different extents. Though the characteristics of browser-based games have heavily reduced the need for distributors and retailers for logistic support, portals and dedicated sites with adequate visibility are required. With direct sales a developer selling will receive the sole 5 Euros paid by the consumer, instead of the 4 he was getting through the traditional value chain (out of 50 typically paid by the consumer).
10 For a broader presentation see DE PRATO et al. (2010), DE PRATO (2012), DE PRATO et al. (2014), FEIJOO et al. (2012), FEIJOO et al. (2013).
Figure 2 - Disintermediation in progress: the value chain and sharing of revenues
« 30* « * AC Retail driven
value chain ^ H V.^H nt^JÉ W& ^KL B ^
Online value chain
Source: EGDF (2011)
This is not necessarily true for client-based online games, particularly the complex and expensive games, which in many cases still rely on the more traditional chain to reach consumers. As noted by M. DAVIDOVICI-NORA (2013), about "freemium": acquisition is not obvious, retention is volatile and monetization complex. The low barriers to entry are not equivalent to a new form of pervasive online publishing; the expertise of an intermediary, such as the publisher may be required (not to mention the marketing/ promotion of the product). Hence the emergence of new forms of "re-intermediation" brought by Internet Service Providers (ISPs), online shops such as App Store, PSN, and XBLA, and social networks like Facebook. These new platforms act as content aggregators and provide portals for game distribution which allows easier promotion and localization of new games by users; at the same time they attract advertising which brings an added source to the mixed revenue models. These new intermediaries are taking on the role previously played by distributors. Their growing role being partly based on the monetization of players' personal data raises new issues and triggered reactions from citizen and policy makers (TUBARO et al., 2014). Besides, policy makers have concerns about the FtoP model, about games advertised as "free" that may mislead consumers about the true costs involved 19.
1 9 After the UK's Office of Fair Trading (March 2014) investigated in-app purchases and
free-to-play games, the European Commission got involved.
See: http://www.ieuxvideo.com/news/2014/00070763-la-commission-europeenne-se-penche -sur-les-free-to-plav.htm
• Conclusion
Despite some turbulences in the recent years due to changes in the business models (LE DIBERDER, 2012), the need for established players to adapt to the changes (MICHAUD, 2013), and some declining segments (consoles and PCs), the games market is in a healthy state with exceptional growth dynamics forecasted.
Sources of revenues and business models are bound to change, and to keep evolving at the same pace as the underlying products, or services. The F2P model is introducing games as a service with monetization taking place during the game which in turn drives the developer and publisher to keep the gamer on line as long as possible. Publishers are motivated adopting the virtual items model by the huge difference in sales life span between virtual items and the games themselves. A single virtual item product could be sold online for years, while the "productive" life of a standard game is of some (or, more often, only a few) months. Among the changes in business models, new funding opportunities are opening up with, for instance crowd-funding (RAMOS, 2014; SIMON, 2014b), paving the way for community management and echoing the new consumer behaviour.
Consumer behaviour has evolved over the past few years and has allowed the viral diffusion of online gaming to take place at an unexpected pace. Both user engagement and the increasingly active role of users have been sustained by the interactive and social nature of the online gaming experience. This is seen as a first step for users towards interaction with the game itself, to the creation of content paving the way for community management. Nevertheless, this trend could take time to establish itself and one should be cautious about predicting the different paths it could follow and also about its potential impact on industry, as for instance new competencies like community management become critical.
The proliferation of devices leads to an era of "ubiquitous games" and cross-media experiences. The demand from users for a coherent gaming experience will increase the need for developers and publishers for a multiplatform strategy, it will create further tensions with the exclusivity strategy of console manufacturers. Evolving from mere entertainment into virtual worlds, the online game segment is providing a marketplace for online economic activities (Wl, 2009).
Asia is paving the way. The global market and its geography are changing and old and new companies are aiming for the Asian market as
illustrated throughout the paper as a way of counterbalancing more mature markets.
Therefore, as a final conclusion, it can be said that these innovations introduced in the games industry have allowed it to successfully overcome first the transition to digitization and then the advent of new platforms, wider demographics and saturation of geographically mature markets. This is not to say that the game industry is immune to crisis and/or difficulties, such as satisfying gamers' expectations while increasing their figures, but arguably has put this industry at the forefront of media and content industries in terms of digital development.
References
ABBOT, M. (2012): "The top 20 global operator groups by mobile connections", Q2.
http://www.mobileworldlive.com/the-top-20-global-operator-groups-by-mobile -connections-g2-2012
AHMAD, K. (2012): Mobile Gaming Asia, 2nd ed., MindCommerce.
http://fr.slideshare.net/kabirahmad/mobile-qaminq-asia-2nd-edition#btnPrevious
Appnation (2013): "State of the App Economy Report".
http://appnationconference.com/main/research/
Atelier Paribas (2013): Big data, big culture?
http://www.forum-aviqnon.org/sites/default/files/editeur/EtudeATELIER FA 2013.pdf BRADSHAW, T & MILNE, R. (2014): "Play it again", Financial Times (5), March 24. Cisco Visual Networking Index (2013): Global Mobile Data Traffic Forecast Update,
2012-2017, February.
http://www.cisco.com/en/US/solutions/collateral/ns341/ns525/ns537/ns705/ns827/whi
te paper c11-520862.pdf
COSTELLO, S. (2014): "Asia leading the way for apps".
http://www.mobileworldlive.com/asia-leadinq-way-apps
DAVIDOVICI-NORA, M.:
- (2013): "The economics of Free-to-Play", Presentation at: Evolution of video games
industry's ecosystems, Innovation and Regulation Chair / Mosaic conference, Paris,
December 4, 2013. http://innovation-regulation2.telecom-paristech.fr/
- (2014): "Paid and Free Digital Business Models Innovations in the Video Game Industry", Communications & Strategies, No. 94.
DE PRATO, G.:
- (2014): "The video games industry", in DE PRATO, G., SANZ, E. & SIMON, J.-P. (Eds), Digital Media Worlds; The new media economy, Oxford, Palgrave.
- (2012): "Les jeux en ligne: un laboratoire de modeles d'affaires", in SIMON, J.-P. & ZABBAN, V., "Les formes ludiques du numérique. Marches et pratiques du jeu video", Réseaux, Vol. 30, n° 173-174, pp. 54-75, La découverte, Paris.
DE PRATO, G., SANZ, E. & SIMON, J.-P. (Eds) (2014): Digital Media Worlds; The
new media economy, Oxford, Palgrave.
DE PRATO, G., FEIJÓO, C , NEPELSKI, D., BOGDANOWICZ, M. & SIMON, J.-P. (2010): "Born digital / Grown digital. Assessing the future competitiveness of the EU video games software industry", JRC Scientific and Technical Report, 24555 EN.
http:////ipts.|rc.ec.europa.eu/publications/index.cfm
EGDF - European Games Developer Federation (2011): Game development and
digital growth. Available at: www.egdf.eu
Ericson Mobility Report (2013): November.
http://www.ericsson.com/res/docs/2013/ericsson-mobilitv-report-november-2013.pdf
ESA - Entertainment Software Association:
- (2013): Essential Facts about the Computer and Video Game Industry.
http://www.isfe.eu/sites/isfe.eu/files/attachments/esa ef 2013.pdf - (2012): Essential Facts about the Computer and Video Game Industry.
http://www.isfe.eu/sites/isfe.eu/files/attachments/esa ef 2012 O.pdf
FCC - Federal Communications Commission (2012): Media Ownership NPRM, 26 FCC Red at 17494-96.
https://prodnet.www.neca.org/publicationsdocs/wwpdf/fcc1281.pdf
FEIJÓO, C :
- (2012): "An Exploration of the Mobile Gaming Ecosystem from Developers' Perspective", in P. ZACKARIASSON (Ed.), The Video Game Industry: Formation,
Present State, and Future (pp. 76-95), New York & London: Routledge.
- (2014). Next generation mobile networks and technologies: Impact on mobile media. In G.Goggin & L. Hjorth (Eds.), The Routledge Companion to Mobile Media. New York & London: Routledge.
FEIJÓO, C , MAGHIROS, I., ABADIE, F. & GOMEZ-BARROSO, J.L. (2009): "Exploring a heterogeneous and fragmented digital ecosystem: mobile content",
Telematics & Informatics, 26(3), 282-292. doi:doi:10.1016/j.tele.2008.11.009.
FEIJÓO, C , GÓMEZ-BARROSO, J.L., AGUADO, J.M. & RAMOS, S. (2012): "Mobile gaming: Industry challenges and policy implications", Telecommunications Policy, 36, 212-221. doi:10.1016/j.telpol.2011.12.004.
FEIJÓO, C , GELABERT, J., LINDMARK, S., MATÍA, B. TARÍN, C. & VILLAR, J.P. (2013): Public and Commercial Models of Access in the Digital Era, European Parliament, http://www.europarl.europa.eu/studies
FERGUSON, T.:
- (2013): "Mobile gaming: multiple devices and regional shifts", Mobile World Live, 10 December. Available at: http://www.mobileworldlive.com/
- (2014a): "App usage rockets in 2013; 2014 "crucial" for messaging apps - Flurry", 14 January. Available at: http://www.mobileworldlive.com/
- (2014b): 'King focuses on China with Tencent 'Candy Crush' launch", 17 April. Available at: http://www.mobileworldlive.com/
GSMA Intelligence:
- (2012): "Global mobile penetration - subscribers versus connections".
https://wirelessintelligence.com/analysis/2012/10/global-mobile-penetration-subscribers-versus-connections/354/
- (2013)a, "BRIC markets generating almost a quarter of global mobile sales".
https://wirelessintelligence.com/analysis/2013/02/bric-markets-generating-almost-a-guarter-of-global-mobile-sales/368/
- (2013b): "Global and regional mobile revenue trends".
https://wirelessintelligence.com/analysis/2013/01/global-and-regional-mobile-revenue-trends/367/
HANDRAHAN, M. (2013): "Chinese Games Industry Hits $9.7 Billion in 2012", gamesindustry International. http://www.gamesindustrv.biz/articles/2013-01-08-chinese-games-industrv-hits-USD9-7-billion-revenues-in-2012
IDATE:
- (2012): World Video Game Market. Available at: www.idate.org
- (2011): World Video Game Market. Available at: www.idate.org
Information Solutions (2011): "2011 PopCap Games Social Gaming Research".
http://www.infosolutionsgroup.com/pdfs/2011 PopCap Social Gaming Research R esults.pdf
In-Stat:
- (2010a): The Digital Entertainment Revolution, White Paper, IN1004828WHT, February. Available at: www.in-stat.com (last accessed: 12 March 2010).
- (2010b): Virtual Goods in Social Networking and Online Gaming. Available at:
www.in-stat.com
IPSOS Media (2012): Next Level Observations on the UK gaming market. Bite Sized
Thought Piece. Ipsos Media City.
http://www.isfe.eu/sites/isfe.eu/files/attachments/ipsos thoughtpiece nextlevel.pdf ITU - International telecommunication Union (2013): ICT Facts and Figures, Geneva, Switzerland.
http://www.itu.int/ITU-D/ict/facts/material/ICTFactsFigures2013.pdf
JUUL, J. (2012): A casual revolution: Reinventing video games and their players, Cambridge, The MIT Press.
KERR, A. (2006): The Business and Culture of Digital Games. Gamework and
Gameplay, London, Sage.
Korea Information Society Development Institute - KISDI (2012): 2012 Media and
Communication Outlook of Korea, Gyeonggi-do, South Korea.
LE DIBERDER, A. (2012): "Le modele économique des jeux video, un colosse en peril", in LAFRANCE, J.-P. (Ed.): Les jeux video. Quand jouer c'est communiquer,
Hermes, n° 62, pp. 136-143, Paris, CNRS.
McCLELLAND, S. (2012): "The big picture/The rise of Asia", Intermedia, Vol.40, Issue 4, pp. 16-17.
MICHAUD, L. (2013): "Evolution of video game industry ecosystem(s). Business models and trends in the evolving market for video games", Presentation at:
Evolution of video games industry's ecosystems, Innovation and Regulation Chair /
Mosaic conference, Paris, December 4, 2013. http://innovation-regulation2.telecom-paristech.fr/
"Mobile Business Briefing" (2012): Mobile World Live, 26 April. Available at:
http://www.mobileworldlive.com/
Mobile Game Arch Roadmap (2013): http://www.mobilegamearch.eu/wp-content/uploads/2013/09/Mobile-Game-Arch D33 13September 2013 v20.pdf Morgan Stanley (2012): Tablet Landscape Evolution. Window(s) of Opportunities.
http://www.morganstanley.com/views/perspectives/index.html
Newzoo:
- (2014): Top 25 Companies by Game Revenues.
http://www.newzoo.com/free/rankings/top-25-companies-by-game-revenues/
- (2013): Top 25 Companies by Game Revenues.
http://www.newzoo.com/free/rankings/top-25-companies-by-game-revenues/
- (2012) Top 25 Companies by Game Revenues.
http://www.newzoo.com/free/rankings/top-25-companies-by-game-revenues/
Nielsen (2012): Trends In U.S. Video Gaming - The Rise Of Cross-Platform.
http://www.gamesindustrvblog.com/2012/03/trends-in-u-s-video-gaming-the-rise-of -cross-platform/
Pew Research Center, Project for Excellence in Journalism (2013): The State of the
News Media 2013. http://lournalistsresource.org/studies/societv/news-media/news-media-2013-pew-research-center#sthash.lOR8GJbr.dpuf
PriceWaterhouseCoopers:
- (2013): Global Entertainment and Media Outlook 2013-2017.
http://www.pwc.com/gx/en/index.|html?ld=no
- (2010): Global Entertainment and Media Outlook 2010-2014.
RADOFF, J. (2009): "Chinese Online Game Market Roundup Q3 2009".
http://radoff.com/bloq/2009/11/26/chinese-online-qame-market-roundup-q3-2009/
RAMOS, J. (2014): Crowdfunding and the Role of Managers in Ensuring the
Sustainability of Crowdfunding Platforms, JRC Scientific and Technical Report 26596
EN. http://ipts.¡rc.ec.europa.eu/publ¡cat¡ons/pub.cfm?¡d=7243
SIMON, J.-P.:
- (2014a): "Media in the changing media-IT- telecom ecosystem", in DE PRATO, G., SANZ, E. & SIMON, J.-P. (Eds), Digital Media Worlds; The new media economy, Oxford, Palgrave.
- (2014b): " Production, Consumption and Innovative New Business Models", in DE PRATO, G., SANZ, E. & SIMON, J.-P. (Eds), Digital Media Worlds; The new media
economy, Oxford, Palgrave.
- (2012): The Dynamics of the Media and Content Industries: A Synthesis.
http://is.irc.ec.europa.eu/paqes/ISG/MCI.html
SNJV - Syndicat National du Jeu Video (2012): Les chiffres des marches du jeu
video dans le monde et en France, http://www.sniv.org/fr/industne-francaise-ieu-video/ (last consulted February 2013).
STEWART, J. & MISURACA, G. (2013): The Industry and Policy Context for Digital
Games for Empowerment and Inclusion: Market Analysis, Future Prospects and Key Challenges in Videogames, Serious Games and Gamification, JRC Scientific and
Technical Report, 25910 EN. http:////ipts.jrc.ec.europa.eu/publications/index.cfm
TAYLOR T. L. (2012): Raising the Stakes: E-sports and the Professionalization of
Computer Gaming, Cambridge, The MIT Press.
The Economist (April 2013): Special report: China and the Internet.
http://www.economist.com/printedition/2013-04-06
TUBARO, P., CASILLI, A. & SARABI, Y. (2014): "Against the Hypothesis of the End of Privacy. An agent-based Modelling Approach to Social Media", Springer Briefs In
Digital Space.
WARMAN, P.:
- (2013a): "Global Monetization of Games. Emerging Markets as Drivers of Growth", presentation at Casual Connect San Francisco, July 30-31.
http://fr.slideshare.net/Newzoo/newzoo-casual-connect-usa-2013
- (2013b): "Mobile Gaming. A Global View on Impact and Opportunities".
http://fr.slideshare.net/Markies/newzoo-mobile-first4iunev1
- (2013c): "Consumers v. Metrics", presentation at the Mobile Games Forum, 2013.
http://www.newzoo.com/kevnotes/mobile-qames-forum-2013-sinqle-screen-metrics-in-a-multi-screen-world-followinq-consumers-in-chanqinq-old-habits/
WEST, J. & MACE, M. (2010): "Browsing as the killer app: Explaining the rapid success of Apple's ¡Phone", www. ¡oelwest.org/Papers/WestMace2010-WP.pdf.
Wl, J. H. (2009): Innovation and Strategy of Online Games, London, Imperial College Press.
ZhenFund (2013): "Opportunities in China's Startup Ecosystem".
http://fr.slideshare.net/ZhenFund/opportunities-in-chinas-startup-ecosystem -23150783