Factors associated with poor physical performance in older adults of 11 Peruvian high Andean communities
15
0
0
Texto completo
(2) F1000Research 2019, 8:59 Last updated: 12 MAR 2019. support, number of drugs used, urinary incontinence, exhaustion and cognitive impairment. Future studies with a larger sample and longitudinal follow-up are needed to design beneficial interventions for the high Andean population. Keywords Physical performance, Altitude, Elderly, Latin America, Peru. Corresponding author: Fernando M. Runzer-Colmenares ([email protected]) Author roles: Urrunaga-Pastor D: Conceptualization, Data Curation, Formal Analysis, Investigation, Methodology, Validation, Visualization, Writing – Original Draft Preparation, Writing – Review & Editing; Runzer-Colmenares FM: Conceptualization, Data Curation, Formal Analysis, Investigation, Methodology, Validation, Visualization, Writing – Original Draft Preparation, Writing – Review & Editing; Arones TM: Investigation, Writing – Original Draft Preparation, Writing – Review & Editing; Meza-Cordero R: Investigation, Writing – Original Draft Preparation, Writing – Review & Editing; Taipe-Guizado S: Investigation, Writing – Original Draft Preparation, Writing – Review & Editing; Guralnik JM: Writing – Original Draft Preparation, Writing – Review & Editing; Parodi JF: Conceptualization, Methodology, Validation, Visualization, Writing – Original Draft Preparation, Writing – Review & Editing Competing interests: No competing interests were disclosed. Grant information: The author(s) declared that no grants were involved in supporting this work. Copyright: © 2019 Urrunaga-Pastor D et al. This is an open access article distributed under the terms of the Creative Commons Attribution Licence, which permits unrestricted use, distribution, and reproduction in any medium, provided the original work is properly cited. How to cite this article: Urrunaga-Pastor D, Runzer-Colmenares FM, Arones TM et al. Factors associated with poor physical performance in older adults of 11 Peruvian high Andean communities [version 1; referees: 3 approved, 1 approved with reservations] F1000Research 2019, 8:59 (https://doi.org/10.12688/f1000research.17513.1) First published: 15 Jan 2019, 8:59 (https://doi.org/10.12688/f1000research.17513.1). Page 2 of 15.
(3) F1000Research 2019, 8:59 Last updated: 12 MAR 2019. Introduction Aging is a physiological process that involves changes in respiratory, cardiovascular, muscular, kidney and brain function1–4. In addition, these changes organically could be exacerbated in older adults living at high altitude due to the hypoxia to which they are chronically exposed, increasing their risk of suffering certain pathologies; however, there is no consensus surrounding this situation5,6. Chronic mountain sickness is a clinical syndrome that affects natives or residents living for a long time at an altitude greater than 2500 meters above sea level (masl) and is characterized by erythrocytosis that could evolve to severe pulmonary hypertension and generate congestive heart failure, affecting the ability of Andean older adults to maintain their daily activities and their physical performance7. Physical performance in the older adult has been extensively studied, and poor nutritional status8, sarcopenia9, decreased muscle mass, frailty10, sarcopenic obesity11, mortality12, disability13 and dementia14, common chronic diseases of aging, have been associated. A previous study conducted in rural Peruvian communities located at 3345 and 6 masl found that the prevalence of poor physical performance in older adults living in rural communities at sea level was twice as high as that of older adults that are residing in rural areas at high altitude15. Previous studies in high-altitude communities have described older population´s nutritional status, finding a prevalence rates of 9.4% for malnutrition16, 17.6% for sarcopenia17, 15.2% for insomnia18, 12.2% for frailty19 and 75.2% for fear of falling19. These figures are similar to those described in populations at sea level20–23. At high altitudes, an increased ventilatory response and a lower cardiac response to hypoxia will favor oxygen uptake in the lungs and allow the maintenance of a normal oxygen saturation, at moderate exercise24. In addition, tissue hypoxia, oxidative stress and the action of free radicals would be increased, affecting cardiac energy metabolism and skeletal muscle performance; in this way, a decrease in mitochondrial volume would be generated. This situation would occur in people exposed for a long time or who have returned from high altitude25,26 and significantly affect the physical performance of the older adult living at high altitude; however, there is no clear consensus regarding this process26–28, especially in the elderly. Additionally, there are no parameters or determinants in relation to the poor physical performance in older adults of the Andes, which could be different from those described for other populations, due to social or geographical conditions, or due to access to health services. Therefore, this study aimed to determine the factors associated with poor physical performance in older adults from 11 high Andean communities in Peru.. Methods Design and population Analytical cross-sectional study, carried out in inhabitants aged 60 or over from 11 high-altitude (≥1500 masl)29 Andean communities of Peru: La Jalca, Leimebamba (Amazonas), Llupa, San Pedro de Chaná, Atipayan (Áncash), Pampamarca (Huánuco), Chacapampa (Huancayo), Ayahuanco (Ayacucho), Paucarcolla. (Puno), Vilca (Huancavelica) and Viñac (Lima) during 2013– 2017 period. All inhabitants of the 11 high-altitude Andean communities included, belonged to the same ethnic group and performed a similar work activity, based mainly on agriculture, farming and trading30.. Description of the study area The National Statistics Institute of Peru (Instituto Nacional de Estadística e Informática -INEI) classifies communities with 100 houses not in a capital district, that have more than 100 individuals, located in a dispersed way without forming blocks as rural communities31. The communities were located in the Peruvian highlands as follows: a) La Jalca: urban settlement located at 2800 masl; b) Leimebamba: rural village located at 2158 masl; c) Llupa: rural village located at 3511 masl; d) San Pedro de Chaná: rural village located at 3413 masl; e) Atipayán: rural village located at 3364 masl; f) Pampamarca: urban village located at 3445 masl; g) Chacapampa: rural village located at 3358 masl; h) Ayahuanco: rural village located at 3414 masl; i) Paucarcolla: urban village located at 3847 masl; j) Vilca: rural village located at 3275 masl; k) Viñac: rural village located at 3315 masl. The Peruvian Andes weather biodiversity includes high temperatures, rainfall and cloudy seasons32. These areas have low levels of pollution; however, mining activities are endangering ecosystems sustainability33. Sample type, sample size and analysis unit A non-probabilistic, census-type sampling was performed, registering all the elderly people in the highland communities previously described. We included all or most (approximately 95%) of the geriatric population of each community (urban/ rural)34. The analysis unit was elderly person from high-altitude Andean communities (rural/urban). The final sample included 413 older adults who voluntarily signed an informed consent form accepting their participation in the study. Evaluation Participants were visited in their homes up to three times to be invited to participate in the study. Those who agreed to participate voluntarily signed a document of informed consent prior to the collection of data by the researchers34. Data was collected on sociodemographic characteristics, medical background (falls, polypharmacy, comorbidities, tobacco, alcohol and coca leaf consumption), Barthel Index, Edmonton test, exhaustion)35–37, physical performance (Short Physical Performance Battery)12, anthropometric measurements (height and weight) and cognitive status (Yesavage test and Pfeiffer Questionnaire)38,39. The interview was conducted by a geriatrician, medical doctors and medical students (previously trained by the geriatrician). All the self-reported data was collected during the interview. Measures Outcome: Poor physical performance. To evaluate physical performance in the participants, we used the Short Physical Performance Battery (SPPB). The SPPB is based on three timed tasks: standing balance, walking or gait speed, and five repetitive chair stands. The timed results of each subtest are rescaled according to predefined cut points for obtaining a score ranging Page 3 of 15.
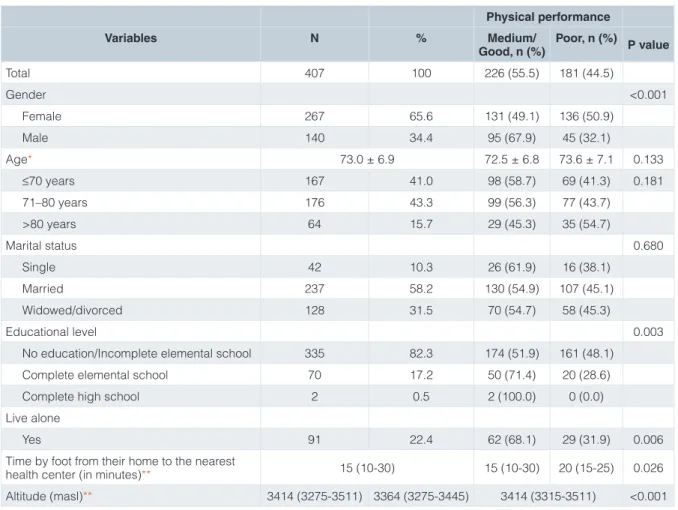
(4) F1000Research 2019, 8:59 Last updated: 12 MAR 2019. from 0 (worst performance) to 12 (best performance)40. The variable was categorized as: poor physical performance (0-6) and medium/good physical performance (7-12)12,15. Other variables Sociodemographic characteristics. The sociodemographic characteristics included and evaluated by self-report were: age (less than or equal to 70 years, 71 to 80 years, over 80 years), gender (male, female), educational level (no education/incomplete elemental school, complete elemental school, complete high school), marital status (single, married, widowed/divorced), live alone (yes or no), time by foot from their home to the nearest health centre (in minutes) and altitude (masl). The sociodemographic information was corroborated with the participant’s national identity document (ID card). Medical background. The following variables were included and evaluated by self-report: falls in the last year (none, at least 1), hospitalizations in the last year (none, at least 1), polypharmacy (5 drugs or more, under medical prescription)41, tobacco consumption (yes or no), alcohol consumption (yes or no), coca leaf consumption (yes or no), high blood pressure (HBP) (yes or no), diabetes mellitus type 2 (DM2) (yes or no), chronic obstructive pulmonary disease (COPD) (yes or no) and low back pain (yes or no). Likewise, a variable of comorbidities (obesity defined according to body mass index (BMI) + HBP + COPD + DM2 + low back pain) was constructed34,42. The medical background information was confirmed by the caregiver/family member at the time of data collection. We determined the body mass index (BMI), which was calculated with the formula weight in kg/(size in meters squared). This was categorized as follows: malnutrition (<18.5 kg/m2), normal (18.5-24.99 kg/m2), overweight (25.0-29.99 kg/m2) and obesity (>30.0 kg/m2)43. Functional assessment. We used the Barthel Index, a questionnaire about 10 basic activities of daily living (ADL) with a total score between 0–100. It was analyzed as a continuous variable and also divided into two strata: independent (100) and dependent (<100)35,44. Additionally, we use two items from the Edmonton test: 1) social support: When you need help, do you have someone who meets your needs? (always, sometimes/never); 2) urinary incontinence: Do you have trouble holding urine when you do not feel like urinating? (yes or no). The Edmonton test has 9 items and is used to evaluate frailty36. In the present study, we evaluated exhaustion, which is defined by 3 items that the participant must respond according to the way he felt during the last 2 weeks: 1) did you feel full of energy? (yes or no); 2) did you feel that you could not go on? (yes or no); 3) did you feel that all you did was with effort? (yes or no). A score equal or greater than two was considered positive for exhaustion dimension37,45. Psychological and cognitive assessment. We used the Yesavage test, which is a 5-item questionnaire that evaluates the. presence of depressive symptoms. A score equal or greater than three was considered positive for depressive symptoms38. We used the Pfeiffer Questionnaire, a 10-item questionnaire for evaluation of cognitive impairment. The strata were generated as follows: no impairment (0 to 2 errors), mild impairment (3 to 4 errors), moderate impairment (5-7 errors)39.. Statistical analysis We used STATA v14.0 for our analysis. Descriptive results were presented using measures of central tendency, dispersion measures, absolute frequencies, and relative frequencies. The characteristics of the participants with poor and medium/good physical performance were compared using the Chi square test, Fisher’s exact test, Student’s T test or the Wilcoxon rank sum test as appropriate. Two Poisson regression models (1 crude and 1 adjusted) were constructed using robust variance with the objective of evaluating factors associated with poor physical performance in the participants. The reported measure was the prevalence ratio (PR) with their respective 95% confidence intervals (95%CI). The adjusted model included the following variables: gender, lack of social support, alcohol consumption, tobacco consumption, number of drugs used, comorbidities, urinary incontinence, falls in the last year, hospitalizations in the last year, dependence ADL, exhaustion, depressive symptoms, exhaustion, cognitive impairment and altitude (masl). These variables were included in the adjusted model because they had statistically significant association with poor physical performance in the crude Poisson regression analysis. Additionally, we evaluated the possible collinearity between the exposure variables entered in the adjusted model.. Ethical issues The research project was approved by the Institutional Review Board of the Peruvian Naval Medical Centre, located in Lima, Peru. Informed consent was obtained from all the participants. In case of cognitive impairment, the family member who was present at the time of data collection gave the written consent. Furthermore, the anonymity of the participants and confidentiality of the data were ensured.. Results Sociodemographic characteristics of the study sample and bivariate analysis Of a total of 413 elderly adults, 3 participants were excluded because of severe cognitive impairment, equivalent to a score equal or greater than 8 in the Pfeiffer Questionnaire, 2 participants were excluded because they did not have variables of interest and 1 participant was excluded because of being physically incapable of performing the physical and functional performance tests (visual and auditory impairment). Finally, a total of 407 individuals were analyzed. Data from 407 elderly adults from 11 high Andean communities were analyzed. In total, 181 (44.5%) participants had poor physical performance and the SPPB mean was 7.3 ± 3.1. The Page 4 of 15.
(5) F1000Research 2019, 8:59 Last updated: 12 MAR 2019. mean age was 73.0 ± 6.9 years old (range: 60–94 years old), 267 (65.6%) participants were female, 335 (82.3%) did not count with education or had not finished elementary school, 271 (77.2%) worked in agriculture and 91 (22.4%) lived alone. Statistically significant differences were found in gender, educational level, live alone, time by foot from their home to the nearest health centre (in minutes) and altitude (masl) among physical performance groups (Table 1). Full raw data are available on OSF46.. Medical background, functional, psychological and cognitive tests in the study sample and bivariate analysis Of the 407 elderly adults evaluated, 261 (64.3%) had at least 1 fall in the last year, 48 (11.8%) were hospitalized at least once in the last year, 74 (18.2%) consumed coca leaf, 109 (19.4%) were obese according to BMI, 337 (83.0%) had disability (Barthel Index), 150 (36.9%) had depressive symptoms and 116 (28.5%) had cognitive impairment (mild-moderate) (Table 2). Factors associated with poor physical performance In the adjusted Poisson regression analysis, the factors associated with poor physical performance were: female gender (PR=1.29; 95%CI: 1.03-1.61), lack of social support (PR=2.10; 95%CI:. 1.17-3.76), number of drugs used (PR=1.09; 95%CI: 1.01-1.17), urinary incontinence (PR=1.45; 95%CI: 1.16-1.82), exhaustion (PR=1.35; 95%CI: 1.03-1.75) and cognitive impairment (PR=1.89; 95%CI: 1.40-2.55) (Table 3).. Discussion A total of 407 older adults from 11 high Andean communities were analyzed, of whom 44.5% had poor physical performance. Factors that would increase the possibility of suffering poor physical performance were: female gender, lack of social support, number of drugs used, urinary incontinence, exhaustion and cognitive impairment. Previous studies evaluated physical performance using SPPB as a measurement tool, finding diverse results. One of them, conducted in the United States with 631 older adults, calculated a SPPB average score of 9.9 in its participants, being higher than the 7.3 points found as a mean score in our population. However, the sample size of older adults lived in urban areas and was higher than the one we assessed47. On the other hand, in the InCHIANTI study cohort conducted in 542 older adults from Italy, it was found that approximately 65% of the participants with a. Table 1. Sociodemographic characteristics of the study sample and bivariate analysis. Physical performance Variables Total. N. %. 407. 100. Medium/ Poor, n (%) P value Good, n (%) 226 (55.5). 181 (44.5). Gender. <0.001. Female. 267. 65.6. 131 (49.1). 136 (50.9). Male. 140. 34.4. 95 (67.9). 45 (32.1). Age*. 72.5 ± 6.8. 73.6 ± 7.1. 0.133. ≤70 years. 167. 73.0 ± 6.9 41.0. 98 (58.7). 69 (41.3). 0.181. 71–80 years. 176. 43.3. 99 (56.3). 77 (43.7). >80 years. 64. 15.7. 29 (45.3). 35 (54.7). Marital status. 0.680. Single. 42. 10.3. 26 (61.9). 16 (38.1). Married. 237. 58.2. 130 (54.9). 107 (45.1). Widowed/divorced. 128. 31.5. 70 (54.7). 58 (45.3). No education/Incomplete elemental school. 335. 82.3. 174 (51.9). 161 (48.1). Complete elemental school. 70. 17.2. 50 (71.4). 20 (28.6). Complete high school. 2. 0.5. 2 (100.0). 0 (0.0). 91. 22.4. 62 (68.1). 29 (31.9). 0.006. 15 (10-30). 20 (15-25). 0.026. Educational level. 0.003. Live alone Yes Time by foot from their home to the nearest health center (in minutes)** Altitude (masl)**. 15 (10-30) 3414 (3275-3511) 3364 (3275-3445). 3414 (3315-3511). <0.001. *Mean ± standard deviation. **Median (interquartile range).. Page 5 of 15.
(6) F1000Research 2019, 8:59 Last updated: 12 MAR 2019. Table 2. Medical background, functional assessment and cognitive evaluation in the study sample and bivariate analysis. Physical performance Variables. N. %. 407. 100. 226 (55.5). 181 (44.5). None. 145 35.7. 117 (80.7). 28 (19.3). At least 1. 261 64.3. 108 (41.4). 153 (58.6). Total. Medium/Good, n (%) Poor, n (%). P value. Medical background Falls in the last year. <0.001. Hospitalizations. 0.041. None. 358 88.2. 205 (57.3). 153 (42.7). At least 1. 48. 11.8. 20 (41.7). 28 (58.3). 49. 12.0. 15 (30.6). 34 (69.4). 116 28.5. 41 (35.3). 75 (64.7). 74. 41 (55.4). 33 (44.6). 0 (0-1). 1 (0-3). 1 (7.7). 12 (92.3). Tobacco consumption Yes. <0.001. Alcohol consumption Yes. <0.001. Coca leaf consumption Yes Number of drugs used*. 0.981 18.2. 1 (0-2). Polypharmacy Yes Comorbidities*. <0.001 <0.001. 13. 3.2. 0 (0-1). 1 (0-1). 0.076. HBP. 44. 0 (0-1) 10.8. 23 (52.3). 21 (47.7). 0.645. COPD. 16. 3.9. 10 (62.5). 6 (37.5). 0.567. DM2. 31. 7.6. 16 (51.6). 15 (48.4). 0.648. Low back pain. 75. 18.4. 43 (57.3). 32 (42.7). BMI Malnutrition. 0.728 <0.001. 2 (66.7). 1 (33.3). Normal. 162 39.8. 3. 0.7. 108 (66.7). 54 (33.3). Overweight. 133 32.7. 73 (54.9). 60 (45.1). Obesity. 109 26.8. 43 (39.5). 66 (60.5). 0 (0-95). 70 (0-95). 0 (0-95). 0.021 0.011. Functional assessment Barthel Index* Independent. 69. 17.0. 48 (69.6). 21 (30.4). Dependent. 337 83.0. 178 (52.8). 159 (47.2). Always. 182 45.1. 134 (73.6). 48 (26.4). Sometimes/never. 222 54.9. 89 (40.1). 133 (59.9). 116 32.1. 42 (36.2). 74 (63.8). Social support. <0.001. Urinary incontinence Positive. <0.001. Exhaustion Positive. <0.001 156 45.2. 72 (46.2). 84 (53.8). 150 36.9. 62 (41.3). 88 (58.7). No impairment. 291 71.5. 200 (68.7). 91 (31.3). Mild impairment. 100 24.6. 22 (22.0). 78 (78.0). Moderate impairment. 16. 4 (25.0). 12 (75.0). Psychological and Cognitive Assessment Depressive symptoms Positive. <0.001. Pffeifer Questionnaire. <0.001. 3.9. *Median (interquartile range). HBP, high blood pressure; COPD, chronic obstructive pulmonary disease. DM2, diabetes mellitus type 2; BMI, body mass index. Page 6 of 15.
(7) F1000Research 2019, 8:59 Last updated: 12 MAR 2019. Table 3. Poisson regression to determine factors associated with poor physical performance. Crude Model: PR Adjusted Model: P value P value (95%IC) PR (95%IC). Variables Female gender. 1.58 (1.21-2.07). 0.001. 1.29 (1.03-1.61). 0.028. Lack of social support. 2.27 (1.74-2.96). <0.001. 2.10 (1.17-3.76). 0.013. Alcohol consumption. 1.77 (1.45-2.17). <0.001. 0.95 (0.77-1.19). 0.673. Tobacco consumption. 1.69 (1.35-2.11). <0.001. 0.95 (0.74-1.22). 0.694. Number of drugs used. 1.22 (1.17-1.27). <0.001. 1.09 (1.01-1.17). 0.022. Comorbidities. 1.15 (1.02-1.29). 0.019. 0.95 (0.86-1.06). 0.364. Urinary incontinence. 2.08 (1.65-2.63). <0.001. 1.45 (1.16-1.82). 0.001. Falls in the last year. 3.04 (2.14-4.30). <0.001. 1.57 (0.87-2.83). 0.134. Hospitalizations in the last year. 1.36 (1.04-1.78). 0.023. 0.98 (0.74-1.29). 0.877. Dependence ADL. 1.55 (1.07-2.25). 0.022. 2.03 (0.94-4.39). 0.071. Exhaustion. 2.04 (1.54-2.69). <0.001. 1.35 (1.03-1.75). 0.027. Depressive symptoms. 1.62 (1.31-2.00). <0.001. 1.26 (0.98-1.62). 0.072. Cognitive impairment (Pffeifer Questionnaire score ≥3). 2.48 (2.04-3.02). <0.001. 1.89 (1.40-2.55). <0.001. Altitude (masl)2. 1.47 (1.11-1.95). 0.007. 0.86 (0.73-1.02). 0.089. 1. Activities of daily living, assessed with Barthel Index. Altitude for each 1000 masl.. 1. 2. SPPB score less than or equal to 7 were unable to complete the 400 meters walk test after the three years of follow-up, being a higher proportion than the found in our study. In addition, this SPPB score (≤7) was associated with an odds ratio (OR) of approximately 27 predicting inability to complete 400 meters walk test in those able to walk 400 meters at baseline48. Similarly, another study conducted in Italy found a lower SPPB mean score than the one calculated in our study population; nevertheless, this study was performed in hospitalized patients49. Additionally, a previous study carried out in Peru in the rural communities of Atipayán (3345 masl) and Santa (6 masl), showed a prevalence of poor physical performance of 10.0% and 19.4%, respectively, both lower figures to that found in this study15. We have found a higher SPPB mean score than that found in other studies, highlighting the fact of being a population living in altitude cities. Nevertheless, these findings can only be interpreted for the altitude ranges evaluated in the present study. We found an association between female gender and poor physical performance in the evaluated population. Equally, a cohort carried out in 3041 well-functioning white and black men and women, aged 70–79 years, found that men independently of the race had a better physical performance than women (evaluated by the knee extension strength, chair-rise, 6 meters walk time, 400 meters walk time and standing balance test)50. In contrast, Vasunilashorn et al.48 did not find differences between physical performance groups and gender. This association could be explained because women usually have less muscle mass than men, and menopause produce an acute decline in strength and. muscle mass, compared with the gradual loss of strength by men of similar age17,51. In this study, association between lack of social support and poor physical performance was found. A systematic review by Vagetti et al. during 2014 that aimed to assess the association between physical activity and quality of life in older adults found a moderate association between social support and physical activity in older adults52. Similarly, a study in Norway found a consistent correlation between physical activity in older adults and social support, especially regarding family social support rather than friend-related support53. This association would be explained by the close relationship between the deterioration of physical and mental health caused by the lack of social support in older adults, which would negatively affect the control of diseases and the physical performance of this population54. The presence of chronic diseases and comorbidities are common in the older people, and require pharmacological therapy in the majority of cases in order to manage them properly55. A study conducted in 1123 hospitalized older adults in Italy found that the prevalence of polypharmacy was higher in patients with poor physical performance and grip strength56. Also, the association between consumption of more than five drugs would be associated with the presence of frailty, disability and falls in older adults, which would significantly affect the physical performance of the elderly57,58. Due to the absence of an adequate health network in high-altitude areas able to properly provide drugs to older people59,60, the presence of polypharmacy would be significantly lower than that of the older. Page 7 of 15.
(8) F1000Research 2019, 8:59 Last updated: 12 MAR 2019. people in urban areas, limiting the consequences in their physical performance. We found an association between urinary incontinence and poor physical performance in the population that was evaluated. A study conducted in Taiwan by Chiu et al. found an association between poor physical performance and the presence of urinary incontinence in older adults61. Similarly, in a cohort study conducted in 328 older Latinos in the United States, the increase in SPPB score at one-year follow-up was associated with a lower incidence of urinary incontinence62. In this study, an association between exhaustion and poor physical performance was found. Exhaustion and poor physical performance evaluated by SPPB are useful tools in the evaluation of sarcopenia, frailty and disability63–66. Previous studies reinforce the association found in this study, describing very low SPPB scores in fragile older people compared to non-fragile older people (2.9 vs. 8.5, respectively)67. In our study population, a high prevalence of exhaustion was found, which could be due to the continuous physical effort that these inhabitants perform in their daily activities, which mainly involve agriculture and trading. We found no association between poor physical performance and disability. As well as SPPB, the functional reach test, both performance-based measure, was not associated with disability assessed by the Barthel Index in older adults of Peruvian high Andean communities34. In addition, we did not find an association between poor physical performance and altitude in the adjusted regression model. Both associations had statistical significance in the crude regression model; however, in the adjusted model, they lost it. A possible explanation for this could be the sample size, because, in the adjusted model, both associations presented a p-value with marginal significance68. Although p-value is a useful parameter to explain a result based on statistical significance, it is not the only one to be taken into account69. The relevance of our results allows our research team to hypothesize plausible explanations of the presented findings: 1) people with a high number of comorbidities cannot live at highest altitudes, so we do not find a comorbid population in our study; 2) living at that altitude range makes you physically stronger; 3) there is another variable or condition about the people living at high altitude that was missed in our study and that we did not adjust for in the regression models. In regard of these, the Andean older people work from a very young age in tasks that involve physical effort, so this could be an interesting point of the study. It is also important to indicate that in the crude model, altitude (for each 1000 masl) increased the probability of poor physical performance; however, after we adjusted the analysis including medical, functional and cognitive variables, the high altitude became a protective marker for poor physical function. These questions would serve as a basis for future studies. Moreover, an association between the presence of cognitive impairment and poor physical performance was found. The. protective effect of physical activity against the development of some type of dementia or neurocognitive disorder has been previously described in multiple studies70–72. In rural populations at sea level and in altitude, the prevalence of cognitive disorders is low; this could be attributed to different lifestyles, such as the constant physical activity they have performed throughout their lives15. This study has some limitations: 1) the sampling conducted was not probabilistic, the results cannot be extrapolated; nevertheless, this study was conducted in 11 communities at different altitudes, and the participants reported fewer comorbidities than persons in hospitals, drawing closer to the rural reality; 2) because of its cross-sectional design, this study does not allow us to evaluate causality between the poor physical performance and the associated factors; yet, we still could identify useful markers for future intervention studies; 3) we used selfreport to collect some variables in this study which can generate a recall bias. Nevertheless, this is not the case of our main variable which was performance-based measured73; 4) low educational level of the studied population would affect the accuracy of self-report to collect information on complex diseases42; hence, we corroborated the data of the most common comorbidities with a family member/caregiver of the respondent at the time of the interview; 5) because of their low educational level, it was not possible to assess the amount of alcohol of tobacco consumed by the participants; 6) some variables studied have missing values, though, they did not exceed 20%, allowing its analysis74. In conclusion, almost half of the population evaluated had poor physical performance based on the SPPB. Factors that would increase the possibility of suffering from poor physical performance were: female gender, lack of social support, number of drugs used, urinary incontinence, exhaustion and cognitive impairment. These markers would be very important to develop future cohort studies which would like to study more specifically some marker found in this study.. Data availability The raw data associated with this study are available on OSF. DOI: https://doi.org/10.17605/OSF.IO/RSC7Q46. Data are available under the terms of the Creative Commons Zero “No rights reserved” data waiver (CC0 1.0 Public domain dedication).. Grant information The author(s) declared that no grants were involved in supporting this work. Acknowledgements We acknowledge the staff of the Aging Investigation Center Faculty of Medicine at the Universidad de San Martín de Porres, Peru; and the staff of Geriatric Service of the Peruvian Naval Medical Center for the logistical support provided.. Page 8 of 15.
(9) F1000Research 2019, 8:59 Last updated: 12 MAR 2019. References 23.. Janssens JP, Pache JC, Nicod LP: Physiological changes in respiratory function associated with ageing. Eur Respir J. 1999; 13(1): 197–205. PubMed Abstract. Kalaiselvi S, Arjumand Y, Jayalakshmy R, et al.: Prevalence of under-nutrition, associated factors and perceived nutritional status among elderly in a rural area of Puducherry, South India. Arch Gerontol Geriatr. 2016; 65: 156–60. PubMed Abstract | Publisher Full Text. 24.. 3.. Weinstein JR, Anderson S: The aging kidney: physiological changes. Adv Chronic Kidney Dis. 2010; 17(4): 302–7. PubMed Abstract | Publisher Full Text | Free Full Text. Richalet JP, Lhuissier FJ: Aging, Tolerance to High Altitude, and Cardiorespiratory Response to Hypoxia. High Alt Med Biol. 2015; 16(2): 117–24. PubMed Abstract | Publisher Full Text. 25.. 4.. Pugh KG, Wei JY: Clinical implications of physiological changes in the aging heart. Drugs Aging. 2001; 18(4): 263–76. PubMed Abstract | Publisher Full Text. Murray AJ: Energy metabolism and the high-altitude environment. Exp Physiol. 2016; 101(1): 23–7. PubMed Abstract | Publisher Full Text. 26.. 5.. Lipsitz LA: Dynamics of stability: the physiologic basis of functional health and frailty. J Gerontol A Biol Sci Med Sci. 2002; 57(3): B115–B25. PubMed Abstract | Publisher Full Text. Hoppeler H, Mueller M, Vogt M: Skeletal muscle tissue changes with hypoxia. High Altitude. Springer; 2014; 191–202. Publisher Full Text. 27.. 6.. Rodway GW, Hoffman LA, Sanders MH: High-altitude-related disorders--Part II: prevention, special populations, and chronic medical conditions. Heart Lung. 2004; 33(1): 3–12. PubMed Abstract | Publisher Full Text. Gilbert-Kawai ET, Milledge JS, Grocott MP, et al.: King of the mountains: Tibetan and Sherpa physiological adaptations for life at high altitude. Physiology (Bethesda). 2014; 29(6): 388–402. PubMed Abstract | Publisher Full Text. 28.. Hoppeler H, Vogt M: Muscle tissue adaptations to hypoxia. J Exp Biol. 2001; 204(Pt 18): 3133–9. PubMed Abstract. 29.. Taylor AT: High-altitude illnesses: physiology, risk factors, prevention, and treatment. Rambam Maimonides Med J. 2011; 2(1): e0022. PubMed Abstract | Publisher Full Text | Free Full Text. 1.. Clegg A, Young J, Iliffe S, et al.: Frailty in elderly people. Lancet. 2013; 381(9868): 752–62. PubMed Abstract | Publisher Full Text | Free Full Text. 2.. 7.. León-Velarde F, Maggiorini M, Reeves JT, et al.: Consensus statement on chronic and subacute high altitude diseases. High Alt Med Biol. 2005; 6(2): 147–57. PubMed Abstract | Publisher Full Text. 8.. Penninx BW, Pahor M, Cesari M, et al.: Anemia is associated with disability and decreased physical performance and muscle strength in the elderly. J Am Geriatr Soc. 2004; 52(5): 719–24. PubMed Abstract | Publisher Full Text. 30.. Miranda JJ, Gilman RH, Smeeth L: Differences in cardiovascular risk factors in rural, urban and rural-to-urban migrants in Peru. Heart. 2011; 97(10): 787–96. PubMed Abstract | Publisher Full Text | Free Full Text. 31.. 9.. Janssen I: Influence of sarcopenia on the development of physical disability: the Cardiovascular Health Study. J Am Geriatr Soc. 2006; 54(1): 56–62. PubMed Abstract | Publisher Full Text. Sociales INdEeIDTdDeI: Perfil sociodemográfico del Perú: Censos Nacionales 2007: XI de población y VI de vivienda. INEI; 2008. Reference Source. 32.. 10.. Landi F, Onder G, Russo A, et al.: Calf circumference, frailty and physical performance among older adults living in the community. Clin Nutr. 2014; 33(3): 539–44. PubMed Abstract | Publisher Full Text. Herzog SK, Martínez R, Jørgensen PM, et al.: Climate change and biodiversity in the tropical Andes. Inter-American Institute for Global Change Research (IAI) and Scientific Committee on Problems of the Environment (SCOPE). 2011. Publisher Full Text. 33.. 11.. Rolland Y, Lauwers-Cances V, Cristini C, et al.: Difficulties with physical function associated with obesity, sarcopenia, and sarcopenic-obesity in communitydwelling elderly women: the EPIDOS (EPIDemiologie de l’OSteoporose) Study. Am J Clin Nutr. 2009; 89(6): 1895–900. PubMed Abstract | Publisher Full Text. Rolando JL, Turin C, Ramírez DA, et al.: Key ecosystem services and ecological intensification of agriculture in the tropical high-Andean Puna as affected by land-use and climate changes. Agric Ecosyst Environ. 2017; 236: 221–33. Publisher Full Text. 34.. Urrunaga-Pastor D, Moncada-Mapelli E, Runzer-Colmenares FM, et al.: Factors associated with poor balance ability in older adults of nine high-altitude communities. Arch Gerontol Geriatr. 2018; 77: 108–14. PubMed Abstract | Publisher Full Text. 35.. Collin C, Wade DT, Davies S, et al.: The Barthel ADL Index: a reliability study. Int Disabil Stud. 1988; 10(2): 61–3. PubMed Abstract | Publisher Full Text. 36.. Rolfson DB, Majumdar SR, Tsuyuki RT, et al.: Validity and reliability of the Edmonton Frail Scale. Age Ageing. 2006; 35(5): 526–9. PubMed Abstract | Publisher Full Text | Free Full Text. 37.. Fried LP, Tangen CM, Walston J, et al.: Frailty in older adults: evidence for a phenotype. J Gerontol A Biol Sci Med Sci. 2001; 56(3): M146–56. PubMed Abstract | Publisher Full Text. 38.. Yesavage JA, Sheikh JI: 9/Geriatric depression scale (GDS) recent evidence and development of a shorter version. Clin Gerontol. 1986; 5(1–2): 165–73. Publisher Full Text. 39.. Tramontano A, Veronese N, Giantin V, et al.: Nutritional status, physical performance and disability in the elderly of the Peruvian Andes. Aging Clin Exp Res. 2016; 28(6): 1195–201. PubMed Abstract | Publisher Full Text. Pfeiffer E: A short portable mental status questionnaire for the assessment of organic brain deficit in elderly patients. J Am Geriatr Soc. 1975; 23(10): 433–41. PubMed Abstract | Publisher Full Text. 40.. Tramontano A, Veronese N, Sergi G, et al.: Prevalence of sarcopenia and associated factors in the healthy older adults of the Peruvian Andes. Arch Gerontol Geriatr. 2017; 68: 49–54. PubMed Abstract | Publisher Full Text. Pavasini R, Guralnik J, Brown JC, et al.: Short Physical Performance Battery and all-cause mortality: systematic review and meta-analysis. BMC Med. 2016; 14(1): 215. PubMed Abstract | Publisher Full Text | Free Full Text. 41.. Sakamoto R, Okumiya K, Norboo T, et al.: Sleep quality among elderly highaltitude dwellers in Ladakh. Psychiatry Res. 2017; 249: 51–57. PubMed Abstract | Publisher Full Text. Viktil KK, Blix HS, Moger TA, et al.: Polypharmacy as commonly defined is an indicator of limited value in the assessment of drug-related problems. Br J Clin Pharmacol. 2007; 63(2): 187–95. PubMed Abstract | Publisher Full Text | Free Full Text. 42.. Okura Y, Urban LH, Mahoney DW, et al.: Agreement between self-report questionnaires and medical record data was substantial for diabetes, hypertension, myocardial infarction and stroke but not for heart failure. J Clin Epidemiol. 2004; 57(10): 1096–103. PubMed Abstract | Publisher Full Text. 43.. Flegal KM, Carroll MD, Ogden CL, et al.: Prevalence and trends in obesity among US adults, 1999-2000. JAMA. 2002; 288(14): 1723–7. PubMed Abstract | Publisher Full Text. 44.. Runzer-Colmenares FM, Samper-Ternent R, Al Snih S, et al.: Prevalence and factors associated with frailty among Peruvian older adults. Arch Gerontol Geriatr. 2014; 58(1): 69–73. PubMed Abstract | Publisher Full Text | Free Full Text. 45.. Nascimento PPP, Batistoni SST, Neri AL: Frailty and depressive symptoms in older adults: data from the FIBRA study-UNICAMP. Psicol Reflex Crit. 2016; 29(1): 16. Publisher Full Text. 12.. Guralnik JM, Simonsick EM, Ferrucci L, et al.: A short physical performance battery assessing lower extremity function: association with self-reported disability and prediction of mortality and nursing home admission. J Gerontol. 1994; 49(2): M85–M94. PubMed Abstract | Publisher Full Text. 13.. Guralnik JM, Ferrucci L, Simonsick EM, et al.: Lower-extremity function in persons over the age of 70 years as a predictor of subsequent disability. N Engl J Med. 1995; 332(9): 556–61. PubMed Abstract | Publisher Full Text. 14.. Wang L, Larson EB, Bowen JD, et al.: Performance-based physical function and future dementia in older people. Arch Intern Med. 2006; 166(10): 1115–20. PubMed Abstract | Publisher Full Text. 15.. Estela-Ayamamani D, Espinoza-Figueroa J, Columbus-Morales M, et al.: [Physical performance of older adults living in rural areas at sea level and at high altitude in Peru]. Rev Esp Geriatr Gerontol. 2015; 50(2): 56–61. PubMed Abstract | Publisher Full Text. 16.. 17.. 18.. 19.. Curcio CL, Henao GM, Gomez F: Frailty among rural elderly adults. BMC Geriatr. 2014; 14(1): 2. PubMed Abstract | Publisher Full Text | Free Full Text. 20.. Da Mata FA, Pereira PP, Andrade KR, et al.: Prevalence of Frailty in Latin America and the Caribbean: A Systematic Review and Meta-Analysis. PLoS One. 2016; 11(8): e0160019. PubMed Abstract | Publisher Full Text | Free Full Text. 21.. Díaz-Villegas G, Parodi J, Merino-Taboada A, et al.: Calf circumference and risk of falls among Peruvian older adults. Eur Geriatr Med. 2016; 7(6): 543–6. Publisher Full Text. 22.. Ethgen O, Beaudart C, Buckinx F, et al.: The Future Prevalence of Sarcopenia in Europe: A Claim for Public Health Action. Calcif Tissue Int. 2017; 100(3): 229–234. PubMed Abstract | Publisher Full Text | Free Full Text. Page 9 of 15.
(10) F1000Research 2019, 8:59 Last updated: 12 MAR 2019. para la salud: Perú 2007-2015. Minsa Lima; 2013. Reference Source. 46.. Pastor DU: Factors Associated to Poor Physical Performance in Older Adults of 11 Peruvian High Andean Communities. OSF. Web. 2019.. 47.. Verghese J, Holtzer R, Lipton RB, et al.: Mobility stress test approach to predicting frailty, disability, and mortality in high-functioning older adults. J Am Geriatr Soc. 2012; 60(10): 1901–5. PubMed Abstract | Publisher Full Text | Free Full Text. 61.. 48.. Vasunilashorn S, Coppin AK, Patel KV, et al.: Use of the Short Physical Performance Battery Score to predict loss of ability to walk 400 meters: analysis from the InCHIANTI study. J Gerontol A Biol Sci Med Sci. 2009; 64(2): 223–9. PubMed Abstract | Publisher Full Text | Free Full Text. Chiu AF, Huang MH, Hsu MH, et al.: Association of urinary incontinence with impaired functional status among older people living in a long-term care setting. Geriatr Gerontol Int. 2015; 15(3): 296–301. PubMed Abstract | Publisher Full Text. 62.. 49.. Volpato S, Cavalieri M, Sioulis F, et al.: Predictive value of the Short Physical Performance Battery following hospitalization in older patients. J Gerontol A Biol Sci Med Sci. 2011; 66(1): 89–96. PubMed Abstract | Publisher Full Text | Free Full Text. Morrisroe SN, Rodriguez LV, Wang PC, et al.: Correlates of 1-year incidence of urinary incontinence in older Latino adults enrolled in a community-based physical activity trial. J Am Geriatr Soc. 2014; 62(4): 740–6. PubMed Abstract | Publisher Full Text | Free Full Text. 63.. 50.. Taaffe DR, Simonsick EM, Visser M, et al.: Lower extremity physical performance and hip bone mineral density in elderly black and white men and women: cross-sectional associations in the Health ABC Study. J Gerontol A Biol Sci Med Sci. 2003; 58(10): M934–M42. PubMed Abstract | Publisher Full Text. Iolascon G, Di Pietro G, Gimigliano F, et al.: Physical exercise and sarcopenia in older people: position paper of the Italian Society of Orthopaedics and Medicine (OrtoMed). Clin Cases Miner Bone Metab. 2014; 11(3): 215–21. PubMed Abstract | Publisher Full Text | Free Full Text. 64.. Cooper C, Dere W, Evans W, et al.: Frailty and sarcopenia: definitions and outcome parameters. Osteoporos Int. 2012; 23(7): 1839–48. PubMed Abstract | Publisher Full Text. 65.. Brown M, Sinacore DR, Binder EF, et al.: Physical and performance measures for the identification of mild to moderate frailty. J Gerontol A Biol Sci Med Sci. 2000; 55(6): M350–M5. PubMed Abstract | Publisher Full Text. 66.. Vestergaard S, Nayfield SG, Patel KV, et al.: Fatigue in a representative population of older persons and its association with functional impairment, functional limitation, and disability. J Gerontol A Biol Sci Med Sci. 2009; 64(1): 76–82. PubMed Abstract | Publisher Full Text | Free Full Text. 67.. Buckinx F, Reginster JY, Petermans J, et al.: Relationship between frailty, physical performance and quality of life among nursing home residents: the SENIOR cohort. Aging Clin Exp Res. 2016; 28(6): 1149–57. PubMed Abstract | Publisher Full Text. 68.. Ai C, Norton EC: Interaction terms in logit and probit models. Econ Lett. 2003; 80(1): 123–9. Publisher Full Text. 69.. Greenland S, Senn SJ, Rothman KJ, et al.: Statistical tests, P values, confidence intervals, and power: a guide to misinterpretations. Eur J Epidemiol. 2016; 31(4): 337–50. PubMed Abstract | Publisher Full Text | Free Full Text. 70.. Laurin D, Verreault R, Lindsay J, et al.: Physical activity and risk of cognitive impairment and dementia in elderly persons. Arch Neurol. 2001; 58(3): 498–504. PubMed Abstract | Publisher Full Text. 51.. Hughes VA, Frontera WR, Roubenoff R, et al.: Longitudinal changes in body composition in older men and women: role of body weight change and physical activity. Am J Clin Nutr. 2002; 76(2): 473–81. PubMed Abstract | Publisher Full Text. 52.. Vagetti GC, Barbosa Filho VC, Moreira NB, et al.: Association between physical activity and quality of life in the elderly: a systematic review, 2000-2012. Braz J Psychiatry. 2014; 36(1): 76–88. PubMed Abstract | Publisher Full Text. 53.. Hansen BH, Ommundsen Y, Holme I, et al.: Correlates of objectively measured physical activity in adults and older people: a cross-sectional study of population-based sample of adults and older people living in Norway. Int J Public Health. 2014; 59(2): 221–30. PubMed Abstract | Publisher Full Text. 54.. Liu L, Gou Z, Zuo J: Social support mediates loneliness and depression in elderly people. J Health Psychol. 2016; 21(5): 750–8. PubMed Abstract | Publisher Full Text. 55.. Fries JF: Aging, natural death, and the compression of morbidity. 1980. Bull World Health Organ. 2002; 80(3): 245–50. PubMed Abstract | Free Full Text. 56.. Sganga F, Vetrano DL, Volpato S, et al.: Physical performance measures and polypharmacy among hospitalized older adults: results from the CRIME study. J Nutr Health Aging. 2014; 18(6): 616–21. PubMed Abstract | Publisher Full Text. 71.. 57.. Gnjidic D, Hilmer SN, Blyth FM, et al.: Polypharmacy cutoff and outcomes: five or more medicines were used to identify community-dwelling older men at risk of different adverse outcomes. J Clin Epidemiol. 2012; 65(9): 989–95. PubMed Abstract | Publisher Full Text. Heyn P, Abreu BC, Ottenbacher KJ: The effects of exercise training on elderly persons with cognitive impairment and dementia: a meta-analysis. Arch Phys Med Rehabil. 2004; 85(10): 1694–704. PubMed Abstract | Publisher Full Text. 72.. 58.. Delbaere K, Van den Noortgate N, Bourgois J, et al.: The Physical Performance Test as a predictor of frequent fallers: a prospective community-based cohort study. Clin Rehabil. 2006; 20(1): 83–90. PubMed Abstract | Publisher Full Text. Middleton LE, Barnes DE, Lui LY, et al.: Physical activity over the life course and its association with cognitive performance and impairment in old age. J Am Geriatr Soc. 2010; 58(7): 1322–6. PubMed Abstract | Publisher Full Text | Free Full Text. 73.. 59.. Liu X, Gao W, Yan H: Measuring and decomposing the inequality of maternal health services utilization in western rural China. BMC Health Serv Res. 2014; 14(1): 102. PubMed Abstract | Publisher Full Text | Free Full Text. Reuben DB, Siu AL, Kimpau S: The predictive validity of self-report and performance-based measures of function and health. J Gerontol. 1992; 47(4): M106–M10. PubMed Abstract | Publisher Full Text. 74.. 60.. Ministerio de Salud, Dirección General de Gestión del Desarrollo de Recursos Humanos: Segunda medición de las metas regionales de recursos humanos. Dong Y, Peng CY: Principled missing data methods for researchers. SpringerPlus. 2013; 2(1): 222. PubMed Abstract | Publisher Full Text | Free Full Text. Page 10 of 15.
(11) F1000Research 2019, 8:59 Last updated: 12 MAR 2019. Open Peer Review Current Referee Status: Version 1 Referee Report 12 March 2019. https://doi.org/10.5256/f1000research.19153.r44368 Mariella Guerra Memory Institute and Related Disorders (IMEDER), Lima, Peru Was an interview for the informant to confirm participant data/information? Did you find participants who only speak Quechua or a dialect? If so did you translate the questionnaires? Differences between urban and rural areas? Need to discuss Peruvian research. Discussion must be done around community findings. You found no association between poor physical performance and disability. Explanations beside statistical results. Is the work clearly and accurately presented and does it cite the current literature? Partly Is the study design appropriate and is the work technically sound? Yes Are sufficient details of methods and analysis provided to allow replication by others? Partly If applicable, is the statistical analysis and its interpretation appropriate? I cannot comment. A qualified statistician is required. Are all the source data underlying the results available to ensure full reproducibility? Partly Are the conclusions drawn adequately supported by the results? Partly Competing Interests: No competing interests were disclosed. Reviewer Expertise: Old age mental health I have read this submission. I believe that I have an appropriate level of expertise to confirm that it is of an acceptable scientific standard.. Page 11 of 15.
(12) F1000Research 2019, 8:59 Last updated: 12 MAR 2019. Referee Report 12 March 2019. https://doi.org/10.5256/f1000research.19153.r43044 Tania Tello Rodriguez Gerontology Institute, Cayetano Heredia University, Lima, Peru Introduction Older people from high Andean populations, in the majority of the cases, they do a lot of physical activity. However, the social context and the lack of health access services could be a negative factor for healthy ageing. It could be important to add something about physical activity in the introduction . A previous study of physical performance in older adults in rural areas in Peru found better physical performance in those who lived at height compared to those who lived at sea level, then probably height is not the cause to have a better or worse physical performance but other factors such as physical activity, multimorbidity, etc. Methods The best design for this kind of study is of case and control but the tranversal studies give us relevant information. The presence of osteoarthritis of knee and hip and low physical activity previous can impact in the physical performance in this study. In older people the BMI is not the best parameter to evaluate malnutrition and the recommended levels are different, as mentioned in this study. Describe the inclusion criteria and exclusion ones in detail, they are partially mentioned in the results. Results Related to the comorbility takes my attention the low percentage of arterial hypertension found in 10% and the high frequency of functional dependence is 83%. Very different amounts to that reported in previous studies. Discussion 83% has functional dependence by the Barthel index, so it is a study to the community that is surprising, one of the hypothesis it is the population has high rates of multimorbility but to collect information but self-report the information was not given. There are other variables or conditions about the people living at high altitude that was missed in this study and that were not adjusted for in the regression models. The population that has cognitive impairment in a mild-moderate way by the test of Pfeiffer (screening test) could have a low score in the physical performance due to they did not understand in an appropriate way the orders to use SPPB; thus, in the context from people with low educational levels. The fact that they do not find links between poor physical performance and to live at high altitude support a previous study done1. References 1. Estela-Ayamamani D, Espinoza-Figueroa J, Columbus-Morales M, Runzer-Colmenares F, Parodi JF, Mayta-Tristán P: [Physical performance of older adults living in rural areas at sea level and at high altitude in Peru].Rev Esp Geriatr Gerontol. 50 (2): 56-61 PubMed Abstract | Publisher Full Text Is the work clearly and accurately presented and does it cite the current literature? Yes Page 12 of 15.
(13) F1000Research 2019, 8:59 Last updated: 12 MAR 2019. Is the work clearly and accurately presented and does it cite the current literature? Yes Is the study design appropriate and is the work technically sound? Partly Are sufficient details of methods and analysis provided to allow replication by others? Yes If applicable, is the statistical analysis and its interpretation appropriate? Yes Are all the source data underlying the results available to ensure full reproducibility? Yes Are the conclusions drawn adequately supported by the results? Yes Competing Interests: No competing interests were disclosed. Reviewer Expertise: Frailty, ageing I have read this submission. I believe that I have an appropriate level of expertise to confirm that it is of an acceptable scientific standard. Referee Report 01 March 2019. https://doi.org/10.5256/f1000research.19153.r43042 Diego Andrés Chavarro-Carvajal Instituto de Envejecimiento, Facultad de Medicina, Pontificia Universidad Javeriana, Bogotá, Colombia Urrunaga-Pastor and co-authors evaluated the performance of the physical performance of the Short Physical Performance Battery (SPPB) in older adults living in 11 Peruvian high Andean communities. This work has a clear objective; the results are interesting and provide novel information in these regions of Peru with very particular characteristics given the geographical location and the height above sea level. I consider statistical analysis is proper to a cross sectional study using Poisson regression and was reported prevalence ratio with their confidence intervals. Is the work clearly and accurately presented and does it cite the current literature? Yes Is the study design appropriate and is the work technically sound? Yes Are sufficient details of methods and analysis provided to allow replication by others? Yes If applicable, is the statistical analysis and its interpretation appropriate? Yes Page 13 of 15.
(14) F1000Research 2019, 8:59 Last updated: 12 MAR 2019. If applicable, is the statistical analysis and its interpretation appropriate? Yes Are all the source data underlying the results available to ensure full reproducibility? Yes Are the conclusions drawn adequately supported by the results? Yes Competing Interests: No competing interests were disclosed. Reviewer Expertise: Geriatrics, nutrition, dementia, frailty, sarcopenia. I have read this submission. I believe that I have an appropriate level of expertise to confirm that it is of an acceptable scientific standard. Referee Report 21 February 2019. https://doi.org/10.5256/f1000research.19153.r43043 Oscar Rosas-Carrasco National Geriatrics Institute, National Institutes of Health, Mexico City, Mexico This work has a clear objective. The lack of studies in communities far from the big cities will always be a solid point to support the publication of these studies. The strength of the study is that it includes the possibility of studying the physical performance in populations with height above sea level greater than 2500 meters. I have some considerations to correct in the methodology: I understand that the authors preferred to use a Poisson regression due to the fact that the characteristics of the dependent variable (physical performance) were adequate (by distribution?) to prefer this analysis regression, however it should be specifically noted and included why they did not use logistic regression if the dependent variable presented only had two categories. On the other hand, include if medical doctors and medical students were compared with any statistical test to corroborate concordance. Do the authors have information about the migration of those with high comorbidity? The above could explain why a low frequency of chronic diseases and good performance were found. Include some result of the final Poisson regression model that allows to know if the fit of model regression were adequate to present the results obtained. In conclusion, the manuscript must be accepted with some corrections that the authors must consider, the results are interesting and provide novel information in these regions of Peru. Is the work clearly and accurately presented and does it cite the current literature? Yes Is the study design appropriate and is the work technically sound? Yes Are sufficient details of methods and analysis provided to allow replication by others? Partly. Page 14 of 15.
(15) F1000Research 2019, 8:59 Last updated: 12 MAR 2019. Partly If applicable, is the statistical analysis and its interpretation appropriate? Partly Are all the source data underlying the results available to ensure full reproducibility? Yes Are the conclusions drawn adequately supported by the results? Yes Competing Interests: No competing interests were disclosed. Reviewer Expertise: Geriatrics, Body composition, sarcopenia, frailty I have read this submission. I believe that I have an appropriate level of expertise to confirm that it is of an acceptable scientific standard, however I have significant reservations, as outlined above.. The benefits of publishing with F1000Research: Your article is published within days, with no editorial bias You can publish traditional articles, null/negative results, case reports, data notes and more The peer review process is transparent and collaborative Your article is indexed in PubMed after passing peer review Dedicated customer support at every stage For pre-submission enquiries, contact [email protected]. Page 15 of 15.
(16)
Figure

Documento similar
The objective of this study was to identify factors related to dysfunctional family functioning that may be associated with the severity of symptoms among adolescent patients with
Thus, the aim of the current study was to assess whether food insecurity is associated with MCI using data from a nationally representative sample of older adults in South
The main aim of the article is to study the combined effect of covalent bonding and physical encapsulation of sulfur in the pores of COFs in order to improve the cycling
In this prospective study of community-dwelling older adults, higher serum leptin concentration was associated with greater risk of impairment in mobility, agility, lower
In accordance with that discussed, the aim of the present work was to examine dietary habits, nutritional status, and physical activity engagement in older adults in the city of
Objective: The main purpose of our study was to describe the factors associated with more severe pain levels in a cohort of patients with plantar fasciitis (PF).. The secondary
Prospective association between average alcohol consumption and Center for Epidemiologic Studies Depression Scale (CES-D) and the General Health Questionnaire-12 (GHQ-12) scores
The main findings of this study were as follows: (i) to provide new equations with good predictive value for eCRF (74%-87%), specifically developed for older adults and
