European Journal of Government and Economics
ISSN: 2254-7088
The impact of port governance and infrastructures on maritime
containerized trade on the West Coast of Latin America
Beatriz Lopez-Bermudeza, *, María Jesús Freire-Seoanea, Ignacio de la Peña Zarzueloa a
Universidade da Coruña, Elviña, 15071 A Coruña, Spain
* Corresponding author at: Universidade da Coruña, Elviña, 15071 A Coruña, Spain. email: [email protected]
Article history. Received 27 February 2018; first revision required 7 May 2018; accepted 23 May 2018.
Abstract. Latin American countries have historically had a strong dependence on trade, and are mostly characterized by being exporters of raw materials and importers of manufactured products. This fact has brought about a less
negative impact of the world crisis on economic growth, mainly because of the high prices of raw materials. This paper
focuses on this geographical area (the West Coast of Latin America) between 2008 and 2015, and adds to the literature
by assessing institutional, port-related and economic factors that influence maritime transport. The analysis makes use
of panel data models with fixed and random effects where the Hausman test has been applied in order to define a solid
specification of all the ports, as well as to discount the particular peculiarities of each country. It is shown that the
analysis of maritime transport requires the analysis of a number of variables apart from trade (volume of TEUs),
infrastructures, superstructures (number of calls, gantry cranes), and that other variables, such as port governance,
which are sometimes difficult to quantify, need also to be taken into account.
Keywords. Port Governance; Maritime Trade; Latin America; Panel Data. JEL classification. C33; N76; R42
1. Introduction
Latin America represents 8% of the world's Gross Domestic Product. From 2008 to 2016, the yearly growth rate of its GDP has been 2.08%, and its population represents 8.5% of the world’s total (World Bank, 2017). The world crisis of this century has produced a recession in all develop economies, severely affecting the economies of the United States and the European Union, and causing a fall of world growth and trade. However, the Latin American countries have managed to avoid major consequences from the global crises, and they have experienced some economic growth. This is mainly explained by the intense trade of raw materials with Asian countries, especially China (ECLAC, 2014).
According to UNCTAD (2017), 80% of international trade is carried out by sea. In addition, the importance of seaports for Latin America's growth is rooted in the region's colonial history and its natural endowment (Serebrisky et al., 2016). Latin America’s economy has long
86
depended on international seaborne trade (agricultural products and extractive industry) and imports of consumer goods, purchased with the capital accrued from those commodities (Serebrisky et al., 2016; ECLAC, 2014). The continued growth of maritime trade across Latin America and the increase in vessel sizes have both contributed to the expansion of container handling facilities, and enabled new institutional reforms to accommodate the increasing demand. The objective of this paper is to identify the institutional factors and the main port characteristics that favor the movement of containerized goods in the ports on the West Coast of Latin America located in Chile (Antofagasta, Arica, Coronel, Iquique, Lirquén, Mejillones, San Antonio, San Vicente and Valparaíso), Colombia (Buenaventura), Costa Rica (Caldera), Ecuador (Esmeraldas y Guayaquil), El Salvador (Acajutla), Guatemala (P. Quetzal), Mexico (Ensenada, Lázaro Cárdenas and Manzanillo), Nicaragua (Corinto), Panama (Balboa) and Peru (Callao, Matarani and Paita).
This paper is structured in six sections: an introduction; the second section, a bibliographic review; the third, a description of the variables that are going to be used and the modelling; the fourth, the results of the model; and, finally, the conclusions and the bibliography.
2. Background
Studies of international economics, especially on economic growth, underline the relationship between growth and trade (Romer 1990; Rivera-Batiz and Romer 1991). The related empirical literature is quite recent, and in particular, studies that relate maritime transport and economic growth are relatively scarce (Grossmann et al., 2007). Radelet and Sachs (1998), Redding (2002), and the series "Review of Maritime Transport" of UNCTAD as of 2007 (UNCTAD, 2017) have begun to address these issues.
Containerized maritime transport of goods, which enjoy the benefits of the economies of scale and, therefore, reduced costs incurred in the transportation of large volumes of goods, constitutes a good reference for assessing the impact of maritime traffic on the economic growth and development of any country (Bernhofen et al., 2016; Rodrigue et al., 2013). In addition, it should be considered that containerized cargo comes mainly from the secondary and tertiary sector activity (Guisan, 2013; Kenessey, 1987). Indeed, Corbett and Winebrake (2008) find a very strong association, around 90%, between the US Gross Domestic Product and the volume of containerized goods.
87
not been taken advantage of properly in terms of reducing inequality and increasing the quality and efficiency of infrastructures (Bitar, 2016).
Research efforts on different port governance systems resulted from the "port devolution" process that began around the year 1945 in the United Kingdom (Baird, 1995, 1999, 2000; Goss, 1998; Baird and Valentine, 2006; Pettit, 2008). Baird (1995, 1999, 2000), which formulated the "port function privatization matrix", wherein he made a classification based on the public and private nature of what he considered to be the most important factors. Later, Baltazar and Brooks (2001), taking Baird as a reference, presented the "port devolution matrix", where three port functions are specified (regulator, owner and operator), classified into public, private or mixed. In 2007, the World Bank published the "Port Reform Toolkit", which proposes one of the simplest and clearest classifications of port reforms, and permits to identify the public or private nature of the institutions involved carrying out a series of port functions. Under these hypotheses, the results are four models of port governance: public service port, toolport, landlord port and private service port. In each of them, the following functions are to be analyzed: port administration, nautical administration, infrastructure (nautical or port), superstructure (equipments and buildings), cargo handling, and other port facilities such as pilotage, dredging, tugboats, mooring, etc. In this research, they also record the balance between private risk and the importance of the mandatory regulations that exist in each port model according to its private or public dimension.
The public service port model refers to those ports whose ownership, planning, management and operation are entirely in the hands of the public sector. That is, besides providing all port services, the state also owns the land, infrastructure and superstructure. It is a model in declining use (World Bank, 2007), which worked in Latin American countries before what we could call the port "modernization"; that is, prior to the enactment of the port laws during the last two decades, which usually coincide in this case with obsolete labour regimes and lacking new technologies (Hoffman, 1999).
In the toolport model, although the public sector is the owner of the infrastructure and in charge of the operations and management of the port, they grant, however, some operational services, such as stowage, pilotage, supply, storage, etc. to legal business units with some percentage of representation either by the state or purely private. Some Latin American countries have used this intermediate modality to exercise port governance during periods of transition between the promulgation of port modernization laws, which in certain cases can, together with the starting of the new management, take up to ten years.
88
The private service port model involves the privatization of all elements, including ownership of the land, with the public sector only retaining a standard regulatory supervision power. The first case of application of this model took place in 1981 with the privatization of all British ports, under the control of the Associated British Ports Holding (Pettit, 2008). At present, we can mention other countries with governance tensions tending to favour the total privatization of this service, such as Argentina, Chile, Colombia, Malaysia, Mexico, New Zealand, the Philippines and Venezuela (Pettit, 2008). Another manifestation of this model is called terminalization, or the assumption of terminal operators once established the granting of the functions of the Port Authority, which is relegated to the role of mere spectator (Verhoeven, 2010; Slack, 2007).
Rodrigue et al. (2013) point out that the concept of port governance is transcendental when analysing a port; in fact, he remarks it as the third essential pillar to define the function of a port. The concept of port governance arises out of the need of the ports to present a clear organizational structure and efficient management in the transport service. This definition is currently used by most researchers.
Sánchez et al. (2015) present the challenges and opportunities that the seaborne transport and port development represent for Latin America and the Caribbean, introducing the theme of sustainability as a transversal axis in the improvement of infrastructures. In addition to the improvements in infrastructures it is important to highlight the importance of other factors such as the characteristics of the port terminal or the governance system, factors that many authors have investigated in relation with the concept of efficiency (Serebrisky et al., 2016; Chang and Tovar, 2014; Núñez-Sánchez and Coto-Millán, 2012; Ramos-Real and Tovar, 2010; Coto Millán et al., 2000; Roll and Hayuth, 1993).
3. Methodology
To analyze the relationship between TEUs, GDP and port variables, a regression panel data model has been used with the aim of achieving consistent and efficient estimators of the partial
effects of the observable independent variables on the dependent one, expressed as β = ∂E[yit |
xit]/∂xit (Greene, 2001). Estimates are made in the statistical program Stata 13.
In addition, the structure of the data facilitates the use of this methodology, since the time variable is smaller than cross-sectional observations (N <T). The choice of the eight-year period (2008-2015) was based on the progress of maritime transport both in terms of development of infrastructures and increase in the frequencies of commercial routes in the geographical area subject to this analysis (AIS, 2017).
3.1. Data
89
America; World Bank (WB, 2017), growth indicator; AIS (2017), number of ships that have made calls at the port; (several sources1) dummy of governance and the existence of container cranes, for the period analyzed.
TEUs: container movements are expressed in TEUs (WB, 2016) of ports on the Pacific coast of Latin American countries. In 2008, the ports with the largest number of container movements were Balboa (2,167,977 TEUs), Manzanillo (1,409,782 TEUs) and Callao (1,203,315 TEUs). In 2015, the ports with the largest movement of containers are the same, but they have experienced significant increases: Balboa with an interannual increase of 6.49% (3,294,113 TEUs), Manzanillo with 9.30% (2,458,135 TEUs) and Callao with 7.24% (1,900,444) TEUs).
GDP: Gross Domestic Product in constant dollars of 2011 in Power of Purchasing Parity (hereinafter, PPP) for the countries analyzed. In 2008, the countries with the highest GDP were Mexico (1,050 ·109 $), Colombia (272·109 $) and Chile (208·109 $). In 2015, the countries with the highest GDP are again Mexico with an interannual growth of 1.90% (1,210·109 $), Colombia with a growth of 2.83% (359·109 $) and Chile with 3.31% (263·109 $).
Dg1: dummy variable that takes value 1 when ports are fitted with gantry cranes and 0 when not. In 2008, the ports equipped with this type of cranes for the container loading/unloading operations were Balboa, Buenaventura, Callao, Ensenada, Guayaquil, Lazaro Cardenas, Manzanillo, San Antonio and Valparaíso. In 2015, the ports of Coronel and Paita will be linked to the previous list.
NB: number of annual vessels calling at the ports analyzed. In 2008, the ports with the highest figures were Balboa (729), Manzanillo (652) and Guayaquil (439). In 2015, the ports with the highest number of calls are the same, with Balboa showing an increment of 2.49% (874), Manzanillo continues to be second with an interannual rate of -0.19% (642) and Callao takes a third position with an interannual increase of 3.43% (455).
Governance: dummy variable that takes value 1 when the governance system has a landlord structure and 0 otherwise. In 2008, 18 of the 23 ports analyzed had a landlord structure, whereas Acajutla, Callao, Corinto, Esmeraldas and Puerto Quetzal had a toolport or service port governance system. In 2015, there will be 20 ports with Callao and Puerto Quetzal, while Acajutla, Corinto and Esmeraldas will continue with a toolport or service port system.
3.2. Model
The models with panel data demand the premise that the transverse variables (N) must be higher than the temporary variables (T), because otherwise we would not be in a case of multidimensional time series (cross-sectional time-series), that is, N> T (in this analysis, 23> 8). The main advantage of the panel data if compared with other analysis is that they allow the estimation of multiple regression coefficients, which could not be carried out either with cross-sectional data or with time series data (Arellano, 1992).
1
90
In the models with panel data, the observations repeat themselves over time for a sample of individual units (Arellano, 1992). Therefore, it can be stated that these models combine both temporal and transversal dimensions; that is, we happen to find variables with a temporary nature which evolve over time and other transversal variables as the different port terminals.
Panel data models can be classified into two large groups: static and dynamic. In this paper a static panel is used. The first researchers to estimate a model with static panel data were Pitt and Lee (1981), who used the maximum likelihood technique. Later on, Schmidt and Sickles (1984) compiled the different possibilities offered by the panel data: fixed effects, random effects and maximum-likelihood. This last method of statistical estimation requires T → ∞, and for this reason it will not be used in this investigation.
The basic specification of a model with panel data can be expressed as follows (Greene, 2005):
Yit = x’itβ + z’iα + Ɛit =x’itβ+ci+ Ɛit,
where
• Yit is the dependent variable or explained
• x'it is a vector of independent or exogenous variables (K ∙ 1)
• z'iα are the individual effects, where zi contains a constant term and a series of individual or group variables, which may be observable or not observable
• β is the slope vector of the equation;
• t refers to the time series that reaches the period T (t = 1,2, .., T);
• i refers to the ports, the last port being N (i = 1,2, .., N);
• Ɛit is the random term.
As it has been defined, it is a classic regression model. If zi is observable for all individuals, the model can be treated as an ordinary linear model, and an adjustment by ordinary least squares could be made. The problem arises when zi is not observable, as happens in most cases.
The main objective of this analysis is to achieve consistent and efficient estimators of the partial effects of the independent variables on the dependent variables, expressed as (Greene, 2005):
β = ∂E [yit | xit] / ∂xit
The fixed-effects approach takes αi as a specific constant term for each transversal unit and
implies that the differences between transversal units can be captured with differences in the constant term (Greene, 2005).
91
• i: represents each of the ports considered in the model;
• LTEUsi t
: natural logarithm of the volume of containers operated in port i during year t (WB, 2017);
• LGDPi t
: natural logarithm of the GDP of every country considered in the study in year t, expressed in PPP (constant dollars 2011), (WB, 2017);
• LNBi t
: natural logarithm of the number of ships that have called in every port considered (AIS, 2017);
• Governancei t
: dummy representing the governance system, 1 for the landlord model and 0 for the rest;
• Dg1i t
: dummy that represents the presence of gantry cranes, with the values 1 or 0 depending on whether or not those terminals are equipped with cranes of this type;
• uit: error term.
4. Estimation results
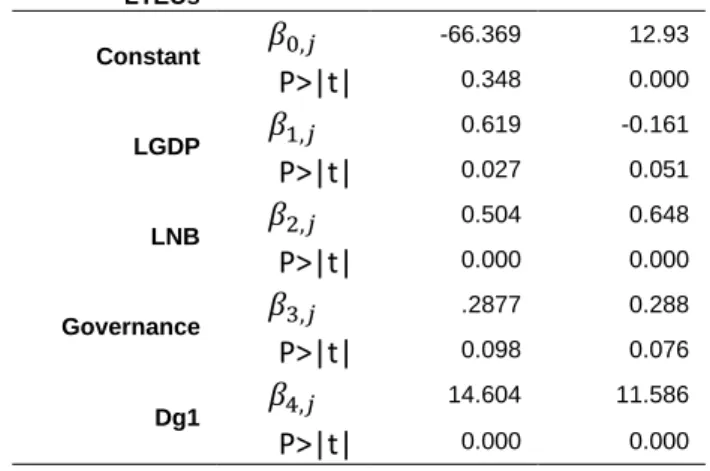
Table 1 presents the results for the models with panel data fixed and random effects, additionally calculating the Hausman test, which is the statistical instrument that indicates the preference for the fixed-effect model (Hausman, 1978; Hausman and Taylor, 1981). This allows to define a solid specification of the set of analysed ports, independently of the peculiarities of each port and country.
In the first place and according to the resolution conditions, the two basic tests H0:{ β k=0}
(statistic F for fixed effects and Wald Chi2 for random effects) reject the null hypothesis of coefficients equal to zero. On interpreting the results obtained, the Hausman test (Lee et al., 1998; Arellano and Bover, 1995) is rejected, so the regression of fixed effects is used for this purpose.
There is an evident existence of unknown intrinsic characteristics acting on the relationship (rho = .9246). The covariance between the error term and the variables of the model has a value (COV(vj,xi,j)=-.6429). Despite the relatively high value obtained, it could be said that the
influence of the idiosyncratic factors of each port is under control.
Increase GDP over TEUs
The economic growth of a country expressed in GDP as constant dollar 2011 PPP, should we keep constant the number of calls made by ships, the port governance system and the commercial policy, increases the volume of TEUs by e(0.6193)-1= 0.8576.
92
important works of improvement or expansion in their port infrastructures (Notteboom and Winkelmans, 2001). These investments are usually focused on civil engineering objectives: installation of new gantry cranes, extension of berthing lines, construction of new docks, deepening of the draft by dredging, automation of the terminal, increase in the storage surface, installation of multimodal exchange devices, etc. (Tsinker, 2014; Tang et al., 2011).
Increase in the number of vessel calls over TEUs
The first port variable to take into account in the model is the number of ships' calls in the port during the year, so that an increment of one unit produced an increase of e (0.5048)-1= 0.6566, in the TEUs. The number of calls derived from the increase in the volume of the container ship fleet (UNCTAD, 2017) does not strongly affect the volume of operated TEUs. However, there is a strong relationship in the geographical area under analysis, which indicates that these increases in capacity have not occurred in most of the ports.
Gantry cranes in port terminals
The second port variable being analyzed is the existence of gantry cranes in the port to carry out the stowage operations. With the available data it is worth mentioning that, with the exception of Balboa, Buenaventura, Callao and Lazaro Cardenas (in some years of the analyzed period), no other port has more than 10 gantry cranes. Moreover, many of them are just equipped with only one unit. The results of the model show that the existence of a gantry crane in the ports results in an increase in the volume of operated containers of e(1.4604) -1=330.76%.
The effect of the governance system over TEUs
The dummy variable represented by the landlord port governance system is significant in the analysis, what indicates its relevancy in relation to the volume of containers moved in the ports. Besides, the implementation of this system in a port gives rise to an increment in the volume of containerized goods of e(0.2877)-1=33.33% TEUs.
93
addition, the different entities of the port system (owner, operator, regulator and community manager) are assigned actions and lines that should be carried out to respond to the needs of port industry. This responds to the structure that the port system must present in order to solve the problems that arise between the different actors of the port logistics chain.
Researchers have pointed out different entities such as the community manager of Verhoeven (2010), the cluster manager of De Langen and Pallis (2007) that are circumscribed in an environment of path dependence (Notteboom et al., 2013) and coopetition (Lee and Song, 2010) that seek to modernize and update existing governance systems.
Table 1. Fixed Effects and Random Effects Model. Dependent variable: LTEUs
LTEUs
Fixed Effects
Random Effects Constant
𝛽𝛽
0,𝑗𝑗 -66.369 12.93P>|t|
0.348 0.000LGDP
𝛽𝛽
1,𝑗𝑗 0.619 -0.161P>|t|
0.027 0.051LNB
𝛽𝛽
2,𝑗𝑗 0.504 0.648P>|t|
0.000 0.000Governance
𝛽𝛽
3,𝑗𝑗 .2877 0.288P>|t|
0.098 0.076Dg1
𝛽𝛽
4,𝑗𝑗14.604 11.586
P>|t|
0.000 0.000N 184 184
F 72.20
P>F 0.000
Wald Chi2 298.64
P>Chi2 0.000
COV(vj,xi,j) -0.6429 0(def)
Rho .9246 .5587
R2
Within .5181 .4779
Between .5028 .8414
Overall .4921 .7990
Hausman test Chi2 26.58
P>Chi2 0.000
Conclusions
94
structure of data panel, be made for the sample of ports, which means that the analysis provides consistent estimators despite the idiosyncratic differences existing between ports.
The relationship between the variation of the Gross Domestic Product of each country and the trade measured in terms of maritime containerized transport is present in this analysis, since GDP produces an effect on the TEUs of e(0.6193)-1= 0.8576.
Moreover, the two characteristics related to port infrastructure and superstructure are the number of ships’ calls and the existence of gantry cranes. First of all, the number of calls made at the port can be inferred as a measure of the berth line, and this is a real fact, since taking advantage of economies of scale we can see that the present increase in the capacity of the vessels calls for longer lines of berthing and thus less port calls. The model shows that the increase in the number of calls causes an effect on the TEUs of e(0.5048)-1= 0.6566. In the same way, the existence of gantry cranes is important, especially for the region to which we are referring and with recent investments in infrastructure and port superstructure. Besides, most of the analysed ports have less than 10 container cranes for their stowage/unstowage operations, and consequently, just the existence of at least one gantry crane means an increase in the volume of TEUs moved in port of e(1.4604)-1= 3.3076.
In addition, the transport sector is a highly regulated worldwide sector, not only for its importance and impact on countries’ economies, but also for the fact that in most countries the port infrastructure is state property, and therefore its correct operation depends on government’s behaviour. Huge private capital investments are made based on exploitation concession contracts on account of the so-called regulation landlord, giving rise to an effect on the TEUs of e(0.2877)-1= 0.33333 in those countries under analysis.
It is necessary to establish a legislative framework that provides the public institutions necessary for the proper functioning of the port industry and that includes all the stakeholders of the multimodal transport logistics chain. This means that it is imperative to generate a correct association between public-private entities in the global supply chain.
Finally, and based on the results obtained, it can be verified that the analysis of (the) maritime transport requires considering other aspects on the West Coast of Latin America, not only trade (volume of TEUs), but also the infrastructures and superstructures of ports (number of calls, gantry cranes), as well as other variables which are sometimes difficult to quantify, such as (the) port governance.
95
ReferencesAIS (2017). IHS Markit: Maritime Portal. Acceso a través de: http://maritime.ihs.com/
Angamos (2017). Web del Puerto Angamos. Chile. Retrieved from: http://www.puertoangamos.cl/
AP Esmeraldas (2017). Web Autoridad Portuaria Esmeraldas. Ecuador. Retrieved from: http://www.puertoesmeraldas.gob.ec/
AP Guayaquil (2017). Web de la Autoridad Portuaria de Guayaquil. Ecuador. Retrieved from: http://www.apg.gob.ec/
APM Terminals (2017). Web del Consorcio APM Terminals Callao. Perú Retrieved from: https://www.apmterminalscallao.com.pe/
Arellano, M. (1992). Introducción al análisis econométrico con datos de panel (p. 9222). Banco de España: Servicio de Estudios.
Arellano, M., & Bover, O. (1995). Another look at the instrumental variable estimation of error-components models. Journal of Econometrics, 68(1). https://doi.org/10.1016/0304-4076(94)01642-D
Baird, A. (1995). UK port privatisation: in context. In Proceedings of UK Port Privatisation Conference. Scottish Transport Studies Group, 21.
Baird, A. (1999). Analysis of private seaport development: the port of Felixstowe. Transport Policy, 6(2), 109-122. https://doi.org/10.1016/S0967-070X(99)00012-8
Baird, A. J. (2000). Port privatisation: objectives, extent, process, and the UK experience. International Journal of Maritime Economics, 2(3), 177-194.
https://doi.org/10.1057/ijme.2000.16
Baird, A. J., & Valentine, V. F. (2006). Port privatisation in the United Kingdom. Research in Transportation Economics, 17, 55-84. https://doi.org/10.1016/S0739-8859(06)17003-1
Baltazar, R., & Brooks, M. R. (2001). The governance of port devolution: A tale of two countries. Canadian Public Administration, 42(1), 108-132.
Bernhofen, D.M., El-Sahli, Z. & Kneller, R. (2016). Estimating the effects of the container revolution on world trade. Journal of International Economics, 98, 36-50.
https://doi.org/10.1016/j.jinteco.2015.09.001
Bitar, S. (2016). Las tendencias mundiales y el futuro de América Latina. ECLAC.
CEPA (2017). Web Comisión Ejecutiva Portuaria Autónoma, El Salvador. Retrieved from : http://bit.ly/2c3JoVo
Chang, V., & Tovar, B. (2014). Efficiency and productivity changes for Peruvian and Chilean ports terminals: A parametric distance functions approach. Transport Policy, 31, 83-94.
https://doi.org/10.1016/j.tranpol.2013.11.007
Corbett, J.J. & Winebrake, J. (2008). The impacts of globalisation on international maritime transport activity. Globalisation, Transport and the Environment. OECD.
Coronel (2017). Web del Puerto Coronel. Chile. Retrieved from : http://www.puertodecoronel.cl/ Coto-Millan, P., Banos-Pino, J., & Rodriguez-Alvarez, A. (2000). Economic efficiency in Spanish
96
https://doi.org/10.1080/030888300286581
De Langen, P. W., & Pallis, A. A. (2007). Entry barriers in seaports. Maritime Policy and Management, 34(5), 427-440.
DP World Callao (2017). Web de DP World Callao. Perú. Retrieved from : http://www.dpworldcallao.com.pe
ECLAC (2014). Statistical Yearbook for Latin America and the Caribbean. Santiago de Chile: United Nations Publications.
ECLAC (2017). Perfil Marítimo y Logístico. Retrieved from : http://bit.ly/2fV5bzS
EP Arica (2017). Web de la Empresa Portuaria Arica. Chile. Retrieved from : http://www.puertoarica.cl/Web/index.php
EPA (2017). Web de la Empresa Portuaria Antofagasta. Retrieved from : http://www.anfport.cl/ EPI (2017). Web de la Empresa Portuaria Iquique. Chile. Retrieved from : http://www.epi.cl/ EPQ (2017). Web Empresa Portuaria Quetzal. Retrieved from : http://bit.ly/1P1GoGw
EPSA (2017). Web de la Empresa Portuaria San Antonio. Chile. Retrieved from : http://www.sanantonioport.cc.cl
EPSV (2017). Web de la Empresa Portuaria San Vicente –Talcahuano. Chile. Retrieved from : http://www.puertotalcahuano.cl/
EPV (2017). Web de la Empresa Portuaria Valparaíso. Chile. Retrieved from : http://www.puertovalparaiso.cl
Fawcett, J. (2006), Port governance and privatization in the United States: public ownership and private operation. Research in Transportation Economics, 17, 207-235.
https://doi.org/10.1016/S0739-8859(06)17010-9
Fay, M. & Morrison, M. (2006). Infrastructure in Latin America and the Caribbean: recent developments and key challenges. Washington: World Bank. https://doi.org/10.1596/978-0-8213-6676-9
Goss, G. S. (1998). U.S. Patent No. 5,828,653. Washington, DC: U.S. Patent and Trademark Office.
Greene, W. (2001). Estimating econometric models with fixed effects. Department of Economics, Stern School of Business, New York University.
Grossmann, H., Otto, A., Stiller, S. & Wedemeier, J. (2007). Growth potential for maritime trade and ports in Europe. Intereconomics, 42(4). https://doi.org/10.1007/s10272-007-0223-x
Guisan, M. C. (2013). Macro-econometric models of supply and demand: industry, trade and wages in 6 countries, 1960-2012. Applied Econometrics and International Development, 13(2), 45-56.
Hausman, J. A. (1978). Specification tests in econometrics. Econometrica: Journal of the Econometric Society, 1251-1271. https://doi.org/10.2307/1913827
Hausman, J. A., & Taylor, W. E. (1981). Panel data and unobservable individual effects. Econometrica: Journal of the Econometric Society, 1377-1398.
https://doi.org/10.2307/1911406
97
y Resultados, In Transport Unit, ECLAC. Trabajo presentado en el Seminar of World Bank 1999.
Kenessey, Z. (1987). The primary, secondary, tertiary and quaternary sectors of the economy. Review of Income and Wealth, 33(4). https://doi.org/10.1111/j.1475-4991.1987.tb00680.x
Lee, E. S., & Song, D. W. (2010). Knowledge management for maritime logistics value: discussing conceptual issues. Maritime Policy & Management, 37(6), 563-583.
https://doi.org/10.1080/03088839.2010.514959
Lee, M., Longmire, R., Matyas, L. & Harris, M. (1998). Growth convergence: some panel data evidence. Applied Economics, vol. 30, nº 7. https://doi.org/10.1080/000368498325336
Lirquen (2017). Web del Puerto Lirquén. Chile. Retrieved from : http://www.puertolirquen.cl/ Notteboom, T. E. & Winkelmans, W. (2001). Structural changes in logistics: how will port
authorities face the challenge? Maritime Policy & Management, 28(1).
https://doi.org/10.1080/03088830119197
Notteboom, T., De Langen, P., & Jacobs, W. (2013). Institutional plasticity and path dependence in seaports: interactions between institutions, port governance reforms and port authority routines. Journal of Transport Geography, 27, 26-35.
https://doi.org/10.1016/j.jtrangeo.2012.05.002
Núñez-Sánchez, R., & Coto-Millán, P. (2012). The impact of public reforms on the productivity of Spanish ports: A parametric distance function approach. Transport Policy, 24, 99-108.
https://doi.org/10.1016/j.tranpol.2012.07.011
PCorinto (2017). Web Puerto de Corinto. Retrieved from : http://bit.ly/2kh2JFf
Petit, M. G. (1988). U.S. Patent No. 4,760,837. Washington, DC: U.S. Patent and Trademark Office.
Pettit, S. J. (2008) United Kingdom ports policy: changing government attitudes, Marine Policy, 32(4), 719-727. https://doi.org/10.1016/j.marpol.2007.12.002
Pitt, M. M., & Lee, L. F. (1981). The measurement and sources of technical inefficiency in the Indonesian weaving industry. Journal of Development Economics, 9(1), 43-64.
https://doi.org/10.1016/0304-3878(81)90004-3
PLP (2017). Web Portal de Logística de Panamá. Retrieved from : http://bit.ly/2jxrOLU
Radelet, S. & Sachs, J. D. (1998). Shipping costs, manufactured exports, and economic growth. American Economic Association Meetings, Harvard University, mimeo.
Ramos-Real, F. J., & Tovar, B. (2010). Productivity change and economies of scale in container port terminals a cost function approach. Journal of Transport Economics and Policy (JTEP), 44(2), 231-246.
Redding, S. (2002). Specialization dynamics. Journal of International Economics, vol. 58, nº 2. Rotterdam, Elsevier. https://doi.org/10.1016/S0022-1996(01)00169-6
Rivera-Batiz, L.A. & Romer, P. M. (1991). Economic integration and endogenous growth. The Quarterly Journal of Economics, 106(2), 531-555. https://doi.org/10.2307/2937946
98
Roll, Y., & Hayuth, Y. E. H. U. D. A. (1993). Port performance comparison applying data envelopment analysis (DEA). Maritime Policy and Management, 20(2), 153-161.
https://doi.org/10.1080/03088839300000025
Romer, P. M. (1990). Endogenous technological change. Journal of Political Economy, 98(5-2), 71-102. https://doi.org/10.1086/261725
Sánchez, R. (2004). Puertos y transporte marítimo en América Latina y el Caribe: un análisis de su desempeño reciente. ECLAC.
Sánchez, R., Jaimurzina, A., Wilmsmeier, G., Pérez-Salas, G., Doerr, O. & Pinto, F. (2015). Transporte maritimo y puertos: desafíos y oportunidades en busca de un desarrollo sostenible en América Latina y el Caribe. ECLAC.
Schmidt, P., & Sickles, R. C. (1984). Production frontiers and panel data. Journal of Business & Economic Statistics, 2(4), 367-374.
SCT (2017) Web Secretaría de Transporte, Gobierno Mexico. Accedido a través de: http://bit.ly/1LiGiXB
Serebrisky, T., Sarriera, J. M., Suárez-Alemán, A., Araya, G., Briceño-Garmendía, C., & Schwartz, J. (2016). Exploring the drivers of port efficiency in Latin America and the Caribbean. Transport Policy, 45, 31-45. https://doi.org/10.1016/j.tranpol.2015.09.004
Slack, B. (2007), The terminalisation of seaports, In International Workshop on Ports, Cities and Global Supply Chains, Hong Kong, 2005.
SPCaldera (2017). Web Sociedad Portuaria Puerto Caldera. Retrieved from : http://www.spcaldera.com/
SPRBUN (2017). Frecuencias y Tiempos de Transito. Servicios Regulares de Naves Portacontenedores. Retrieved from : http://www.sprbun.com
Tang, L. C., Low, J. M. & Lam, S. W. (2011). Understanding port choice behavior—a network perspective. Networks and Spatial Economics, 11(1). https://doi.org/10.1007/s11067-008-9081-8
TCBUEN (2017) Web de la Terminal de Contenedores Buenaventura. Colombia. Retrieved from : http://www.tcbuen.com/
TCQ (2017). Web Terminal Contenedores Quetzal. Retrieved from : https://www.tcq.com.gt/ TISUR (2017). Web Puerto de Matarani. Accedido a través de: http://bit.ly/2kRn3wu
TP Euroandinos (2017). Web de Terminales Portuarios Euroandinos. Perú. Retrieved from : http://www.puertopaita.com/
TPSA (2017). Web del Terminal Puerto Arica S.A. Chile. Retrieved from : http://www.tpa.cl/ Tsinker, G. (2014). Handbook of port and harbor engineering: geotechnical and structural
aspects. Springer.
UNCTAD (2017). Review of maritime transport series. Retrieved from : http://bit.ly/1VNw1KG Verhoeven, P. (2010). A review of port authority functions: towards a renaissance? Maritime
Policy and Management, 37(3), 247-270. https://doi.org/10.1080/03088831003700645
99
Annex 1. Data section
Descriptive statistics
Mean values (year: 2008)
TEUs GDP NB GOV DG1
Acajutla 157415 2.1813E+10 39 0 0
Antofagasta 76685 2.08E+11 56 1 0
Arica 116720 2.08E+11 34 1 0
Balboa 2167977 2.691E+10 729 1 1
Buenaventura 743295 2.72E+11 211 1 1
Caldera 169827 3.5858E+10 67 1 0
Callao 1203315 1.35E+11 357 0 1
Corinto 58885 8711343160 28 0 0
Coronel 968 2.08E+11 11 1 0
Ensenada 110423 1.05E+12 75 1 1
Esmeraldas 54885 6.6808E+10 13 0 0
Guayaquil 874955 6.6808E+10 439 1 1
Iquique 334302 2.08E+11 193 1 0
Lázaro Cárdenas 524791 1.05E+12 103 1 1
Lirquén 231397 2.08E+11 70 1 0
Manzanillo 1409782 1.05E+12 652 1 1
Matarani 19824 1.35E+11 24 1 0
Mejillones 97226 2.08E+11 97 1 0
Paita 138993 1.35E+11 57 1 0
Puerto Quetzal 280281 3.9975E+10 231 0 0
San Antonio 687864 2.08E+11 165 1 1
San Vicente 604560 2.08E+11 125 1 0
100
Mean value (year: 2015)TEUs GDP NB GOV DG1
Acajutla 190708 2.3606E+10 78 0 0
Antofagasta 77467 2.63E+11 70 1 0
Arica 226893 2.63E+11 90 1 0
Balboa 3294113 4.2242E+10 874 1 1
Buenaventura 911533 3.59E+11 280 1 1
Caldera 235268 4.4415E+10 92 0 0
Callao 1900444 1.86E+11 455 1 1
Corinto 138006 1.1246E+10 48 0 0
Coronel 471426 2.63E+11 108 1 1
Ensenada 193424 1.21E+12 121 1 1
Esmeraldas 59413 8.6639E+10 26 0 0
Guayaquil 1704730 8.6639E+10 380 1 1
Iquique 227099 2.63E+11 113 1 0
Lázaro Cárdenas 1068747 1.21E+12 403 1 1
Lirquén 164994 2.63E+11 38 1 0
Manzanillo 2458135 1.21E+12 642 1 1
Matarani 20002 1.86E+11 6 1 0
Mejillones 223124 2.63E+11 70 1 0
Paita 214483 1.86E+11 42 1 1
Puerto Quetzal 389329 4.9883E+10 30 1 0
San Antonio 1170184 2.63E+11 259 1 1
San Vicente 456176 2.63E+11 83 1 0
101
Mean valuesTEUs GDP NB GOV DG1
Acajutla 163017.125 2.224E+10 50.875 0 0
Antofagasta 87538.25 2.3463E+11 77 1 0
Arica 169788.625 2.3463E+11 69 1 0
Balboa 2928101 3.3831E+10 961.5 1 1
Buenaventura 783770.875 3.125E+11 219.75 1 1
Caldera 180315.25 3.9631E+10 70.75 0.875 0
Callao 1602763 1.6038E+11 402.375 0.75 1
Corinto 86173.125 9653495299 38.875 0 0
Coronel 248021.375 2.3463E+11 65.75 1 0.875
Ensenada 136824 1.1088E+12 94.375 1 1
Esmeraldas 69158.5 7.6771E+10 28.375 0 0
Guayaquil 1322721.5 7.6771E+10 404 1 1
Iquique 254012.875 2.3463E+11 151.75 1 0
Lázaro Cárdenas 903142.375 1.1088E+12 306.875 1 1
Lirquen 190730.125 2.3463E+11 55.375 1 0
Manzanillo 1839708.75 1.1088E+12 671.875 1 1
Matarani 18952.5 1.6038E+11 18.75 1 0
Mejillones 146695 2.3463E+11 97 1 0
Paita 161617.125 1.6038E+11 67.5 1 0.375
Puerto Quetzal 313757.5 4.4081E+10 99.625 0.75 0
San Antonio 968246.5 2.3463E+11 241.25 1 1
San Vicente 482269.125 2.3463E+11 103.875 1 0
Valparaíso 905290.375 2.3463E+11 205.375 1 1