Neuroscience. (2015); 285: 303-311
Spectroscopic measurement of cortical nitric oxide release
induced by ascending activation
N. Espinosa, J. Cudeiro, J. Mariño
Abstract
The transition from sleep to the awake state is regulated by the activation of subcortical nuclei of the brainstem (BS) and basal forebrain (BF), releasing acetylcholine and glutamate throughout the cortex and inducing a tonic state of neural activity. It has been suggested that such activation is also mediated by the massive and diffuse cortical release of nitric oxide (NO). In this work we have combined the spectroscopic measurement of NO levels in the somatosensory cortex of the cat through its marker methemoglobin, as well as two other hemodynamic markers (oxyhemoglobin – oxyHb – and deoxyhemoglobin – deoxyHb), together with the electrical stimulation of BS and BF – to induce an experimental transition from a sleep-like state to an awake-like mode. The results show an increase of NO levels either after BS or BF activation. The response induced by BS stimulation was biphasic in the three studied markers, and lasted for up to 30 s. The changes induced by BF were monophasic lasting for up to 20 s. The systemic blockade of NO production abolished the observed responses to BS whereas responses to BF stimulation were much less affected. These results indicate a crucial role for NO in the neuronal activation induced by the ascending systems.
Key words. hemodynamics; sleep; somatosensory cortex; spectroscopy
Introduction
Arousal is the consequence of an orchestrated change in cortical and subcortical structures. The transition from sleep to the awake state is mainly induced by brainstem (BS) and basal forebrain (BF) neurons (Steriade et al., 1993a), which are part of the classic activating ascending system. As a result of such activation, the cortical release of acetylcholine (ACh) and glutamate (Glu) disrupts the sleep slow oscillatory activity and promotes a transition to the characteristic tonic state of the awake brain (for a review see Steriade et al., 1997). It has been suggested that nitric oxide (NO) is also an important actor in this activation, mainly through its release by cholinergic BF neurons sending axons to the cortex (Bickford et al., 1994 and Cudeiro et al., 2000) and by cortical nitrergic neurons (Cudeiro et al., 1997).
Brain sleep mechanisms have been extensively studied using anesthetized cats as a model to reproduce the slow-wave sleep and its dynamics (Steriade et al., 1991a, Steriade et al., 1991b and McCormick and Bal, 1997). Also, under experimental conditions, the global cortical activity can be efficiently modified through microstimulation of either the peribrachial region (PBr; Moruzzi and Magoun, 1949, Francesconi et al., 1988, Hartveit et al., 1993, Uhlrich et al., 1995 and Wolfe and Palmer, 1998), located in the BS, or the nucleus basalis of Meynert (NB; Metherate et al., 1992 and Mariño and Cudeiro, 2003), located in the BF. The BS contains cholinergic, nitrergic and catecholaminergic neurons sending axons to BF and the thalamus (Steriade et al., 1988). BF neurons extensively release ACh throughout the cortex and, as indicated, probably NO, while thalamocortical neurons release Glu. In the anesthetized cat, the activation of such systems has been proved to be a useful tool to study the sleep– wake mechanisms (Steriade et al., 1991b, Li et al., 1999 and Mariño and Cudeiro, 2003).
Experimental procedures
Experimental preparation
Experiments were performed on 4 adult cats of either sex. Anesthesia was induced with ketamine (15 mg/kg – Pfizer, Madrid, Spain) and xylazine (3 mg/kg – Sigma-Aldrich, Madrid, Spain) i.m. and maintained with isoflurane (1.5–2% for surgery, and 0.5–1% for maintenance, Abbot) in nitrous oxide (70%) and oxygen (30%). Animals were paralyzed with gallamine triethiodide (loading dose of 40 mg, maintenance 10 mg/kg/h i.v., SIGMA) and artificially ventilated; the end tidal CO2 concentration was
adjusted to 3.8–4.2%, body temperature was maintained at 37–38 °C, and heart rate was continuously monitored. Animals were suspended on a stereotaxic frame and the pressure points were infiltrated with lidocaine. The level of isoflurane was chosen to achieve a state of deep anesthesia and particular care was taken to keep a stable pattern of delta (1–4 Hz) slow oscillatory activity throughout the entire experiment. Three craniotomies were performed to insert optical fibers and bipolar tungsten electrodes (details below). All exposed cortical surfaces were bathed in saline to prevent desiccation. At the end of experiments animals were killed by an anesthetic overdose. All animal work was conducted according to national and international guidelines (Spanish Physiology Society and the European Communities Council Directive of November 24, 1986 (86/609/EEC)). The study was approved by the University of A Coruña Ethics Committee (CE-UDC30/1/09).
Electrophysiological and spectroscopy recordings
Electrical and spectroscopic measurements were obtained simultaneously in the primary SSC (S1; coordinates: anterior, 21–23; lateral, 8–10) at a depth of 1–1.5 mm. Electrocorticogram (ECoG) in S1 was continuously recorded and stored (Plexon Inc, Dallas, TX, USA) through a bipolar and concentric electrode at a sampling rate of 2 kHz and filtered on-line with a band-pass of 0.1–500 Hz analog filter (A-M Systems, model 1700).
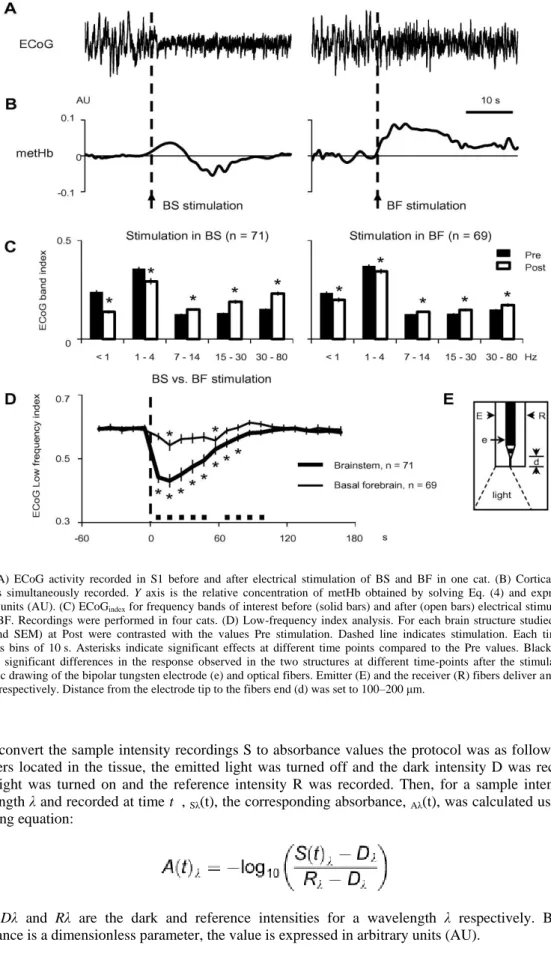
Fig. 2. (A) ECoG activity recorded in S1 before and after electrical stimulation of BS and BF in one cat. (B) Cortical metHb dynamics simultaneously recorded. Y axis is the relative concentration of metHb obtained by solving Eq. (4) and expressed in arbitrary units (AU). (C) ECoGindex for frequency bands of interest before (solid bars) and after (open bars) electrical stimulation in
BS and BF. Recordings were performed in four cats. (D) Low-frequency index analysis. For each brain structure studied, values (mean and SEM) at Post were contrasted with the values Pre stimulation. Dashed line indicates stimulation. Each time-point represents bins of 10 s. Asterisks indicate significant effects at different time points compared to the Pre values. Black squares represent significant differences in the response observed in the two structures at different time-points after the stimulation. E) Schematic drawing of the bipolar tungsten electrode (e) and optical fibers. Emitter (E) and the receiver (R) fibers deliver and collect the light respectively. Distance from the electrode tip to the fibers end (d) was set to 100–200 μm.
To convert the sample intensity recordings S to absorbance values the protocol was as follows: with the fibers located in the tissue, the emitted light was turned off and the dark intensity D was recorded. Next, light was turned on and the reference intensity R was recorded. Then, for a sample intensity at wavelength λ and recorded at time t , Sλ(t), the corresponding absorbance, Aλ(t), was calculated using the
following equation:
Subcortical stimulation and cortical activity modulation
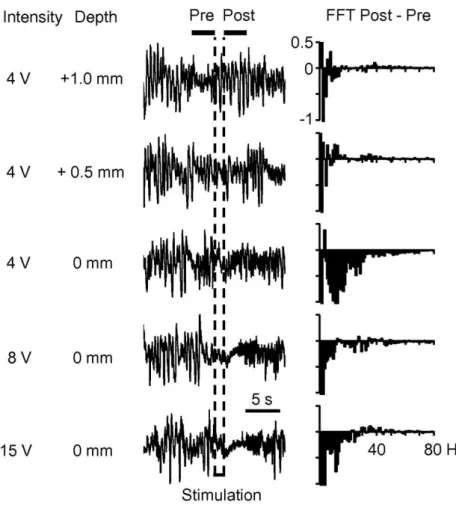
The global cortical activity was efficiently modulated – as indicated by the ECoG recordings – by the combination of anesthesia and electrical stimulation. The continuous anesthetic administration maintained a slow oscillatory pattern within the delta range (Fig. 1, left part of the ECoGs). The temporal transition to an awake-like pattern was achieved through the application of electrical stimulation either in BS or BF (sequentially and randomly through electrical microstimulation at intervals of 2–8 min). Trains of rectangular cathodal shocks (0.05 ms, 0.1–1 mA) were delivered at a frequency of 50 Hz for a period of 2 s through bipolar electrodes (insulated except for 500 μm at the tip; contacts separated by 500 μm). Electrodes were positioned and held in place following a procedure published elsewhere (Mariño and Cudeiro 2003). It allowed us to precisely localize the subcortical loci for electrical stimulation rendering histological reconstruction, in this case, unnecessary. The procedure was as follows. Horsley–Clarke coordinates were used to achieve the PBr region in the BS (anterior, 0; lateral 4; ventral, −2) and the NB in the BF (anterior, 10–13; lateral, 8.5–10; ventral, −1 to 0). For each electrode, the final position in the vertical axes was adjusted monitoring the stimulation effect on the ECoG activity. Fig. 1 depicts one example of the successive ECoG recordings and frequency spectra obtained during the descent of one stimulating electrode toward the PBr region. A low-intensity (typically 4 V) 2-s train was delivered to localize the optimal position inside each brain region. The search procedure started with the electrode located 4 mm above the theoretical stereotaxic coordinates and the location was tested in steps of 0.25 mm. Once a clear effect on the ECoG was evoked, the voltage was adjusted (between 4 and 15 V) to the minimum intensity capable of optimally inducing a low-amplitude and high-frequency activity in S1 (see waveforms and fast Fourier transform (FFT) analysis in Fig. 1). The same procedure was applied to locate the appropriate stimulating location in the BF. Such effective modulation of the ECoG was indicative of a suitable stimulation of the ascendant pathways (Mariño and Cudeiro 2003).
3.4. Pharmacology
In order to inhibit the enzyme neuronal NOS (neuronal nitric oxide synthase), responsible of neuronal NO production, 7-nitroindazole (7NI; SIGMA) was administered i.v. over 15 s (3.5 mg/kg dissolved in 0.1 ml DMSO (SIGMA); de Labra et al., 2009).
3.5. Data analysis
The FFT was used to obtain the power spectral density from ECoG recordings for periods of 5–10 s before and after electrical stimulation. Frequency ranges of interest were adjusted to previously described cat sleep rhythms (for a short review, see Steriade et al. (1993b)) according to the following classification: <1 Hz (slow), 1–4 Hz (delta), 7–14 Hz (spindle), 15–30 Hz (beta) and 30–80 Hz (gamma). To evaluate the electrical stimulation effect on each frequency band, an ECoG index was defined as follows:
where ∑PSD(f) is the cumulative sum of the power spectral density for the frequency range f . fn is the frequency range for one of the rhythms aforementioned and fT is the frequency range between 0 and 80 Hz (DC component filtered previously). Specifically, to evaluate the power of the lowest frequency waves in the ECoG, a low-frequency index (LFi) was defined as follows:
For the spectroscopic recordings, absorbance values were filtered (Savitzky–Golay filter) and linearly interpolated in the wavelength domain (range 600–700 nm, steps of 1 nm) and in time domain to normalize timestamps (100 Hz, t = 0 s for the electrical stimulation onset). The relative concentration of oxyHb, deoxyHb and metHb were calculated by means of the Lambert–Beer’s law solving the following Eq. (4).
where Unknown node type: italicUnknown node type: italicioxyHbUnknown node
type: italicUnknown node type: italicideoxyHb and Unknown node type: italicUnknown node type: italicimetHb are the extinction spectra, at wavelength λiUnknown node type: italici, for oxy-, deoxy-, and metHb, respectively. Since Aλi(t)AUnknown node type: italici(t) is the recorded absorbance value at wavelength λiUnknown node type: italici (see Eq. (1)), we solved Eq. (4) for different wavelength trios selected randomly within the range 600–700 nm (steps of 1 nm; smaller steps did not modified the statistical significance of final results) until the whole wavelength range was covered. The extinction spectra reported by Zijlstra et al. (2000) was used for the corresponding wavelengths. As a result, for each relative concentration we obtained a distribution and the average value was taken as the estimated value at time = t. Finally, a wavelet filter was applied to oxy-, deoxy-, and metHb in the time domain using a family of Meyer (discrete approximation) wavelets.
Statistical analysis was done using paired t-test or Wilcoxon test. The hypothesis of normality was checked using the Kolmogorov–Smirnov test. Results were deemed to be significant when p < 0.05. Both analytical and statistical analyses were performed using in-house software written in MATLAB (MathWorks, 2010).
Results
Effects on ECoG activity of the electrical stimulation of activating ascendant pathways
The sleep-like ECoG activity induced by anesthesia was modified by the electrical stimulation of BS and BF (Fig. 2A). The ECoG changed from a high-amplitude frequency pattern of activity to a low-amplitude high-frequency mode.
Electrical stimulation of BS (n = 71) and BF (n = 69) modified the sleep-like oscillatory activity induced by anesthesia in different ways. To quantify this phenomenon, the ECoG power spectral density was calculated 5 s before the onset and 5 s immediately after the offset of the electrical stimulation. The ECoGindex in the frequency of interest bands were calculated (see “Experimental procedure” section).
Population analysis of the effects induced by BS ( Fig. 2C, left) and BF ( Fig. 2C, right) stimulation revealed a decrease in the low-frequency activity (below 4 Hz) and an increase of higher frequency components (above 4 Hz).
To analyze the persistence and strength of the electrical stimulation effects, the LFi (see “Experimental procedure” section) was calculated using 10-s bins. Fig. 2D reveals a fast drop of the LFi induced by BS activation, lasting for up to 60 s after the electrical stimulation, whereas BF stimulation induced significant changes 10 s after the stimulation and lasting only 10 s (with an apparent late rebound). Besides, not only the duration but also the magnitude of the effects induced on the ECoG by the electrical stimulation on BS and BF was different (the statistically significant differences are indicated by black squares in Fig. 2D).
Effects on NO and hemodynamic markers of the stimulation of ascending pathways
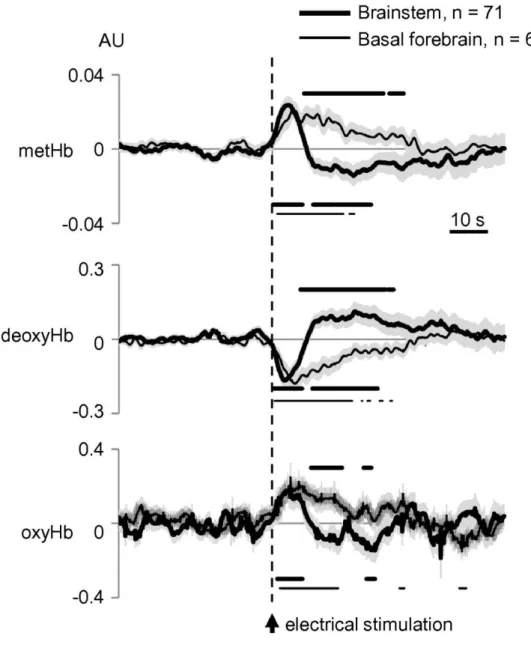
Fig. 3. BS and BF stimulation-induced responses at S1 on the three studied markers. Dots under curves show significant changes at different time-points after BS (thick dots) and BF (thin dots) stimulation compared to the average response 60 s before the stimulation. Dots above curves denote significant differences between temporal profiles for BS and BF stimulation. Shaded area represents SEM. Values obtained by solving Eq. (4) and expressed in arbitrary units (AU). Recordings were performed simultaneously with ECoGs analyzed in Fig. 2C, D (four cats).
Stimulation in BS (thick curves in Fig. 3) induced an increase of metHb, followed by a subsequent decrease, lasting in total for up to 30 s after the stimulation (as indicated by the reference lines below the curve). A similar biphasic change, but in the opposite direction, was observed for the deoxyHb. Changes in of oxyHb were less conclusive, showing an initial increase of its levels lasting for around 10 s after the stimulation, followed by a variable – although in some periods statistically significant – response.
With regard to BF stimulation (thin curves in Fig. 3), it induced, in contrast, a monophasic variation of the three markers. The mean response showed a clear increase of metHb levels, lasting for around 20 s after the stimulation; together with a decrease of deoxyHb and an increase of oxyHb of similar duration.
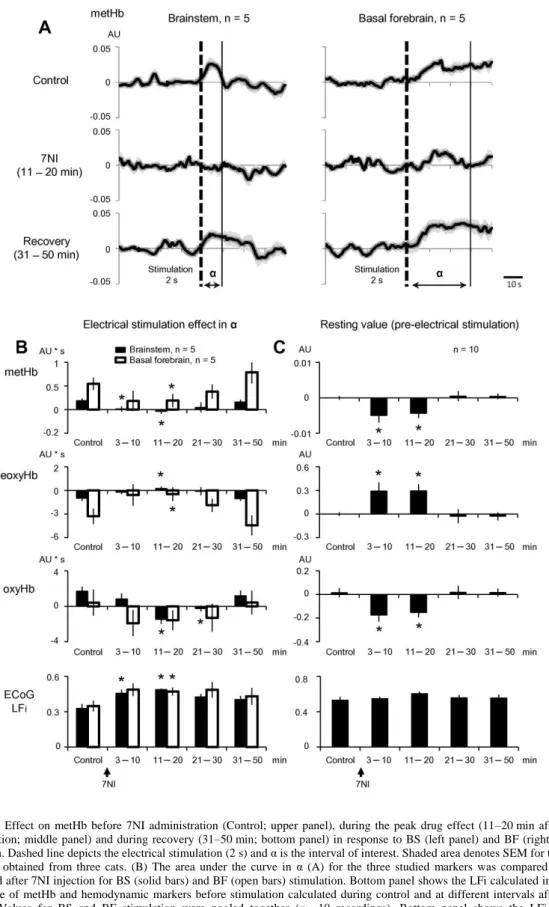
Dissecting the role of NO on cortical activation
As we had previously shown, the systemic application of 7NI reduced the efficacy of the ascendant activation to modify the ECoG slow pattern (Mariño and Cudeiro, 2003). In the present study we compared that phenomenon with the simultaneously recorded spectroscopic measurements.
Discussion
The present study unveils the in vivo changes on NO dynamics in the cat cortex during the transition from a global pattern of synchronized slow activity to an awake-like mode. In previous works we suggested a direct role for the neuronal NO in the cortical activation induced by the ascending systems. We observed that the changes in ECoG activity induced by BF stimulation were practically abolished when administering 7NI i.p. ( Mariño and Cudeiro, 2003). Here, by means of spectroscopic continuous recordings, we have studied in detail the time course of NO release, and compared it with the responses induced by BF and BS stimulation.
Our results show that, in parallel to the categorical disruption of the slow ECoG activity evoked by BS and BF stimulation, there is an increase of NO levels immediately after the activation, lasting for 10 s (BS) or 20 s (BF). This fact strongly supports our hypothesis that the sudden and global release of NO throughout the cortex (we have measured a similar NO dynamics in primary visual cortex; not shown here) is directly contributing to the characteristic neuronal activation that occurs during the transition from slow to tonic activity. In the present work the spontaneous slow delta activity was induced by anesthesia, and cortical de-synchronization was transiently evoked by electrical stimulation; but the observed NO changes are likely to be of similar nature under natural sleep–wake transitions. The magnitude of the referred changes was smaller in metHb than in the other markers (note arbitrary unit axes in Fig. 3). It must be noted that BF stimulation evoked significant changes of shorter duration, an effect than can explain the smaller changes observed in the ECoG after this activation. An interesting possibility to complement our data could be the use of imaging techniques (e.g. optical imaging). It might provide spatial information to corroborate the “diffuse” increase in NO over the cortex. Certainly it will deserve attention in future experiments together with multiple spectroscopic measurements on different cortical areas.
Is this NO-mediated cortical activation dependent on cGMP production? Our experimental approach does not allow us to directly address this issue and we can only speculate. In the cerebral cortex, the diversity of NO production sites suggests a complex role in cortical processing and perhaps more than a single mode of action of NO. For instance, it has been shown that NO may be involved in the NMDA-mediated release of noradrenaline and Glu suggesting that NO can have both direct actions and actions on modulatory processes (Montague et al., 1991). On the other hand previous findings from our group (Cudeiro et al., 1997) obtained with iontophoretic application of 8-bromo-cGMP suggest a simple modulation of the cGMP secondary messenger system. Such an action on cGMP has been widely reported in the literature (for reviews see Garthwaite, 1991, Moncada et al., 1991, Snyder and Bredt, 1991, Schuman and Madison, 1994 and Zhang and Snyder, 1995).
In an in vivo preparation like the one we used here, it is difficult to clearly separate the NO effects of the vascular and the neuronal compartments. Besides, it has been reported that the exposure of nitrous oxide might interfere with NO metabolism ( Zelinski et al., 2009 and Ohgami et al., 2010) and with NO background levels. Therefore, we cannot completely exclude a putative interference of the anesthesia with the observed levels of NO, although we trust that our main findings remain, since electrical stimulation produced an increment of NO. In any case, our goal was to discern the participation of neuronal NO in the massive cortical activation induced by the ascendant pathways. The inability of the ascending stimulation to induce such ECoG and metHb changes after the blockage of nNOS clearly points to a direct contribution of the neuronal NO in the activating process.
Possible functional significances of BF and BS activations
blood flow increase without a dramatic basal neuronal activity disturbance provides sufficient glucose and oxygen for a proper energy metabolism of the neural network.
PBr stimulation, in contrast, involves not only a cortical cholinergic and nitrergic release through BF but also a glutamatergic effect induced via the thalamus that would be the origin of a stronger effect on ECoG as well as the post-stimulus over- and undershoots observed in deoxy- and metHb, respectively. The ability to interfere on cortical activity and the fact that it receives inputs from the lateral parts of the preoptic area (Swanson et al., 1987), an active sleep-promoting structure (Szymusiak and McGinty, 1986, Sherin et al., 1996 and Szymusiak et al., 2001), supports the hypothesis that the PBr plays a key role in the transitions of the sleep–wake cycle.
Implications in the blood oxygenation level dependent (BOLD) signal interpretation
BOLD signal is a parameter widely used to estimate the cerebral activity which has given rise to functional network maps on several species (Buckner et al., 2008, Pawela et al., 2008, Mantini et al., 2011 and White et al., 2011) in virtue of a supposed neurovascular coupling. BOLD response is based on the paramagnetic property of deoxyHb. Thus, changes of deoxyHb concentration in a vascularized area subjected to a magnetic field are reflected as a change in the magnetic resonance (MR) signal. Curiously, neural activity leads to an increase in MR signal even though deoxyHb decreases MR signal (Ogawa et al., 1990). Given the diamagnetic nature of oxyHb, and supported by optical imaging studies (Malonek and Grinvald, 1996), it is believed that this effect occurs because oxyHb displaces deoxyHb that had been suppressing the MR signal intensity. Our data provide a concomitant cause based on the paramagnetic property of metHb being even stronger than deoxyHb. It is due to the fact that unpaired electrons in heme iron of hemoglobin provide paramagnetic properties. Thus, deoxyHb has four unpaired electron and metHb has five (Nitz et al., 2010). As a result, when NO release is associated to a neural activation, a portion of the increase in MR signal might be due to the influence of metHb increase as well. In fact, previous results show an impact of metHb in BOLD response (Duewell et al., 1996 and Leung and Moody, 2010, but see Pang et al., 2010) and a recent study has encouraged exploring their clinical implications (Aamand et al., 2013). Finally, we do not discard that other techniques susceptible to high concentrations of metHb, as MR spectroscopy (Gujar et al., 2005), could be affected by NO production.
Conclusions
The electrical stimulation of the activating ascending systems induces profound changes on cortical (electrical and vascular) activity. We have outlined the role of the neuromodulator NO in this process. Our results reveal a transient cortical increase of the NO marker metHb after the induction of a global brain activation, a change that is abolished after the inhibition of NO synthesis. The present study supports the hypothesis that NO collaborates in the transition from slow-wave sleep to tonic activity in the cortex.
Funding
This work was supported by Xunta de Galicia (INCITE09 137 272 PR and Ayudas a Grupos Consolidados).
References
Aamand et al., 2013. R. Aamand, T. Dalsgaard, Y.C. Ho, A. Møller, A. Roepstorff, T.E. Lund. A NO way to BOLD?: Dietary nitrate alters the hemodynamic response to visual stimulation. Neuroimage, 83 (2013), pp. 397–407
Ackermann et al., 1984. R.F. Ackermann, D.M. Finch, T.L. Babb, J. Engel Jr. Increased glucose metabolism during long-duration recurrent inhibition of hippocampal pyramidal cells. J Neurosci, 4 (1984), pp. 251–264
Bickford et al., 1994. M.E. Bickford, A.E. Günlük, S.C. Van Horn, S.M. Sherman. GABAergic projection from the basal forebrain to the visual sector of the thalamic reticular nucleus in the cat. J Comp Neurol, 348 (1994), pp. 481–510
Buzsaki et al., 2007. G. Buzsaki, K. Kalia, M. Raichle. Inhibition and brain work. Neuron, 56 (2007), pp. 771–783
Cudeiro et al., 1997. J. Cudeiro, C. Rivadulla, R. Rodríguez, K.L. Grieve, S. Martínez-Conde, C. Acuña. Actions of compounds manipulating the nitric oxide system in the cat primary visual cortex. J Physiol (Lond), 504 (1997), pp. 467–478
Cudeiro et al., 2000. J. Cudeiro, C. Rivadulla, K.L. Grieve. A possible role for nitric oxide at the sleep/wake interface. Sleep, 23 (2000), pp. 829–835
de Labra et al., 2009. C. de Labra, C. Rivadulla, N. Espinosa, M. Dasilva, R. Cao, J. Cudeiro. Different sources of nitric oxide mediate neurovascular coupling in the lateral geniculate nucleus of the cat. Front Syst Neurosci, 3 (2009), p. 9
Duewell et al., 1996. S. Duewell, C.E. Kasserra, P. Jezzard, R.S. Balaban. Evaluation of methemoglobin as an autologous intravascular MRI contrast agent. Magn Reson Med, 35 (1996), pp. 787–789
Feelisch et al., 1996. M. Feelisch, D. Kubitzek, J. Werringloer. The oxyhemoglobin assay. M. Feelisch, J.S. Stamler (Eds.), Methods in nitric oxide research, Wiley, Chichester (1996), pp. 455–478
Francesconi et al., 1988. W. Francesconi, C.M. Müller, W. Singer. Cholinergic mechanisms in the reticular control of transmission in the cat lateral geniculate nucleus. J Neurophysiol, 59 (1988), pp. 1690–1718
Garthwaite, 1991. J. Garthwaite. Glutamate, nitric oxide and cell-cell signalling in the nervous system. Trends Neurosci, 14 (2) (1991), pp. 60–67
González-Mora et al., 2002. J.L. González-Mora, F.A. Martín, D. Rojas-Díaz, S. Hernández, I. Ramos-Pérez, V.D. Rodríguez, M.A. Castellano. In vivo spectroscopy: a novel approach for simultaneously estimating nitric oxide and hemodynamic parameters in the rat brain. J Neurosci Methods, 119 (2002), pp. 151–161
Gujar et al., 2005. S.K. Gujar, S. Maheshwari, I. Björkman-Burtscher, P.C. Sundgren. Magnetic resonance spectroscopy. J Neuroophthalmol, 25 (3) (2005), pp. 217–226
Hartveit et al., 1993. E. Hartveit, S.I. Ramberg, P. Heggelund. Brain stem modulation of spatial receptive field properties of single cells in the dorsal lateral geniculate nucleus of the cat. J Neurophysiol, 70 (1993), pp. 1644–1655
Jones, 2003. B.E. Jones. Arousal systems. Front Biosci, 8 (2003), pp. s438–s451
Jones, 2004. B.E. Jones. Activity, modulation and role of basal forebrain cholinergic neurons innervating the cerebral cortex. Prog Brain Res, 145 (2004), pp. 157–169
Kelm et al., 1997. M. Kelm, R. Dahmann, D. Wink, M. Feelisch. The nitric oxide/superoxide assay. Insights into the biological chemistry of the NO/O-2 interaction. J Biol Chem, 272 (1997), pp. 9922– 9932
Leung and Moody, 2010. G. Leung, A.R. Moody. MR imaging depicts oxidative stress induced by methemoglobin. Radiology, 257 (2010), pp. 470–476
Li et al., 1999. B. Li, K. Funke, F. Wörgötter, U.T. Eysel. Correlated variations in EEG pattern and visual responsiveness of cat lateral geniculate relay cells. J Physiol (Lond), 514 (1999), pp. 857–874
Malonek and Grinvald, 1996. D. Malonek, A. Grinvald. Interactions between electrical activity and cortical microcirculation revealed by imaging spectroscopy: implications for functional brain mapping. Science, 272 (1996), pp. 551–554
Mantini et al., 2011. D. Mantini, A. Gerits, K. Nelissen, J.-B. Durand, O. Joly, L. Simone, H. Sawamura, C. Wardak, G.A. Orban, R.L. Buckner, W. Vanduffel. Default mode of brain function in monkeys. J Neurosci, 31 (2011), pp. 12954–12962
Mariño and Cudeiro, 2003. J. Mariño, J. Cudeiro. Nitric oxide-mediated cortical activation: a diffuse wake-up system. J Neurosci, 23 (2003), pp. 4299–4307
Metherate et al., 1992. R. Metherate, C.L. Cox, J.H. Ashe. Cellular bases of neocortical activation: modulation of neural oscillations by the nucleus basalis and endogenous Ach. J Neurosci, 12 (1992), pp. 4701–4711
McCormick and Bal, 1997. D.A. McCormick, T. Bal. Sleep and arousal: thalamocortical mechanisms. Annu Rev Neurosci, 20 (1997), pp. 185–215
Moncada et al., 1991. S. Moncada, R.M. Palmer, E.A. Higgs. Nitric oxide: physiology, pathophysiology, and pharmacology. Pharmacol Rev, 43 (2) (1991), pp. 109–142
Montague et al., 1991. P.R. Montague, C.D. Gancayco, M.J. Winn, R.B. Marchase, M.J. Friedlander. Role of NO production in NMDA receptor-mediated neurotransmitter release in cerebral cortex. Science, 263 (5149) (1991), pp. 973–977
Nitz et al., 2010. W.R. Nitz, T. Balzer, D.S. Grosu, T. Allkemper. Principles of magnetic resonance. P. Reimer, P.M. Parizel, J.F.M. Meanev, F.-A. Stichnoth (Eds.), Clinical MR imaging: a practical approach, Springer (2010)
Ogawa et al., 1990. S. Ogawa, T.M. Lee, A.S. Nayak, P. Glynn. Oxygenation-sensitive contrast in magnetic resonance image of rodent brain at high magnetic fields. Magn Reson Med, 14 (1990), pp. 68–78
Ohgami et al., 2010. Y. Ohgami, E. Chung, R.M. Quock. Nitrous oxide-induced NO-dependent neuronal release of β-endorphin from the rat arcuate nucleus and periaqueductal gray. Brain Res, 1366 (2010), pp. 38–43
Pang et al., 2010. K.K. Pang, Y.S. Tsai, H.C. Chang, K.N. Hsu. Methemoglobin suppression in a 0.3 Tesla magnet: an in vitro and in vivo study. Acad Radiol, 17 (5) (2010), pp. 624–627
Pawela et al., 2008. C.P. Pawela, B.B. Biswal, Y.R. Cho, D.S. Kao, R. Li, S.R. Jones, M.L. Schulte, H.S. Matloub, A.G. Hudetz, J.S. Hyde. Resting-state functional connectivity of the rat brain. Magn Reson Med, 59 (2008), pp. 1021–1029
Rivadulla et al., 2011. C. Rivadulla, C. de Labra, K.L. Grieve, J. Cudeiro. Vasomotion and neurovascular coupling in the visual thalamus in vivo. PLoS One, 6 (2011), p. e28746
Schuman and Madison, 1994. E.M. Schuman, D.V. Madison. Nitric oxide and synaptic function. Annu Rev Neurosci, 17 (1994), pp. 153–183
Semba, 2000. K. Semba. Multiple output pathways of the basal forebrain: organization, chemical heterogeneity, and roles in vigilance. Behav Brain Res, 115 (2000), pp. 117–141
Sherin et al., 1996. J.E. Sherin, P.J. Shiromani, R.W. McCarley, C.B. Saper. Activation of ventrolateral preoptic neurons during sleep. Science, 271 (1996), pp. 216–219 oscillation of cat thalamocortical neurons implicated in sleep delta waves: cortically induced synchronization and brainstem cholinergic suppression. J Neurosci, 11 (1991), pp. 3200–3217
Steriade et al., 1991b. M. Steriade, R.C. Dossi, D. Paré, G. Oakson. Fast oscillations (20–40 Hz) in thalamocortical systems and their potentiation by mesopontine cholinergic nuclei in the cat. Proc Natl Acad Sci U S A, 88 (1991), pp. 4396–4400
Steriade et al., 1993a. M. Steriade, F. Amzica, A. Nuñez. Cholinergic and noradrenergic modulation of the slow (approximately 0.3 Hz) oscillation in neocortical cells. J Neurophysiol, 70 (1993), pp. 1385– 1400
Steriade et al., 1993b. M. Steriade, D.A. McCormick, T.J. Sejnowski. Thalamocortical oscillations in the sleeping and aroused brain. Science, 262 (1993), pp. 679–685
Steriade et al., 1997. M. Steriade, E.G. Jones, D.A. McCormick. Thalamus. Organization and function, vol. 1Elsevier, Oxford (1997), pp. 269–337
Swanson et al., 1987. L.W. Swanson, G.J. Mogenson, R.B. Simerly, M. Wu. Anatomical and electrophysiological evidence for a projection from the medial preoptic area to the ‘mesencephalic and subthalamic locomotor regions’ in the rat. Brain Res, 405 (1987), pp. 108–122
Szymusiak and McGinty, 1986. R. Szymusiak, D. McGinty. Sleep-related neuronal discharge in the basal forebrain of cats. Brain Res, 370 (1986), pp. 82–92
Szymusiak et al., 2001. R. Szymusiak, T. Steininger, N. Alam, D. McGinty. Preoptic area sleep-regulating mechanisms. Arch Ital Biol, 139 (2001), pp. 77–92
Uhlrich et al., 1995. D.J. Uhlrich, N. Tamamaki, P.C. Murphy, S.M. Sherman. Effects of brain stem parabrachial activation on receptive field properties of cells in the cat’s lateral geniculate nucleus. J Neurophysiol, 73 (1995), pp. 2428–2447
Wolfe and Palmer, 1998. J. Wolfe, L.A. Palmer. Temporal diversity in the lateral geniculate nucleus of cat. Vis Neurosci, 15 (1998), pp. 653–675
White et al., 2011. B.R. White, A.Q. Bauer, A.Z. Snyder, B.L. Schlaggar, J.-M. Lee, J.P. Culver. Imaging of functional connectivity in the mouse brain. PLoS One, 6 (2011), p. e16322
Zelinski et al., 2009. L.M. Zelinski, Y. Ohgami, R.M. Quock. Exposure to nitrous oxide stimulates a nitric oxide-dependent neuronal release of beta-endorphin in ventricular-cisternally-perfused rats. Brain Res, 1300 (2009), pp. 37–40