Economic Feasibility of Renewable Electricity Generation Systems for Local Government Office: Evaluation of the Jeju Special Self Governing Province in South Korea
13
0
0
Texto completo
(2) Sustainability 2017, 9, 82. 2 of 13. Therefore, the majority of newly installed electricity generation systems now include some sort of renewable electricity generation facilities [4]. The Act also states that the obligatory energy supply ratio of public institution buildings should be increased to more than 30% by 2020 [2]. Table 1 shows the target ratio of the South Korean government suggested by the Act. The Act includes 20-year promotion plans for renewable and sustainable energy diffusion and aims to identify strategic support locations having promising renewable resources [3]. However, the contribution of renewable energy generation facilities on the national energy production in 2015 is significantly lower than the suggested level (4.54%) [5]. Several islands in these locations have installed independent micro-grid systems, which can be independently operated without the grid connection, replacing their diesel generators run with fossil fuels. A number of studies in the literature have examined the efficiency of such installations. For example, Yoo and his colleagues tested the economic feasibility of independent electricity generation systems for Ulleung Island, one of the far eastern islands in Korea [6]. They proposed an optimized configuration of systems for generation at a cost of energy (COE) of $0.344 per kWh with a 97% renewable fraction (“the ratio of the electricity production of renewable energy generation facilities to the total amount of electricity production”) [6]. Bae and Shim [7] examined the case of Hong-do Island in Korea, and proposed a wind-hybrid energy system consisting of two wind-turbine models and a single diesel generator. These configurations showed a COE of $0.303–$0.313 per kWh with an 84% renewable fraction. In addition to the cases of these islands, several studies have investigated the feasibility of using renewable energy generation systems in Korea’s interior locations. For example, Choi and colleagues investigated a photovoltaic (PV)-oriented energy generation system for grid-connected semiconductor factories in Korea [8]. They proposed a PV-hybrid electricity system utilizing PV arrays and battery units that generated at a COE of $0.668 per kWh and reduced emissions by more than 250,000 kg of carbon dioxide, 2.8 kg of unburned hydrocarbons, and 1.4 kg of nitrogen oxides per year. Table 1. The obligatory energy supply ratio of public institution buildings. Year. 2014. 2015. 2016. 2017. 2018. 2019. 2020. Ratio. 12%. 15%. 18%. 21%. 24%. 27%. 30%. The local government of Jeju Province has been particularly active in implementing policies to promote and support the shift to renewable energy (e.g., using subsidies and tax reduction). Jeju has initiated the “Carbon-Free Island Jeju by 2030” plan to make the island 100% carbon free by 2030. The first stage of the plan has already made Gapa Island (a small island located south of Jeju) completely carbon free, and the island’s diesel generators have been replaced with new and renewable energy grids (mainly solar and wind energy). Jeju continues to implement its carbon-free policies and proposes to achieve more than a 50% renewable fraction, establish smart-grid systems, and utilize wind turbines to generate more than 2 GW of electricity (capacity-oriented) for the island [9]. Ultimately, both the national and local governments plan to disseminate renewable energy infrastructure throughout Jeju so as to supply approximately 330 MW and 850 MW by 2020 and 2030, respectively [10]. In order to find a way to further expedite and promote renewable energy plans in Jeju Special Self-Governing Province, this study develops a renewable energy-generation configuration for government offices in the island and proposes two optimal configurations for both independent and grid-connected systems. The proposed configurations are verified via the hybrid optimization of multiple energy resources (HOMER) software, a simulation tool developed in the United States by the National Renewable Energy Laboratory (NREL); this software allows for analyzing and designing simulated energy generation systems with a large number of economic and technical parameters. Table 2 shows the inputted parameters and potential outcomes of using the HOMER software..
(3) Sustainability 2017, 9, 82. 3 of 13. Table 2. The inputted parameters and outcomes generally generated by the HOMER software [11]. Inputted Parameters Economic. Technical. Environmental. Annual real interest rate (%), Capital and operation and management „costs ($), Project lifetime (years), Capacity shortage penalty ($ per kWh), Emissions penalty for carbon dioxide, monoxide, unburned hydrocarbons, particulate matter, sulfur dioxide, nitrogen oxides ($ per ton), Diesel price ($ per liter) PV array, battery, converter, generator, wind and hydro turbines: Capital cost ($), Replacement cost ($), Operation & management cost ($), Lifetime (years) Grid: Price ($ per kWh), Sellback ($ per kWh), Interconnection charge ($), Standby charge ($ per year). PV array: Derating factor (%), Slope (degrees), Ground reflectance (%) Wind turbine: Hub height (meters), Rated power (kW) Battery: Nominal voltage (V), Nominal capacity (Ah or kWh) Converter: Efficiency (%) Electricity load: Hourly electricity consumption (kW) Generator: Minimum load ratio (%) Grid: Gas emissions (carbon dioxide, carbon monoxide, unburned hydrocarbons, particulate matter, sulfur dioxide, and nitrogen oxides; g per kWh) Hydro turbine: Available head (meters), Design flow rate (liters per second), Minimum and maximum flow ratio (%), Efficiency (%). Stream flow of hydro resource (liters per second), Monthly average wind speed (m/s), Clearness of solar resource, Daily radiation of solar resource (kWh/m2 /d), Latitude and longitude. Outcomes Economic. Total net present costs ($), annualized costs ($ per year) of all components and system in capital, replacement, operation & management, salvage, Cost of energy ($ per kWh), Renewable fraction (%). Technical. Environmental. Annual electricity production of all components (kWh), Annual electricity consumption and fraction of all components including excess electricity, unmet load, and capacity shortage (kWh, %) PV array, hydro and wind turbine: Rated capacity (kW), Mean, min. and max. output (kW), PV (or wind, hydro) penetration (%), Hours of operation (hours per year), Levelized cost ($ per kWh) Battery: Strings in parallel (#), Nominal capacity (kWh), Lifetime throughput (kWh), Energy in and out (kWh per year), Storage depletion and losses (kWh per year), Annual throughput (kWh per year), Expected life (years) Converter: Mean, minimum, and maximum output (kW), Capacity factor (%), Hours of operation (hours per year), Losses, energy in and out (kWh per year). Emissions of carbon dioxide, monoxide, unburned hydrocarbons, particulate matter, sulfur dioxide, nitrogen oxides (kg per year).
(4) Sustainability 2017, 9, 82 Sustainability 2017, 2017, 9, 9, 82 82 Sustainability. 4 of 13 of 13 13 44 of. The remainder remainder of of the the article article is is organized organized as as follows: follows: Section Section reviews the current status of of the the The remainder article organized the The of the is as follows: Section 222 reviews reviews the the current current status status of main offices of Jeju Special Self-Governing Province; Section 3 presents background information for main offices of Jeju Special Self-Governing Province; Section 3 presents background information for main offices of Jeju Special Self-Governing Province; Section 3 presents background information for the simulation simulation in in this this study; study; Sections discusses the the guidelines guidelines and and simulation simulation results; results; and, and, finally, the discusses the guidelines the simulation in this study; Sections Section 444discusses and simulation results; and, finally, finally, Section 5 presents the implications and conclusions of the study. Section 5 presents the implications and conclusions of the study. Section 5 presents the implications and conclusions of the study. 2. Main Main Government Government Offices Officesof ofJeju JejuSpecial SpecialSelf-Governing Self-GoverningProvince Province of Jeju Special Self-Governing Province 2. Offices 2.1. 2.1. Geographical Geographical Location Location and and Facilities Facilities The offices of theof Island in 12 buildings, with approximately employees [10,12], Thegovernment government offices ofJeju the Jejuare Island are in in 12 12 buildings, with 1100 approximately 1100 The government offices the Jeju Island are buildings, with approximately 1100 0 longitude. Figure 1 gives the located in the northern sidein thenorthern island atside 33◦ 29 latitude and 126◦ 29latitude employees [10,12], located inofthe the northern side of0 the the island at 33°29′ 33°29′ latitude and 126°29′ 126°29′ longitude. longitude. employees [10,12], located of island at and location the the main offices.of area is 32,223 m2 . area Figure 11of gives the location location ofThe thetotal mainoffice offices. The total office office area is is 32,223 32,223 m m22.. Figure gives the main offices. The total. Figure 1. 1. Geographical Geographical location location of of the the main main government government offices offices of of Jeju Jeju Province. Province. Figure Figure 1. Geographical location of the main government offices of Jeju Province.. 2.2. Load Load Information Information 2.2. 2.2. Load Information The electricity electricity supply supply of of the the main main offices offices of of Jeju Jeju Province Province is is operated operated by by the the grid grid system system of of Jeju Jeju The The electricity supply of the main offices of Jeju Province is operated by the grid system of Island, and and this this system system is is connected connected to to the the South South Korean Korean national national grid grid system. system. The The electricity electricity Island, Jeju Island, and this system is connected to the South Korean national grid system. The electricity consumption data data for for this this study study are are collated collated from from the the local local government government of of Jeju Jeju Province Province and and the the consumption consumption data for this study are collated from the local government of Jeju Province and the Korea Electric Electric Power Power Corporation Corporation databases databases in in 2015 2015 [6–8]. [6–8]. Figure Figure 22 shows shows the the seasonal seasonal profile profile of of the the Korea Korea Electric Power Corporation databases in 2015 [6–8]. Figure 2 shows the seasonal profile of the electricity load load of of the the main main offices; offices; the the average average electricity electricity demand demand of of the the offices offices is is 7948 7948 kWh/d kWh/d and and electricity electricity load of the main offices; the average electricity demand of the offices is 7948 kWh/d and 331 kW, kW, with with aa peak peak demand demand of of 435 435 kW. kW. Thus, Thus, the the load load factor factor is is calculated calculated as as 0.761. 0.761. 331 331 kW, with a peak demand of 435 kW. Thus, the load factor is calculated as 0.761.. Seasonal profile Figure 2. 2. Seasonal profile of of the the electricity electricity load load used used in in our our simulation simulation (collected (collected in in 2014). 2014). Figure. 2.3. Solar Solar Resource Resource Information Information 2.3. Weuse usethe thesolar solarresource resourcedata dataorganized organized by bythe themonthly monthlysolar solar radiation radiation and and solar solar clearness clearness index index We use the solar resource data organized by the monthly solar radiation We for our our simulation. simulation. The The data data are arecollected collected from fromthe theNational NationalAeronautics Aeronautics and andSpace SpaceAdministration Administration simulation. are collected from the National Aeronautics and Space Administration for 2 /drespectively. database [6–8,10]. [6–8,10]. TheThe annual radiation and clearness clearness index are are 4.190are kWh/m /dkWh/m and 0.496, 0.496, respectively. database annual radiation and index 4.190 kWh/m and database [6–8,10].The annual radiation and clearness index 4.19022/d and 0.496, Figure 33 shows shows the annual annual solar resource information for the main main offices offices ofmain Jeju Province. Province. Figure the solar information the of Jeju respectively. Figure 3 shows theresource annual solar resourcefor information for the offices of Jeju Province..
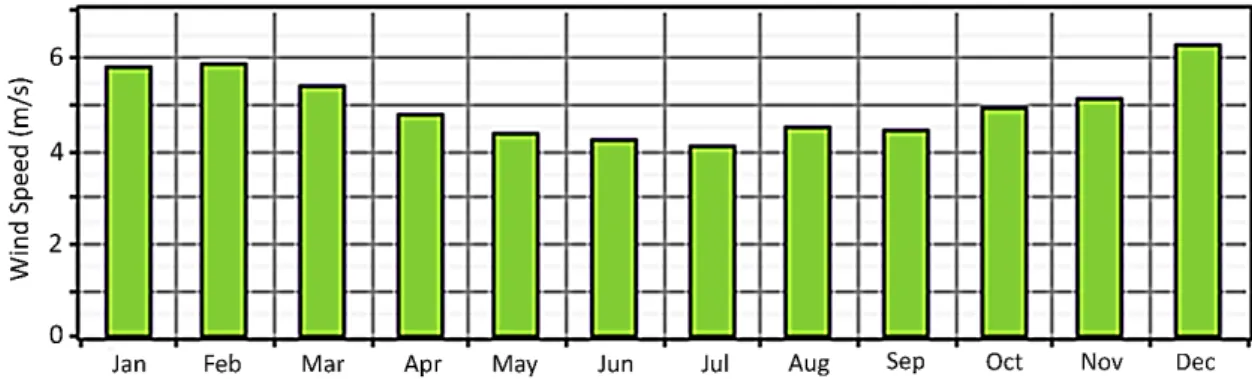
(5) Sustainability 2017, 2017, 9, 9, 82 82 Sustainability Sustainability 2017, 9, 82. of 13 13 55 of 5 of 13. Figure 3. Annual solar resource information for the main offices of Jeju Province. Based on the Figure Annual resource information for the officesoffices of Jeju of Province. Based onBased the monthly Figure 3.3.averages Annualsolar information for main the main Jeju Province. on the monthly ofsolar solarresource resources, the potentiality of PV arrays is computed. averages of solar resources, the potentiality of PV arrays is computed. monthly averages of solar resources, the potentiality of PV arrays is computed.. 2.4. Wind Resource Information 2.4. 2.4. Wind Resource Resource Information Information For information on wind resources at the main offices, this simulation uses data provided by For information on wind resources at the main this simulation uses data provided by main offices, offices, this the Koreainformation Meteorological Administration (forthe ground level) and thesimulation National Aeronautics and Space the Korea Meteorological Administration (for ground level) and the National Aeronautics and Space the Korea Meteorological Administration (for ground level) and the Aeronautics and Space Administration (for 50-m level). Note that the actual hub height ofNational the turbines is 25-m, but the Administration (for 50-m level). Note that the actual hub height of the turbines is 25-m, but the wind Administration (for 50-m level). Note that the actual hub height of the turbines is 25-m, but the wind speed data provided are only for the 50-m level [6,7,11]. Therefore, the mean of the wind speed speed data provided are only for the 50-m level [6,7,11]. Therefore, the mean ofofthe wind speed wind speed data provided are only for the 50-m level [6,7,11]. Therefore, the mean the wind speed between the ground and 50-m levels is calculated to yield the wind speed at the 25-m level (4.964 between the ground and 50-m levels is is calculated to yield the wind speed at theat25-m level (4.964 m/s). between ground 50-m levels calculated to yield wind speed 25-m level (4.964 m/s). The the annual windand speed information for the main officesthe of Jeju Province is the depicted in Figure 4. The wind wind speedspeed information for thefor main officesoffices of JejuofProvince is depicted in Figure 4. m/s).annual The annual information the main Jeju Province is depicted in Figure 4.. Figure 4. Annual wind speed information for the main offices of Jeju Province (minimum: 4.150 m/s, Figure 4. Annual wind speed information for the main offices of Jeju Province (minimum: 4.150 m/s, maximum: 6.211 m/s). Figure 4. Annual wind speed information for the main offices of Jeju Province (minimum: 4.150 m/s, maximum: 6.211 m/s). maximum: 6.211 m/s).. 3. Simulation Background 3. Simulation Background 3. Simulation Background 3.1. Annual Real Interest Rate 3.1. Annual Real Interest Rate 3.1. Annual Real Interest Rate[13], the annual real interest rate is one of the essential economic inputs As Dursun has shown As Dursun has shown [13], the annual real interest rate is one of the essential economic inputs required for accurate of thethe HOMER software. HOMER software is one of the hybrid renewable As Dursun has output shown [13], realsoftware. interest rate is one of the essential inputs required for accurate output of theannual HOMER HOMER software is oneeconomic of the hybrid systems thhat can be used to present the efficiency and feasibility of renewable electricity generation required for accurate output of the HOMER software. HOMER software is one of the hybrid renewable systems thhat can be used to present the efficiency and feasibility of renewable electricity systems forsystems remote or isolated areas. The real interest rateand is defined as “the difference between the renewable thhat can be used to annual present theannual efficiency feasibility of renewable generation systems for remote or isolated areas. The real interest rate is defined as “theelectricity difference anticipated inflation rate and the long-term nominal interest rate” [13,14]. From the calculations of previous generation systems for remoterate or isolated areas. Thenominal annualinterest real interest is defined as “the difference between the anticipated inflation and the long-term rate” rate [13,14]. From the calculations studies [6,13], this study takes 3.02% as the annual real interest rate for our simulation. between the anticipated inflation rate and the 3.02% long-term nominal interest rate” [13,14]. From the calculations of previous studies [6,13], this study takes as the annual real interest rate for our simulation. of previous studies [6,13], this study takes 3.02% as the annual real interest rate for our simulation..
(6) Sustainability 2017, 9, 82. 6 of 13. 3.2. Economic Evaluation Outputs: COE and NPC This study uses two simulation outputs as evaluation criteria for testing the feasibility of optimal configurations: COE and NPC (net present cost). COE is defined as “the mean cost of generating 1 kWh electricity from a particular configuration” [6,13,15,16], and NPC is defined as “the difference of the current worth of all cost inflows and outflows over a particular time period” [6,13,17]. In addition, the renewable fraction of the suggested configuration is assumed to be 100% if the configuration is designed for an independent electricity generation system [18]. 3.3. Other Assumptions for the Simulation From previous economic feasibility studies for electricity generation systems [2,4,6], the project lifetime is assumed to be 25 years [19]. In addition, given that the current system (grid connection) for the main offices of Jeju Province does not incur additional capital and management costs, the system fixed capital costs, as well as operation and management costs, are assumed to be zero. 3.4. Information on Cost of Components In order to propose an optimal configuration for renewable electricity generation systems for the main offices of Jeju Province, the study needs information on the cost of potential components for the configuration. Given that the current simulation configuration involves PV arrays, wind turbines, an electrical converter, and batteries as potential components, our simulation has to consider the detailed information on the cost of each component. The installation and replacement costs of PV arrays are assumed to be $1050 per kW, with an annual operation and management cost of $20 per kW. The capacity of PV arrays is believed to range from 0 to 10,000 kW in steps of 5 kW. In addition, the operational lifetime, derating factor, and ground reflectance of PV arrays are known to be 20 years, 80%, and 20%, respectively [16,20]. A generic 10-kW turbine is one of the potential components for the simulation. The capital and replacement costs of two generic wind turbines are respectively $29,000 and $25,000, and the annual operation and management cost is $400. For the turbine, the simulation assumes a 15-year lifetime, with 25 m of hub height. The capacity of the component is assumed to range from 0 to 500 turbines, in steps of two turbines [6,13]. A WES 5 Tulipo turbine is another possible component for the simulation. This turbine has a capacity of 2.5 kW AC of rated power. The capital and replacement costs of the turbines are $5000 and $4000, respectively. The operation and management cost of the turbine is assumed to be $50 per year [19]. The number of turbines simulated in this study ranges from 0 to 500, with an increment of two turbines (0, 2, 4, . . . , 500). The simulation assumes a 15-year lifetime and 25-m hub height. A Surrette 6CS25P battery is another component used in our simulation. The capital cost and replacement cost for one battery unit are $1100 and $1000, respectively [19]. The battery has a nominal voltage of 6 V, a nominal capacity of 1156 Ah and 6.94 kWh, and a lifetime throughput of 9645 kWh. The range simulated is from 0 to 10,000 batteries in steps of five batteries (0, 5, 10, . . . , 10,000). An electrical converter is essential to establishing a link between AC and DC components. The capital and replacement cost per kW is $700 each, with an annual operation and management cost of $10. The efficiency ratios of inverter and rectifier inputs are 90% and 85%, respectively [19,21]. The lifetime assumed is 15 years, with 100% capacity relative to inverter. The range simulated is from 0 to 3000 kW in steps of 5 kW (0, 5, 10, . . . , 3000). The current grid connection also has a role to play in developing an optimal configuration. Given that the main government offices of Jeju Province spent approximately $380,000 for electricity usage in 2013, the simulation applies $0.137 of the purchase and sell-back price from the grid connection. The purchase capacity is assumed to range from 0 to 30,000 kW..
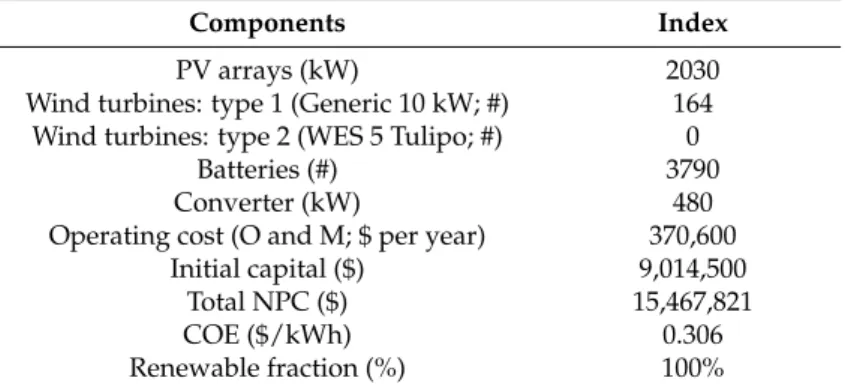
(7) Sustainability 2017, 9, 82. 7 of 13. Sustainability 2017, 9, 82. 7 of 13. 4. 4. Renewable Renewable Electricity Electricity Generation Generation System System The The current current study study proposes proposes both both an an independent independent (Section (Section 4.1), 4.1), and and aa grid-connected grid-connected renewable renewable power generation systems (Section 4.2) for government offices of Jeju Province power generation systems (Section 4.2) for government offices of Jeju Province by by utilizing utilizing local local renewable resources. Therefore, two simulation sets are conducted. renewable resources. Therefore, two simulation sets are conducted. 4.1. Simulation Result 1: An Independent Case 4.1. Simulation Result 1: An Independent Case As potential configuration for the independent renewable electricity generation system, As potential configuration for the independent renewable electricity generation system, the the simulation proposes a PV arrays-wind turbine (type 1: Generic 10 kW)-batteries-converter simulation proposes a PV arrays-wind turbine (type 1: Generic 10 kW)-batteries-converter combination. combination. The independent optimal configuration is presented in Table 3 and Figure 5. The total The independent optimal configuration is presented in Table 3 and Figure 5. The total net present cost, net present cost, annual operating cost, and COE of the configuration are $15,467,821, $370,600, annual operating cost, and COE of the configuration are $15,467,821, $370,600, and $0.306 per kWh, and $0.306 per kWh, respectively, with a 100% renewable fraction. Table 4 shows the total and annual respectively, with a 100% renewable fraction. Table 4 shows the total and annual consumed costs of consumed costs of configuration. Figure 6 summarizes the cash flow of the configuration, and Table 5 configuration. Figure 6 summarizes the cash flow of the configuration, and Table 5 provides the provides the electricity production information. The annual electricity production is summarized electricity production information. The annual electricity production is summarized in Figure 7. in Figure 7.. Figure Figure 5. 5. Overview Overview of of the the configuration configuration (an (an independent independent case). case). Table Table3.3.The Theoptimized optimized independent independent renewable renewable electricity electricity generation generation system system for for the the main main offices offices of of Jeju Province. Jeju Province.. Components Components. Index Index. PVarrays arrays (kW) PV (kW) Wind turbines:type type1 (Generic 1 (Generic 10 kW; Wind turbines: 10 kW; #) #) Wind turbines: type 2 (WES 5 Tulipo; #) Wind turbines: type 2 (WES 5 Tulipo; #) Batteries (#) Batteries (#) Converter (kW) Converter (kW) Operating cost (O and M; $ per year) OperatingInitial cost capital (O and($) M; $ per year) Total NPC ($) ($) Initial capital COE ($/kWh) Total NPC ($) Renewable fraction (%) COE ($/kWh) Renewable fraction (%). 20302030 164 164 0 0 3790 3790 480 480 370,600 370,600 9,014,500 15,467,821 9,014,500 0.306 15,467,821 100%. 0.306 100%.
(8) Sustainability 2017, 9, 82. 8 of 13. Sustainability 2017, 9, 82. 8 of 13. Table 4. Cost information of the independent case. Capital Replacement O and M Salvage Total 8 of 13 ($) ($) ($) ($) ($) PV array 2,131,500 1,180,161 706,974 –763,513 3,255,122 Capital O and M Salvage Total 4. Cost information of the Replacement independent Wind turbine: type 1Table (Generic 10 kW) 2,378,000 1,315,818 case.571,152 –326,364 3,938,606 Component ($) ($) ($) ($) ($) Wind turbine: type 2 (WES 5 Tulipo) – – – – Total Capital Replacement O and M Salvage Total – Component PVBattery array 2,131,500 1,180,161 706,974 –763,513 4,169,000 4,522,661 659,959 –1,659,283 ($)3,255,122 7,692,337 Period ($) ($) ($) ($) Wind turbine: type 1 (Generic 10 kW) 2,378,000 1,315,818 571,152 –326,364 3,938,606 Converter 336,000 215,666 83,583 –763,513 –53,492 3,255,122 581,757 PV array 2,131,500 1,180,161 706,974 Wind Wind turbine: typetype 2 (WES 5 Tulipo) – – – – – Total turbine: 2,378,000 1,315,818 571,152 3,938,606 System1 (Generic 10 kW) 9,014,500 7,234,306 2,021,668 –326,364 –2,802,651 15,467,821 Battery 4,169,000 4,522,661 659,959 –1,659,283 7,692,337 Period Total Wind turbine: type 2 (WES 5 Tulipo) – – – – – PV array 122,408 67,774 40,600 –43,847 186,935 Converter 336,000 215,666 83,583 –53,492 581,757 Battery 4,169,000 4,522,661 659,959 –1,659,283 7,692,337 Period Wind turbine: type 1 (Generic 10 kW) 136,563 75,565 32,800 –18,742 226,186 Converter 336,000 215,666 83,583 –53,492 System 9,014,500 7,234,306 2,021,668 –2,802,651 581,757 15,467,821 Wind turbine: type 2 (WES 5 Tulipo) – – – – – Annual System 9,014,500 7,234,306 2,021,668 –2,802,651 15,467,821 PVBattery array 122,408 67,774 40,600 –43,847 186,935 239,417 259,727 37,900 –95,289 441,755 Period PV array 122,408 67,774 40,600 –43,847 186,935 Wind turbine: type 1 (Generic 10 kW) 136,563 75,565 32,800 –18,742 226,186 Converter 19,296 12,385 4800 –3072 226,186 33,409 Wind turbine: type 1 (Generic 10 kW) 136,563 75,565 32,800 –18,742 Wind turbine: type 2 (WES 5 Tulipo) – – – – – Annual System 517,684 415,451 116,100 –160,950 888,285 Wind turbine: type 2 (WES 5 Tulipo) – – – – – Annual Battery 239,417 259,727 37,900 –95,289 441,755 Period Battery 239,417 259,727 37,900 –95,289 441,755 Period Converter 19,296 12,385 4800 –3072 33,409. Table 4. Sustainability 2017, 9, 82 Component. Converter. System System. Cost information of the independent case.. 19,296. 12,385. 517,684 517,684. 415,451 415,451. 4800 116,100 116,100. –3072 33,409 –160,950 888,285 888,285 –160,950. Figure 6. Cash flow summary of the independent case. Figure Cashflow flowsummary summary of case. Figure 6. 6. Cash of the theindependent independent case. Table 5. Annual electricity production and quantity of components in the independent case. Table 5. Annual electricity production and quantity of components in the independent case. Table 5. Annual electricity production and quantity of components in the independent case. Components Electricity Production(kWh)/Fraction (kWh)/Fraction Components Electricity Production (%)(%) PV arrays 2,738,148, 45% Components Electricity Production (kWh)/Fraction (%) PV arrays 2,738,148, 45% Wind turbines 3,290,134, 55% Wind turbines 3,290,134, 55% PV arrays 2,738,148, 45% Total 6,028,282, Total 6,028,282, 100% Wind turbines 3,290,134,100% 55% Quantity Value Total 6,028,282, 100% Quantity Value(kWh) (kWh) Excess electricity 2,524,625 Quantity Value (kWh) Excess electricity 2,524,625 Excess electricity 2,524,625 Unmet load 2192 Unmet load 2192 Unmetshortage load 2192 Capacity 2887 Capacity shortage 2887 Capacity shortage 2887. Figure 7. Annual electricity production of the independent case.. Figure 7. 7. Annual electricity production production of of the the independent independent case. case. Figure.
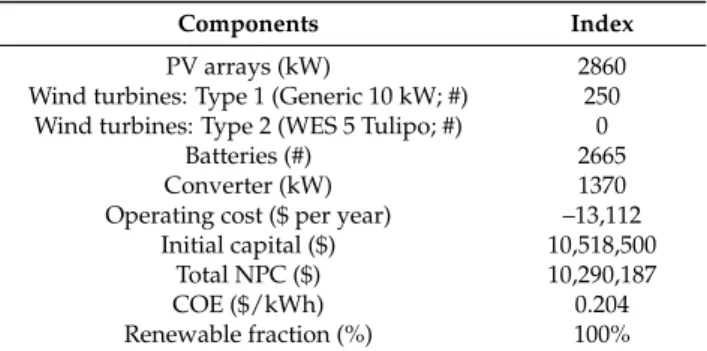
(9) Sustainability 2017, 9, 82. 9 of 13. Sustainability 2017, 9, 82. 9 of 13. 4.2. Simulation Result 2: A Grid-Connected Case 4.2. Simulation Result 2: A Grid-Connected Case. The PV arrays-wind turbine (type 1: Generic 10 kW)-batteries-converter combination is also used The PV arrays-wind turbine (type 1: Generic 10 kW)-batteries-converter combination is also for the configuration of the grid-connected renewable electricity generation system. The optimized used for the configuration of the grid-connected renewable electricity generation system. The configuration of the case is shown in Table 6 and Figure 8. The total net present cost, annual operating optimized configuration of the case is shown in Table 6 and Figure 8. The total net present cost, cost, and COE of the configuration are $10,290,188, $–13,112, and $0.204 per kWh, respectively, with annual operating cost, and COE of the configuration are $10,290,188, $–13,112, and $0.204 per kWh, a 100% renewable fraction. the grid-connected case can be beneficial in the long-term. Table 7 respectively, with a 100%Thus, renewable fraction. Thus, the grid-connected case can be beneficial in the showslong-term. the total Table and annual cost of configuration. 9 summarizes the cash flow of the 7 showsconsumed the total and annual consumed costFigure of configuration. Figure 9 summarizes configuration, while Table 8 provides theTable electricity production information. The annual electricity the cash flow of the configuration, while 8 provides the electricity production information. The annual is electricity production is summarized in Figure Moreover, Table 9 clearly shows amount that a of production summarized in Figure 10. Moreover, Table10. 9 clearly shows that a significant significant amount ofbe produced electricity can the be purchased through the grid connection. produced electricity can purchased through grid connection.. Figure 8. Overview (agrid-connected grid-connected case). Figure 8. Overviewofofthe theconfiguration configuration (a case). The optimized grid-connected renewableelectricity electricitygeneration generation system offices grid-connected renewable systemfor forthe themain main offices of TableTable 6. The6. optimized of Jeju Province. Jeju Province. Components Components PV arrays (kW) Wind turbines: Type 1 (Generic PV arrays (kW)10 kW; #) Wind turbines: 1 (Generic 10 #) kW; #) Wind turbines: TypeType 2 (WES 5 Tulipo; Wind turbines: Type Batteries (#)2 (WES 5 Tulipo; #) Batteries Converter (kW)(#) OperatingConverter cost ($ per(kW) year) Operating cost ($ per year) Initial capital ($) Initial capital ($) Total NPC ($) Total NPC ($) COECOE ($/kWh) ($/kWh) Renewable fraction (%) (%) Renewable fraction. Index Index 2860 2860250 250 0 0 2665 26651370 1370 –13,112 –13,112 10,518,500 10,518,500 10,290,187 10,290,187 0.204 0.204 100% 100%. Table 7. Cost information of the grid-connected case.. Table 7. Cost information of the grid-connected case. Component PV array Component Wind turbine: type 1 PV array Wind turbine: type 2 Total Wind turbine: Gridtype 1 Period Wind turbine: type 2 Battery Total Grid Converter Period Battery System Converter PV array System Wind turbine: type 1 Wind turbine: type 2 PV array Annual Grid PeriodWind turbine: type 1 Battery Wind turbine: type 2 Converter Annual Grid System Period. Battery Converter System. Capital ($) 3,003,000 Capital ($) 3,625,000 3,003,000 – 3,625,000 0 – 2,931,500 0 959,000 2,931,500 10,518,500 959,000 172,456 10,518,500 208,176 – 172,456 0 208,176 168,350 – 55,073 0 604,055. 168,350 55,073 604,055. Replacement ($) O and M ($) 1,662,689 996,032 Replacement ($) O and M ($) 2,005,819 870,658 1,662,689 996,032 – – 2,005,819 870,658 0 –7,369,239 – 3,180,182 464,061– 0 –7,369,239 615,546 238,560 3,180,182 464,061 7,464,236 –4,799,928 615,546 238,560 95,485 57,200 7,464,236 –4,799,928 115,190 50,000 – – 95,485 57,200 0 –423,200 115,190 50,000 182,631 26,650 – – 35,349 13,700 0 –423,200 428,655 –275,650. 182,631 35,349 428,655. 26,650 13,700 –275,650. Salvage ($) Total ($) –1,075,688 4,586,033 Salvage ($) Total ($) –497,506 6,003,971 –1,075,688 4,586,033 – – 6,003,971 0–497,506 –7,369,239 – –1,166,752 5,408,991 – –7,369,239 –152,6750 1,660,431 –1,166,752 10,290,187 5,408,991 –2,892,621 –152,675 263,367 1,660,431 –61,774 –2,892,621 344,795 10,290,187 –28,571 – – –61,774 263,367 0 –423,200 –28,571 344,795 –67,004 310,627 – – –8768 95,354 0 –423,200 –166,117 590,943. –67,004 –8768 –166,117. 310,627 95,354 590,943.
(10) Sustainability 2017, 2017, 9, 9, 82 82 Sustainability Sustainability 2017, 9, 82. 10 of of 13 13 10 10 of 13. Figure 9. 9. Cash Cash flow flow summary summary of of the the grid-connected grid-connected case. case. Figure Figure 9. Cash flow summary of the grid-connected case.. In sum, the simulation results indicate that the PV arrays-wind turbine (type 1: Generic 10 In (type 1: 1: Generic 10 In sum, sum, the the simulation simulation results resultsindicate indicatethat thatthe thePV PVarrays-wind arrays-windturbine turbine (type Generic kW)-batteries-converter combination achieves a COE of $0.306 per kWh and $0.204 per kWh for the kW)-batteries-converter combination achieves a COE ofof$0.306 10 kW)-batteries-converter combination achieves a COE $0.306per perkWh kWhand and$0.204 $0.204per perkWh kWhfor for the the independent case and grid-connected optimal renewable electricity generation systems, respectively. independent independent case case and and grid-connected grid-connected optimal optimal renewable renewable electricity electricity generation generation systems, systems, respectively. respectively. Further, the results show that the proposed configuration helps to reduce the operating cost to Further, the results resultsshow showthat thatthethe proposed configuration helps to reduce the operating to Further, the proposed configuration helps to reduce the operating cost tocost below below zero and lower the total NPC to below the initial capital cost. below zero and the lower theNPC totaltoNPC to below the capital initial capital zero and lower total below the initial cost. cost.. Figure 10. Annual electricity production production of of the the grid-connected grid-connected case. case. Figure 10. Annual electricity production of the grid-connected case. Table Table 8. 8. Annual electricity electricity production production and and quantity quantity of of components components in in the the grid-connected grid-connectedcase. case. Table 8. Annual electricity production and quantity of components in the grid-connected case.. Components Components Components PV arrays PVPV arrays arrays Wind turbines Wind turbines Wind turbines Grid purchases Grid purchases Grid purchases Total Total Total Load Load ACLoad primary load AC primary load Grid sales AC primary load Grid sales Quantity Grid sales Quantity Excess electricity Quantity Unmet load Excess electricity Excess electricity Capacity shortage Unmet load Unmet load Capacity shortage Capacity shortage. Electricity Production (kWh) and Fraction Electricity Production (kWh) andFraction Fraction Electricity Production (kWh) and 3,857,697 (43%) 3,857,697 (43%) 3,857,697 (43%) 5,015,423 (57%) 5,015,423 (57%) 5,015,423 (57%) 0 (0%) 0 (0%) 0 (0%) 8,873,120 (100%) 8,873,120 (100%) 8,873,120 (100%) Consumption (kWh per year)and andfraction fraction Consumption (kWh per year) Consumption (kWh per year) 2,898,654 (48%)and fraction 2,898,654 (48%) 3,078,084 (52%) 2,898,654 (48%) 3,078,084 (52%) Value (kWh) 3,078,084 (52%) Value (kWh) 1,985,863 Value (kWh) 2351 1,985,863 1,985,863 2893 2351 2351 2893 2893.
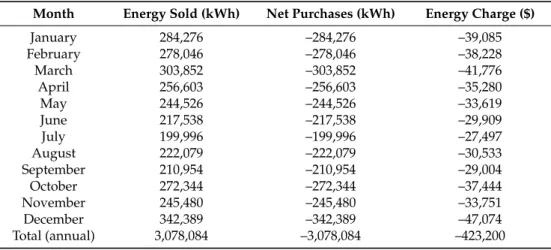
(11) Sustainability 2017, 9, 82. 11 of 13. Table 9. Amount of electricity purchased through the grid connection. Month. Energy Sold (kWh). Net Purchases (kWh). Energy Charge ($). January February March April May June July August September October November December Total (annual). 284,276 278,046 303,852 256,603 244,526 217,538 199,996 222,079 210,954 272,344 245,480 342,389 3,078,084. –284,276 –278,046 –303,852 –256,603 –244,526 –217,538 –199,996 –222,079 –210,954 –272,344 –245,480 –342,389 –3,078,084. –39,085 –38,228 –41,776 –35,280 –33,619 –29,909 –27,497 –30,533 –29,004 –37,444 –33,751 –47,074 –423,200. 5. Discussion and Conclusions The South Korean government has implemented plans and policies to reduce their dependency on fossil fuels and nuclear power and to promote the installation of renewable power generation facilities [22]. Thus, the local governments and research institutes also focused on the wide dissemination and efficient management of renewable electricity generation systems in their offices [23,24]. Jeju Island is one of the most promising regions for utilizing renewable resources [25–27]. Accordingly, this study conducts simulations to propose both independent and grid-connected installations at the main government offices of Jeju Province, with NPC and COE as evaluation guidelines of the simulations, to further enhance the island’s energy efficiency. Overall, our simulation results provide a more enhanced and detailed understanding of the possible strategies for planning electricity consumption in buildings for South Korea. Moreover, the office annually emits about 190,000 kg of carbon dioxide, 800 kg of sulfur dioxide, and 400 kg of nitrogen oxides. These emissions can be eliminated when the suggested systems are employed. Our finding that the grid-connected installation is more efficient than the independent case may be explained in two ways: first, grid connection helps in reducing the initial investments on components. For example, the grid connection can be used as backup storage, thereby reducing the costs on batteries; and second, the operation and management costs of the proposed configurations can be minimized by selling the generated electricity through the existing grid connection. Although the grid connection cannot fully play the role of energy buffer in the system, it can reduce the usage of battery units by using the suggested system. It also reduces the initial capital costs, thereby offering greater flexibility and benefit from installing and operating PV arrays and wind turbines than the independent case. As the simulation results show, both the cases require a significant amount of initial capital cost. However, the results demonstrate the economic feasibility of renewable electricity generation systems for meeting the electricity demand of Jeju Province. The following points can be useful.. • • •. In order to utilize the grid connection, strategic plans for the gradual installation of renewable electricity generation systems should be established and implemented. Dependence on the current grid connection should be gradually reduced. The current grid connection should be used for selling the electricity generated using the renewable electricity generation facilities.. However, this study has several shortcomings. First, the local and national supporting plans and policies implemented in South Korea were not considered in the simulation. These are notable plans for promoting the installation and implementation of renewable electricity generation facilities in South Korea. Previous studies have found that such plans are significantly related to the diffusion of facilities [2,26,27]. Second, given that the simulation results are mathematically calculated, alternative.
(12) Sustainability 2017, 9, 82. 12 of 13. configurations involving unexpected factors may significantly affect the results. Third, significantly large investments are required for installing and operating the entire components suggested in the proposed configurations [28]. For example, more than 49% of the total and annual period costs are needed to fully install and operate the suggested capacity of batteries (52.6% in grid-connected and 49.7% in independent cases). Fourth, this study examines only the two wind turbine and PV array models currently used in Jeju Province and neglects other possible energy generation components, such as biomass or geo-thermal energy production facilities. Future studies should address these shortcomings in order to provide more specific guidelines for government and institutional buildings in South Korea. Acknowledgments: This study was supported by the Dongguk University Research Fund of 2015. Support for the UJI Robotic Intelligence Laboratory is provided in part by Ministerio de Economía y Competitividad (DPI2015-69041-R), by Generalitat Valenciana (PROMETEOII/2014/028) and by Universitat Jaume I (P1-1B2014-52). Author Contributions: E.P. conducted the investigations and mainly wrote the manuscript. T.H., K.J.K., S.J.K., W.S.N., and A.P.d.P. revised the manuscript and contributed to data presentation. Conflicts of Interest: The authors declare no conflict of interest.. References 1.. 2. 3. 4.. 5.. 6.. 7. 8. 9.. 10. 11. 12. 13. 14.. Korea Ministry of Government Legislation. The Act on The Promotion of the Development, Use and Diffusion of New and Renewable Energy. Available online: http://www.law.go.kr/lsInfoP.do?lsiSeq=150378#0000 (accessed on 4 May 2016). Huh, S.Y.; Lee, J.; Shin, J. The economic value of South Korea’s renewable energy policies (RPS, RFS, and RHO): A contingent valuation study. Renew. Sustain. Energy Rev. 2015, 50, 64–72. [CrossRef] Han, S.; Shin, H.W. Policy trends of renewable energy in Korea. In Proceedings of the 2014 International Conference on Renewable Energy Research and Application, Milwaukee, WI, USA, 19–22 October 2014. Chen, W.M.; Kim, H.; Yamaguchi, H. Renewable energy in eastern Asia: Renewable energy policy review and comparative SWOT analysis for promoting renewable energy in Japan, South Korea, and Taiwan. Energy Policy 2014, 74, 319–329. [CrossRef] The Ministry of Trade, Industry and Energy in South Korea. The Fourth Renewable Energy Plan in Korea. Available online: http://motie.go.kr/common/download.do?fid=bbs&bbs_cd_n=16&bbs_seq_n=79321& file_seq_n=346 (accessed on 4 May 2016). Yoo, K.; Park, E.; Kim, H.; Ohm, J.Y.; Yang, T.; Kim, K.J.; Chang, H.J.; del Pobil, A.P. Optimized renewable and sustainable electricity generation systems for Ulleungdo island in South Korea. Sustainability 2014, 6, 7883–7893. [CrossRef] Bae, K.; Shim, J.H. Economic and environmental analysis of a wind-hybrid power system with desalination in Hong-do, South Korea. Int. J. Precis. Eng. Manuf. 2012, 13, 623–630. [CrossRef] Choi, H.J.; Han, G.D.; Min, J.Y.; Bae, K.; Shim, J.H. Economic feasibility of a PV system for grid-connected semiconductor facilities in South Korea. Int. J. Precis. Eng. Manuf. 2013, 14, 2033–2041. [CrossRef] Jeju Special Self-Governing Province. Jejudo-LG, Cooperation for New & Renewable Energy Industry: Global Eco Platform Jeju. Available online: https://www.jeju.go.kr/news/bodo/list.htm;jsessionid= 3OVghpPTNGwXJM54umkuXcPeW0KvMQAxTViB2ZAJpzNJJZPWQMf1ID3nm0MrjuaB.was1_servlet_ engine1?page=272&act=download&seq=489938&no=1 (accessed on 19 September 2016). Jeju Special Self-Governing Province. Carbon Free Island Jeju by 2030. Available online: http://www.ksga. org/down/down.asp?file=Carbon%20Free%20Island%20Jeju%20by%202030.pdf (accessed on 4 May 2016). Ahmed, M.A.; Kang, Y.C.; Kim, Y.C. Modeling and simulation of communication networks for use in integrating high wind power generation into a power grid. J. Renew. Sustain. Energy 2015, 7. [CrossRef] Yang, J. News Jeju Focus. Available online: http://m.newsjeju.net/news/articleView.html?idxno=184496 (accessed on 4 May 2016). Dursun, B. Determination of the optimum hybrid renewable power generating systems for Kavakli campus of Kirklareli University, Turkey. Renew. Sustain. Energy Rev. 2012, 16, 6183–6190. [CrossRef] Yoshino, N.; Taghizadeh-Hesary, F. Effectiveness of the easing of monetary policy in the Japanese economy, incorporating energy prices. J. Comp. Asian Dev. 2015, 14, 227–248. [CrossRef].
(13) Sustainability 2017, 9, 82. 15. 16. 17. 18. 19. 20.. 21. 22. 23. 24. 25. 26.. 27. 28.. 13 of 13. Justiniano, A.; Primiceri, G.E. Measuring the equilibrium real interest rate. Econ. Perspect. 2010, 34, 14–27. Das, H.S.; Yatim, A.H.M.; Tan, C.W.; Lau, K.Y. Proposition of a PV/tidal powered micro-hydro and diesel hybrid system: A southern Bangladesh focus. Renew. Sustain. Energy Rev. 2016, 53, 1137–1148. [CrossRef] Park, E.; Yoo, K.; Ohm, J.Y.; Kwon, S.J. Case study: Renewable electricity generation systems on Geoje Island in South Korea. J. Renew. Sustain. Energy 2016, 8. [CrossRef] Park, E.; Kwon, S.J. Towards a Sustainable Island: Independent optimal renewable power generation systems at Gadeokdo Island in South Korea. Sustain. Cities Soc. 2016, 23, 114–118. [CrossRef] Park, E.; Kwon, S.J. Renewable electricity generation systems for electric-powered taxis: The case of Daejeon metropolitan city. Renew. Sustain. Energy Rev. 2016, 58, 1466–1474. [CrossRef] Li, C.; Ge, X.; Zheng, Y.; Xu, C.; Ren, Y.; Song, C.; Yang, C. Techno-economic feasibility study of autonomous hybrid wind/PV/battery power system for a household in Urumqi, China. Energy 2013, 55, 263–272. [CrossRef] Chung, M.H.; Rhee, E.K. Potential opportunities for energy conservation in existing buildings on university campus: A field survey in Korea. Energy. Build. 2014, 78, 176–182. [CrossRef] Ahn, J.; Woo, J.; Lee, J. Optimal allocation of energy sources for sustainable development in South Korea: Focus on the electric power generation industry. Energy Policy 2015, 78, 78–90. [CrossRef] Ku, S.J.; Yoo, S.H. Willingness to pay for renewable energy investment in Korea: A choice experiment study. Renew. Sustain. Energy Rev. 2010, 14, 2196–2201. [CrossRef] Oh, S.D.; Yoo, Y.; Song, J.; Song, S.J.; Jang, H.N.; Kim, K.; Kwak, H.Y. A cost-effective method for integration of new and renewable energy systems in public buildings in Korea. Energy Build. 2014, 74, 120–131. [CrossRef] Park, Y.C.; Kim, D.S.; Huh, J.; Kim, Y.G. New and renewable energy policies of Jeju island in Korea. In Proceedings of the World Renewable Energy Congress, Linköping, Sweden, 8–13 May 2011. Lee, J.; Kim, S.B.; Park, G.L.; Park, C.J. Monitoring-based temporal prediction of power entities in smart grid cities. In Proceedings of the 2012 ACM Research in Applied Computation Symposium, New York, NY, USA, 23–26 October 2012. Kim, H.C.; Lim, D.S. A study on the economic effects of new/renewable energy industry of Jeju: The case of photovoltaic and wind-power of Jeju. Tamla Munhwa 2014, 47, 299–324. Park, E.; Kwon, S.J. Solutions for optimizing renewable power generation systems at Kyung-Hee University’s Global Campus, South Korea. Renew. Sustain. Energy Rev. 2016, 58, 439–449. [CrossRef] © 2017 by the authors; licensee MDPI, Basel, Switzerland. This article is an open access article distributed under the terms and conditions of the Creative Commons Attribution (CC-BY) license (http://creativecommons.org/licenses/by/4.0/)..
(14)
Figure

![Table 2. The inputted parameters and outcomes generally generated by the HOMER software [11].](https://thumb-us.123doks.com/thumbv2/123dok_es/3351824.605094/3.1262.153.1135.165.366/table-inputted-parameters-outcomes-generally-generated-homer-software.webp)
+3
Documento similar
• Frequency response and inertia analysis in power systems with high wind energy integration en International Conference on Clean Electrical Power Renewable Energy Resources Impact
These base stations were powered with renewable energy sources (wind, solar and geother- mal) and, in addition, equipped with batteries as well as connected to the traditional
The future of renewable energies for the integration into the world`s energy production is highly dependent on the development of efficient energy storage
Therefore, the current study introduces the optimal configuration of renewable energy generation systems for Chiang Mai University, which is one of the largest public universities
Given the much higher efficiencies for solar H 2 -generation from water achieved at tandem PEC/PV devices ( > 10% solar-to-H 2 energy efficiency under simulated sunlight) compared
In this paper we identify the renewable energy source (RES) demand scenarios for Morocco, the needs of RES installed capacity according to those scenarios and
In this paper, the effects of economic growth and four different types of energy consumption (oil, natural gas, hydroelectric- ity, and renewable energy) on environmental quality
The main aims of this work were to (i) analyse the heat consumption in the low-cost plastic greenhouses of south-eastern Spain and (ii) propose a simple model for estimating the
