Can trust effects on development be generalized? A response by quantile
30
0
0
Texto completo
(2) Can trust effects on development be generalized? A response by quantile Jesús Peiró-Palominoa and Emili Tortosa-Ausina∗ a,b a Department of Economics, Universitat Jaume I, Campus del Riu Sec, 12071 Castelló de la Plana, Spain b Instituto Valenciano de Investigaciones Económicas (Ivie), C/Guàrdia Civil 22, 46020 València, Spain. Abstract While the beneficial effects of social trust on economic performance have been largely recognized, we analyze whether these effects can be generalized for economies at different stages of economic development. Contrary to previous studies on this issue based on average effects (mostly considering ordinary least squares estimations), we follow a quantile regression approach that enables us to capture heterogeneous effects of trust for different development levels. By considering data for 80 countries, and using trust indicators from five different waves of the World Values Survey (WVS), our results by quantile indicate that trust is not relevant for the poorest economies, showing the existence of a social poverty trap. In addition, results suggest that the impact of trust on income decreases as an economy becomes richer. This would suggest not only that trust benefits cannot be generalized for all countries, as some previous studies have proposed, but also that the extent of its implications are heavily dependent on the level of development.. JEL classification: A13; Z13 Keywords: GDP per capita; quantile regression; trust. ∗ Corresponding author. Tel.:+34 964387168 E-mail address: tortosa@uji.es.
(3) 1.. Introduction. One of the most successful theories explaining the determinants of economic growth in relatively recent times is that considering the influence of social capital. In this field of research, scholars have attempted to ascertain whether the level of social capital in a given country or region is a key driver for economic development, among other related questions. Many studies were triggered by the findings of Putnam (1993), whose pioneering study concluded that social capital was a relevant determinant of the economic disparities across Italian regions. Following in Putnam’s footsteps, contributions such as Knack and Keefer (1997), Zak and Knack (2001) or Beugelsdijk and Van Schaik (2005), and more recently, Dearmon and Grier (2009), Doh and McNeely (2011) or Horvath (2012), among others, have highlighted positive effects flowing from social capital to economic development, using different samples of countries or regions, and different time periods. These widely accepted effects are not free from controversy, however, because the social capital definitions used differ from one study to another. Social capital is a multifaceted concept (Bjørnskov, 2006) and includes trust, networks and associationism, as well as social norms. Therefore, the selection of an appropriate proxy for social capital becomes essential. In this study, we select the level of trust, since it is the most widely used indicator in this context. In addition, the trust indicator has been proved to be a reliable measure of honesty, generalized trust and trustworthiness, as shown in Knack and Keefer (1997) and Uslaner (2002). Finally, although we could have included several social capital indicators, an indepth study should focus on just one aspect of social capital (Yamamura, 2012). Although academic progress in the field of research of trust and economic development is already substantial, more evidence is needed on some particular fronts. One of these fronts on which no consensus has yet been reached relates to determining whether trust effects are stronger in poor in rich countries. This argument has become one of the most challenging issues in trust studies. This is highlighted by Knack and Keefer (1997), who included in their regression the interaction term trust×initial income, finding a negative coefficient, which implies that the effects might be stronger for poorer economies. Other authors have followed different strategies. For instance, Dearmon and Grier (2009), split their sample into two sub-samples based on the 25 (poorest) and 75 (richest) percentiles, carrying out Chow tests which showed no differential impacts. Ahlerup et al. (2009), controlling for the institutional environment, conclude that trust is more essential for the poorest economies, since these are characterized by weaker institutions and then 1.
(4) interpersonal trust plays a major role. However, Putnam (1993, p.178), held the opposite opinion and argued—referring to social capital in a broader sense—that “the importance of social capital increases as development proceeds. This may help explain why the gap between the civic North and the uncivic South of Italy has widened over the last century”. Whatever the case, this discussion evidences scholars’ interest in highlighting non-linearities on the impact of trust. Previous evidence on this issue is, however, based on average effects, mainly using ordinary least squares (OLS). Yet that approach, which generalizes the effect of trust on economic performance, suffers some limitations. On the one hand, in the large samples of countries on which studies are based, outlying observations are common. That may yield estimated coefficients heavily affected by these outliers, and therefore biased. Beugelsdijk et al. (2004) reported evidence suggesting that the robustness of the positive impact of trust is heavily affected by sample selection.1 On the other hand, even when outliers are identified and controlled for, trust may be affecting economic development with varying intensity depending on the country’s stage of development. Another likely scenario is that trust is relevant for some countries within a certain range of economic development, while for others its effects are not important at all. The present contribution attempts to provide a response to these issues by using quantile regression, a methodology initially developed by Koenker and Bassett (1978). This technique, increasingly popular in the field of economic growth, as evidenced in recent studies by Mello and Perrelli (2003), Barreto and Hughes (2004) or Crespo-Cuaresma et al. (2011) (among others), enables us to quantify the different magnitudes of the effect of the covariates on the entire distribution of the variable of interest, in our case, the level of income. Different results by quantile would be suggesting heterogeneous effects of trust for different degrees of economic development, an unresolved question as argued in the preceding paragraphs. Additionally, as we will see later in the paper, quantile regression has other powerful advantages that are especially useful in this particular context. These include its efficiency when dealing with non-normal dependent variables, and when the analyst faces the difficulty of taking into account the whole set of variables that may be affecting economic performance. 1 The authors evaluate the robustness of Knack and Keefer’s (1997) and Zak and Knack’s (2001) results. They conclude that the inclusion of additional countries in the sample in Zak and Knack (2001), in particular countries with low-trust levels, substantially increases the robustness of the findings—i.e. trust positively impacts economic growth.. 2.
(5) In addition, previous studies on this issue are based on data provided by a single wave of the World Values Survey (WVS)2 , with a few exceptions such as Ahlerup et al. (2009) and Dearmon and Grier (2009, 2011), who considered several waves. Our study is based on the latter contribution, but substantially enlarges their sample by also considering data from the most recent WVS wave (2005-2007). Therefore, the contribution of the paper to the literature is twofold. First, it is innovative in both the sample considered—it is one of the largest in this context; and in the time span studied—it is to our knowledge one of the few considering the most recent wave from the WVS. Second, we use quantile regression to study the likely existence of heterogeneous effects between rich and poor countries. This twofold analysis might shed additional light on the true behavioral pattern showed by trust. The paper is organized as follows. In Section 2 the causal links from trust to income are detailed. Section 3 is devoted to some insights on the quantile regression approach used in the paper. In Section 4 we present both the models to be estimated and the data, along with some descriptive statistics. Section 5 analyzes the results and, finally, Section 6 provides some concluding remarks.. 2.. The links between trust and economic development. A large number of studies have evaluated the influence of trust on economic performance, as well as the transmission mechanisms of its influence, especially since the late nineties. The first insights, however, were introduced some years previously in sociological studies such as those by Arrow (1972) and Sen (1977), who held that the existence of trust in society plays an important role in the operation of the systems and that societies need some norms and rules of conduct to be viable. The mechanisms trough which trust may affect economic development are multilateral—i.e. they follow multiple paths. In practical terms, however, this seriously complicates the task of isolating the different channels through which trust may affect economic development. The central point of the trust theory is the reduction of the transaction costs into economic operations. Putnam (1993) and Whiteley (2000) put forth that trust facilitates coordination and cooperation for mutual benefit, as well as solving problems of collective action and reducing the incentives for opportunism and egoism. In the same line, Knack and Keefer (1997) argued that trust reduces the cost of monitoring possible free riding 2 See. http://www.worldvaluessurvey.org.. 3.
(6) behavior. Whiteley (2000) suggested that low-trust societies are characterized by strong regulations and bureaucratic procurements that impose costs and reduce efficiency. A sufficiently high stock of trust, therefore, might facilitate and lubricate complex transactions and improve their efficiency (Putnam, 1993), saving operational costs and, ultimately, enhancing economic output (Knack and Keefer, 1997). As Durlauf and Fafchamps (2005) noted, this might occur as a result of an increase in information flows, groups, flexibility and coordinated actions. A similar argument is put forward by Dearmon and Grier (2009), who concluded that trust mitigates information asymmetries between negotiating parties, and it may facilitate contracts and agreements. Other authors, such as Ahlerup et al. (2009), related the role of trust to that of the institutions. They concluded that the potential effects of trust emerge in societies with weak institutions. Since the institutional framework in these societies cannot guarantee security in economic transactions, then trust plays an essential role. In countries with stronger and more reliable institutional frameworks, trust is not so relevant. Therefore, trust and institutions may be treated as substitutes. For Beugelsdijk and Van Schaik (2005), however, trust is indispensable for economic development even in the presence of well-functioning institutions since, they argue, despite having the appropriate institutional setting, some transactions would be almost impossible in the absence of trust. Recently, Bjørnskov and Méon (2013) suggested that trust positively affects institutional quality, and that translates into positive effects on income. A variety of other activities, which at the same time positively impacts economic performance, might be influenced by trust—i.e. they would be indirect transmission channels. One of these activities is investment, as put forward by Knack and Keefer (1997), Zak and Knack (2001), Dearmon and Grier (2011) or Bjørnskov (2012), to name some of the most relevant contributions. Human capital is also one of these activities. Bjørnskov(2009; 2012) as well as Dearmon and Grier (2011) concluded that trust influences schooling and that in high-trust economies human capital might be more easily transmitted. Another activity positively influenced by trust is technological innovation. Akçomak and Ter Weel (2009) concluded that trust affects growth by fostering innovation for a sample of 102 European regions, while Miguélez et al. (2011) found analogous results in the context of the Spanish regions. Trust might also foster participation in the credit market and financial development, as held by Guiso et al. (2004). For a sample of Italian regions these authors found that in areas where trust is high, households invest more in stock, use more checks, have higher. 4.
(7) access to institutional credit, and make less use of informal credit. Guiso et al. (2009) found that trust is also essential for trade, especially when the products are complex. Finally, Knack (2002) and Bjørnskov (2012) documented a positive influence from trust to better governance. Trust effects, both in the way they reduce transaction costs and through impacts on the above-mentioned activities, tend to be self-reinforcing and cumulative (Putnam, 1993), involving economies in a difficult-to-reverse virtuous circle of high—or low—trust stock. Despite the controversy generated on the true causality direction of these effects—i.e. likely endogeneity of trust, causality running from economic development to trust is not plausible. This has been corroborated by Uslaner (2008), Algan and Cahuc (2010) and Nunn and Wantchekon (2011), who point out the heritability of trust across generations. More recently, Bjørnskov and Méon (2013) concluded that the stability of trust since the World War II corroborates its exogeneity, in the sense that the changing income levels over time are difficult to reconcile with the stability of trust. Whereas the consensus on the causality direction from trust to development is relatively wide, the likely existence of heterogeneous effects of trust depending on the level of development is not so well clarified. Following Knack and Keefer (1997) and Ahlerup et al. (2009),3 trust might be a substitute of the legal framework in the poorest economies. However, for other authors such as North (1990), trust would be more relevant for the richer countries, where the nature of the transactions becomes more complex and the returns from free-riding behaviors increase as well. Regardless of the particular case, the use of quantile regression might provide some evidence on this issue.. 3.. A brief outline of quantile regression methods. Quantile regression (QR) was initially developed by Koenker and Bassett (1978), although applications in the economic growth literature are relatively recent, mainly appearing in the last ten years. The numerous advantages provided by this technique have led to an increase in the number of contributions, including Mello and Perrelli (2003), Barreto and Hughes (2004), Osborne (2006) and Crespo-Cuaresma et al. (2011), among others, as commented on in the introduction. In the specific context of trust, applications are yet to come, and previous results have generally been reached by using the standard Ordinary Least Squares (OLS) estimations, which contribute to explain average effects on the variable of interest. 3 See. also Boix and Posner (1998).. 5.
(8) Although OLS provide a useful framework to start from, their use in this particular context can be troublesome for several reasons. For instance, the economic growth literature uses samples made up of very heterogeneous countries or regions, with large disparities in terms of income levels. The same practice is followed in the specific case of measuring trust effects on development, where the generalization of trust impacts based on average effects is common practice.4 In such a situation, with heavy-tailed distributions of the dependent variable, and thus favoring the existence of outliers, mean effects provided by OLS may be actually driven by these extreme observations. Furthermore, focusing only on the central tendency of the variable of interest (trust in our case) may be obscuring important information about its effects on other points of the distribution of the dependent variable (Maloney et al., 2004). In this sense, some authors such as Putnam (1993), Knack and Keefer (1997), or Dearmon and Grier (2009), to name a few, have previously been interested in disentangling such an important matter, but to date there is no widespread consensus. In an attempt to provide an accurate response to the previous unresolved issues, we use quantile regression, which provides results not only on the average effect. Rather, it enables us to draw conclusions as to how the covariates impact on the entire distribution of the response variable. To this end, different quantiles (τ) are selected (for instance, selecting quantile τ = 0.5 would refer to median regression, analogously to OLS when referring to average regression) and, therefore, different slopes are estimated for the different quantiles, highlighting the existence of heterogeneous effects and non-linearities. Following Koenker and Bassett (1978), each β parameter is estimated by minimizing the absolute sum of the residuals—not the squared sum as in OLS. It is expressed as follows: min Q( β q ) =. N. N. ∑. τ |yi − x ′i β τ | +. ∑. (1 − τ )|yi − x′i β τ |. (1). i:yi < x ′i β. i:yi > x ′i β. where τ, which lies within the [0, 1] interval, represents a specific quantile. The above function is not differentiable and therefore it cannot be optimized with the classical gradient methods. A linear programming problem is solved instead.5 Each esti4 There are a few exceptions, like Beugelsdijk and Van Schaik (2005), who used a homogeneous sample of European regions. However, their choice was not based on avoiding large disparities in growth rates, but rather on the attempt to reduce to the minimum differences on how social capital is understood in the different regions. Nevertheless, Freitag and Bauer (2013) recently conclude that the WVS question about trusting others is similarly understood in culturally different countries, which would imply that the meaning of trust is relatively universal. 5 Further theoretical explanations on quantile regression fall outside the scope of this paper. Koenker (2005), provides an excellent discussion on the advanced statistical details concerning this technique.. 6.
(9) mated β̂ τ is asymptotically distributed as N → (0, Ωτ ), where Ωτ is the variance convariance matrix of β̂ τ for a given τ. The algorithm used to compute the fit is that proposed by Barrodale and Roberts (1974), explained in detail in Koenker and d’Orey (1987). Following Koenker (1994), we compute confidence bands by implementing the rank method, suitable for samples with fewer that 1,000 observations, which is precisely our case. However, Koenker and Hallock (2001, p.15) suggested that “the discrepancies among competing methods are slight, and inference for quantile regression is more robust than for most other forms of inference commonly encountered in econometrics.” Among the advantages of quantile regression is its semi-parametric nature, in the sense that assumptions about the distribution of regression errors are avoided—i.e. it is more robust under heteroscedasticity (Cameron and Trivedi 2009, p.211). Another advantage, underlined by Coad and Rao (2008), is the robustness of the quantile estimator under nonnormal distributions of the response variable, whilst the OLS estimator loses efficiency in the same circumstances. As we note on in the next section, the distribution of the dependent variable employed in the present study depart from the Gaussian distribution (the reader might take a preliminary look at Figure 1). Therefore, the use of the quantile estimator may give a more accurate result. Additionally, Durlauf (2002) claimed that studies measuring trust effects are based on models where the number of control variables included, together with trust, is insufficient, leading to omitted variable biases.6 As a result, it may cause an imprecise predictive relationship between the mean of the dependent variable distribution and the measured covariates. In such a case, quantile regression may generate useful predictive relationships with other parts of the response variable distribution (Cade and Noon, 2003). Following the latter authors, quantile regression is especially useful when there is more than one single factor affecting the response variable, and not all factors are measured, and also when the factors show heterogeneous effects. Therefore, in our context, quantile regression might provide useful insights in determining whether the effect of trust on development is linked to the degree of development of the country or, on the contrary, differences turn out not to be remarkable. 6 As we explain in Section 4, the trust literature generally uses a variant of the neoclassical growth model, and control variables differ from one paper to another. Nevertheless, this is common practice in the entire economic growth literature and, although it is true that recent contributions are evaluating the effects on growth of larger sets of covariates, no consensus as to which model offers the best fit has yet been reached.. 7.
(10) 4.. Model, data and descriptive statistics. 4.1.. Model. In the particular context of economic growth, there is a relatively large number of models that differ according to the covariates they include. Brock and Durlauf (2001) referred to this fact as theory-openendedness in the sense that, whereas a lot of theories and models may be explaining economic growth, no one specific theory is more powerful than the others (Henderson et al., 2011). Bearing in mind the above arguments, we adopt a version of the widely-accepted neoclassical growth model developed by Mankiw et al. (1992), but expanded by including trust. This strategy will ease comparison with previous findings in the literature on trust and growth, which has traditionally relied on the neoclassical growth model. However, while in the great majority of studies the dependent variable of the model is growth rates, in our case, since our aim is to evaluate the likely existence of differential impacts of trust depending on the level of development of the country, the response variable will be income levels. Neoclassical models in levels are relatively scarcer, but not completely unheard of. For instance, Mankiw et al. (1992) themselves, proposed a version of their model in levels. Osborne (2006) conducted his study by using both the growth rates and income levels versions of the neoclassical model. He suggested that while growth rates measure differences between slow- and fast-growing countries, income levels measure differences between poor and rich countries. Therefore, the version in levels of the model is a more appropriate strategy to deal with our research question. In the particular context of trust and development and closer to our research, Dearmon and Grier (2009) and Bjørnskov and Méon (2013) also based their analysis on models in levels. Therefore, following the above contributions, the dependent variable of the model to be estimated is GDPPC—i.e the level of income per capita (in logs). In order to capture the effects of trust and studying its robustness across different model specifications, we construct four models where TRUST—i.e. the trust indicator,7 is always considered as a fixed regressor and other control variables commonly considered by the growth literature are included sequentially. In particular, Model 1 only includes as regressors an intercept and TRUST. Model 2 incorporates the Solow variables, 7 Detailed. 8. including. information on how this variable is constructed is given in Section 4.2. Solow (1957) and Henderson et al. (2011) for an example of the use of this label for referring to the baseline variables of the neoclassical growth model. Note that when the model is expressed in levels the 8 See. 8.
(11) GWORK, corresponding to the growth of the working population plus a fixed coefficient equal to 0.059 ; IGDP, which is the rate of investment as a percentage of GDP; and HK, measuring the share of working population with secondary education. Additional controls are added in Model 3. These include OPENNESS, which is the degree of trade openness (share of GDP) of the country; POLITY, which is a synthetic indicator of the democratic degree of political institutions; ETHN IC, which captures the degree of ethnic fractionalization; and AFRICA, a binary variable equal to 1 for African countries and 0 otherwise. Finally, Model 4, the most comprehensive model, adds temporal controls, tw , to Model 3. Following the recommendation of Dearmon and Grier (2009), fixed effects by country are not included because, as in their case, only one observation is available for some of the countries—our database is actually constructed by pooling all the data, as it will be shown in Section 4.2. Data are aggregated in the periods for which information on TRUST is available. Therefore, the full model (corresponding to Model 4) to be estimated corresponds to the following expression: GDPPCw = β0 + β 1 TRUSTw + β 2 GWORKw + β 3 IGDPw + β 4 HKw + β 5 OPENNESSw. + β6 POLITYw + β7 ETHN ICw + β8 AFRICA + β9 tw + ε w (2) where the subindex w represents the time period. 4.2.. Data and descriptive statistics. Data on trust are available in the World Values Survey (WVS). We take data from five different waves corresponding to the periods 1981–1984, 1989–1993, 1994–1998, 1999–2004 and 2005–2007. Trust is measured from responses to the following question: “Generally speaking, would you say that most people can be trusted, or that you cannot be too careful in dealing with people?”. Two possible answers are provided, namely: (i) “most people can be trusted”; and (ii) “can’t be too careful”. An index of trust is then constructed from the percentage of respondents who answered “most people can be trusted”. The rest of the control variables come from different databases: the Penn World Tables (PWT 6.3),10 the Barro-Lee education variable controlling for the initial level of income is omitted (see the version in levels of the model in Mankiw et al. (1992) and Osborne (2006)). 9 Following Mankiw et al. (1992), this fixed coefficient represents technological advance and depreciation. 10 See http://pwt.econ.upenn.edu/.. 9.
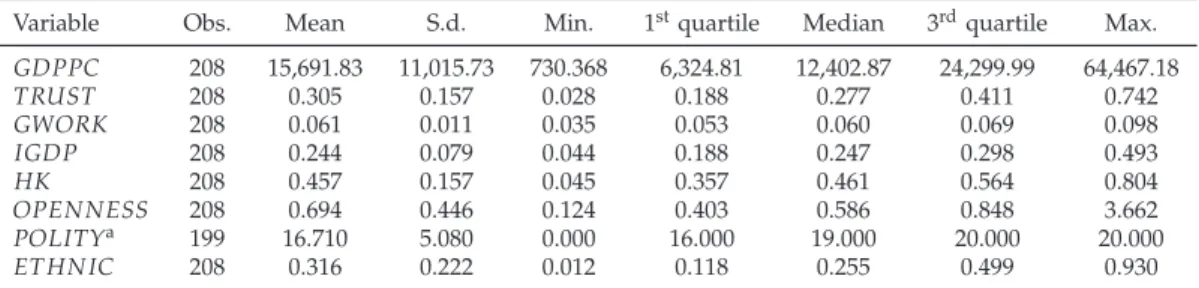
(12) database (BL),11 the World Development Indicators (WDI),12 the Polity IV database,13 and the Quality of Government database.14 A full description of the variables and their sources is available in Table 2. When studying economic growth over long periods, as in our case, data are generally aggregated in subperiods of four or five years, as suggested by Islam (1995). Nevertheless, whereas the PTW, the WDI, the Polity IV and the Quality of Government databases all provide yearly data and BL every five years, which would allow us to follow that strategy, WVS only provides data for the periods detailed above. Therefore, we aggregate the data for these five subperiods, following Dearmon and Grier (2009), although their study does not include the latest WVS wave. One drawback with the WVS data concerns the different number of countries for which data are available in each wave. For example, the first wave (1981–1984) offers only data for only 19 countries, whereas the most recent wave (2005–2007) provides information for 49 countries. For this reason some countries have five observations, whilst for others only one is available. We take the maximum number of observations, after merging the WVS data with the rest of the databases. In some cases, although data on trust are available, data for the rest of covariates are not. This merger yields 80 countries and 208 pooled observations (see Table 1). Hence, we expand Dearmon and Grier’s (2009) sample with 89 additional observations. Other samples in this context are considerably smaller; for instance, Knack and Keefer (1997) (29 countries), Whiteley (2000) (34 countries) or Beugelsdijk and Van Schaik (2005) (54 regions). To our knowledge, our sample is the largest to date in the literature analyzing the effects of trust on economic development. Some descriptive statistics are provided in Table 3, which shows important disparities. Focusing on our variable of interest—i.e. TRUST—the comparison between its maximum value, 74%, and its minimum, 2.8%, shows how significant the differences really are. However, such notable disparities are not exclusively confined to TRUST; the other variables under study also present remarkable differences, as can be seen from Table 3. Figure 1 shows the density estimated via kernel smoothing of the dependent variable, GDPPC (in logs). As briefly introduced in Section 3, the density deviates from the Gaussian distribution. Barro and Sala-i-Martin (1995) and Mello and Perrelli (2003) argued that 11 See. http://www.barrolee.com/data/dataexp.htm. http://www.worldbank.org/. 13 See http://www.systemicpeace.org/polity/polity4.htm/. 14 See Teorell et al. (2011). 12 See. 10.
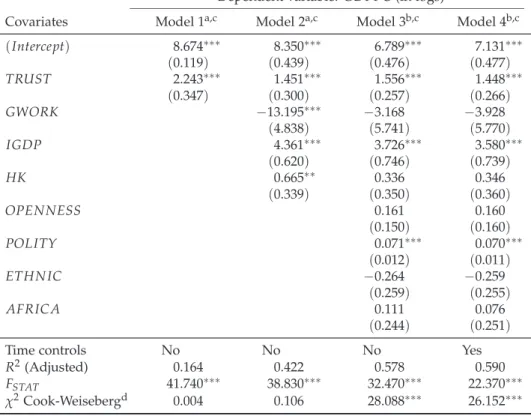
(13) distributions of the average GDP per capita are usually strongly skewed. In our case, as shown in Figure 1, the distribution presents long tails, deviating from normality.15 Therefore, the use of quantile regression might be appropriate in this context, since we estimate the effects of trust for a sample with a remarkable level of heterogeneity, where data from countries such as the United States, Germany, Japan or El Salvador and Zimbabwe, are pooled.. 5. 5.1.. Results OLS regressions. In order to evaluate the relationship between trust ( TRUST ) and income per capita. ( GDPPC ) we start by performing OLS estimations for the different models specified in Section 4. Table 4 provides the results for all four models. The results for Model 1, where only an intercept and TRUST are considered as regressors, suggest a positive and highly significant effect for TRUST. The magnitude of this effect, however, decreases when other variables are included in the more comprehensive models (Models 2, 3 and 4). This is an expected result, in the sense that in the first model the TRUST coefficient might be upward biased, since the model is disregarding other determinants of the income level. Nevertheless, the estimated coefficient never loses its significance, even after controlling for the Solow variables (Model 2) and the remaining variables considered in Models 3 and 4, the last including time effects. Therefore, trust has a significant influence on income per capita and these results might be supporting previous findings in the literature such as those by Knack and Keefer (1997), Zak and Knack (2001) and Horvath (2012). Yet comparisons should be made with caution, since as commented on in Section 4.1, most studies in this context use growth rates as a measure of economic performance, and not income levels, as we do. For a direct comparison with models in levels we focus on Dearmon and Grier (2009), who found analogous results for a sample of 51 countries, and recently Bjørnskov and Méon (2013), whose results are also in consonance with those found in this study. Therefore, our results add further evidence on this issue. Using a larger sample of countries and the most recent available data for trust, results hold. 15 Normality. was formally tested by using Shapiro and Wilk’s (1965) and Doornik and Hansen’s (2008) tests, and in both cases the normality assumption was strongly rejected. Results from these tests are available from the authors upon request.. 11.
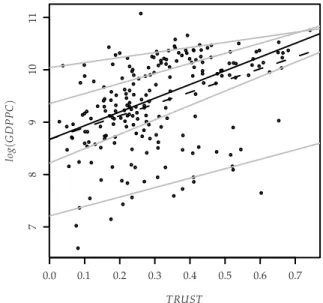
(14) The other variables included in the different specifications—i.e. Models 2, 3 and 4— show in most cases the expected signs, but these are not always significant. While the investment variable ( IGDP) is positive and significant for all three models where it is included (Models 2, 3 an 4), the growth of working population ( GWORK ) and the variable controlling for education ( HK ) are significant in Model 2 but lose significance when additional controls are included. The influence of government institutions ( POLITY ) seems to be relevant for income levels, while the degree of openness (OPENNESS), ethnic fractionalization ( ETHN IC ), and perhaps surprisingly, the dummy variable ( AFRICA) are non-significant. 5.2.. Quantile regressions. Although OLS regressions provide useful insights, as commented on throughout the study, they focus on the average effect. Therefore, this strategy sheds no light on the effects in other particular parts of the response variable. Effects of trust may vary, which is actually the case, across quantiles, implying differing behaviors depending on the country’s level of income. Figure 2 plots different fits for Model 1 (where TRUST is included as a single regressor together with an intercept). The plot is very illustrative, since it displays the results for OLS estimation, the median (“median regression”), as well as some percentiles (additional details are available in the footnote of the figure). Although we cannot draw definitive conclusions from this analysis (control variables are not included, and inference could be seriously affected by omitted variable biases), its usage is, at first sight, interesting. It clearly shows different slopes for TRUST, depending on the percentile. Such a finding implies that generalization of the OLS results should be, at the very least, questioned. Therefore, in this section we perform quantile regressions for the four models. Results for the main percentiles for the different models are available in Tables 5, 6, 7 and 8, while Table 9 provides ANOVA tests for the equality of the slopes of TRUST for the different quantile estimates. More detailed and accurate results are displayed in Figure 3, where the estimates for the 100 percentiles are graphically displayed (percentile regression). The solid red line, constant across quantiles, corresponds to the OLS estimation. The dashed red lines are 90% confidence intervals. The dotted black line reflects the results by quantile— i.e. different percentiles—and the shaded area, the associated 90% confidence intervals. Another solid black line set at zero helps us to see at a glance when a variable is significant or not—depending on whether the zero value of the OY axis overlaps or not with the 12.
(15) confidence bands. Note that, supporting the results found in Section 5.1, the bands for OLS do not overlap the zero in any of the models, and therefore TRUST is significant on average. When the quantile estimation is performed, a common pattern for TRUST is observed for all four models. Note that the 90% confidence bands overlap the zero line for the poorest countries (approximately those in the range of percentiles 0–15, depending on the model). Such a pattern suggests that TRUST is non-significant for these countries. However, when a country reaches a certain level of development, the impact of TRUST on income becomes highly significant (from percentile 15 approximately, slightly variant across models) and furthermore, its contribution to income is maximum. After that, the coefficient begins to decrease progressively until the highest quantiles, where there is a rebound (for Models 2, 3 and 4), although the confidence bands indicate that such a rebound is no longer significant after the 95 percentile—i.e. the very richest countries. Note that the pattern remains essentially unaltered in the different model specifications, which might suggest that, even when controlling for multiple income determinants, results for TRUST are relatively robust. ANOVA tests provided in Table 9 corroborate that the magnitude of the coefficients actually differs across quantiles. These are interesting results considering previous arguments in the trust literature. Knack and Keefer (1997) suggested that trust effects should be stronger for poorer countries. They held that those countries are characterized by both weak institutions and poor legal frameworks, and trust may become an informal framework to guarantee transactions. Shortly after, Zak and Knack (2001) introduced a new concept, the low-trust poverty trap. They argued that poor countries with a lower stock of trust, despite the presumption of the neoclassical growth model of higher returns to capital and potential faster growth,16 may not make the most of their backward situation. However, poor countries where trust is sufficiently high would take advantage of that backwardness and, therefore, trust would become the “lubricant” for development. According to our results, this argument does not hold, since for the poorest countries TRUST is non-significant, and therefore the level of trust that they actually have is not relevant. Rothstein and Uslaner (2005) dug more deeply in this line of research and evaluated the causes of what they called the social trap. They suggested that the poorest countries are 16 This. is a central point in the convergence literature. The production factors show diminishing returns, and therefore the poorer economies generally grow faster than the richer ones. See Barro and Sala-i Martin (1992) for an excellent discussion.. 13.
(16) normally characterized by high levels of income inequality and dysfunctional institutions, and that has a pernicious effect on trust. If institutions are expected to establish policies in order to mitigate inequality, but trust is low, then these policies cannot be properly established. If policies are not appropriately applied, then this also negatively affects trust and therefore, “poor and inegalitarian countries find themselves trapped in a situation of continuing inequality, mistrust and dysfunctional institutions” (Rothstein and Uslaner 2005, p.71). Additional support is given by Bjørnskov (2007) and Fairbrother and Martin (2013), who find that income inequality is one of the factors destroying social trust. Partially linked to these assertions, Ahlerup et al. (2009) argued that the positive effect of trust dilutes when formal institutions become stronger and more reliable for guaranteeing economic transactions. Therefore, trust would be less relevant for richer countries, which are precisely those benefiting from stronger institutional frameworks. In this respect, the recent contribution by Bjørnskov and Méon (2013) concluded that trust is linked to institutional development, and therefore trust effects in rich countries might be channeled through better formal institutions. The pattern shown by TRUST in our results by quantile might support the above arguments. On the one hand, they evidence the existence of the social trap, since trust is non-significant for the poorest countries. In these countries, an increase in the level of trust will not yield any positive effect on income. On the other hand, they lend support to the argument that for the relatively richer countries, which are those with better institutions, trust is less relevant for income per capita. Therefore, once a country succeeds in escaping from the social trap, income might enjoy the maximum contribution from trust, since the institutions still cannot guarantee transactions. During the development process, institutions tend to reinforce, transactions become securer and trust loses importance, since its positive effects are supplied by the formal institutional framework. Tables 5, 6, 7 and 8 also report the results for the rest of variables included as controls. The growth of population (GWORK) is significant for the relatively poor countries in Model 2, while the investment variable (IGDP) remains highly significant, regardless of the model. Human capital (HK), seems to be relevant only for the relatively richer countries in Model 2, and exclusively for the richest in Model 3. The degree of trade openness (OPENNESS) and the degree of ethnic fractionalization (ETHN IC), show the expected positive and negative sign respectively, but are no longer significant. The variable capturing government quality (POLITY) is positive and highly significant across quantiles and specifications and, finally,. 14.
(17) the dummy variable for African countries (AFRICA) is non-significant.. 6.. Concluding remarks. Most of the studies evaluating the role of trust on economic development concluded that trust influences economic development, following both direct and indirect channels. Yet in the great majority of cases scholars have generalized the outcomes of trust, neglecting that trust might affect income with different intensity depending on the level of development of the country, and therefore showing heterogeneous effects and non-linearities. This study contributes to the literature in two different aspects. Firstly, it expands Dearmon and Grier’s (2009) sample, one of the widest in this particular context, with 89 additional observations and also considering the most recent data on trust from the WVS (2005-2007). And secondly, the analysis is performed using both OLS and quantile regression. Whereas the first approach corroborates previous findings in the literature— i.e. trust is one of the drivers of economic development—, the second has allowed us to evaluate with some precision non-linear impacts of trust across the conditional quantiles of income, casting considerable doubts on the generalization of trust effects. In particular, the quantile regression estimations indicate that trust might not be relevant for the poorest countries, showing also a decreasing pattern, forecasting diminishing returns for trust as an economy becomes richer. These results are particularly robust to different model specifications, where additional controls are included sequentially. This intriguing result might point suggest some sort of social trap could exist for the poorest economies, corroborating previous arguments by Rothstein and Uslaner (2005), Bjørnskov (2007), Ahlerup et al. (2009) and Fairbrother and Martin (2013), focused on the role played by the institutional framework as well as income inequality. Our findings might also help providing some policy recommendations. The results suggest that, on average, trust affects income and, therefore, policies promoting social trust would be welcome. However, this is not an easy task, since the heritable character of trust implies that the capacity of the governments for boosting it is limited. In addition, our results by quantile suggest that efforts to increase trust levels in the poorest economies might not be the best strategy but rather to concentrate the efforts on those aspects that might underlie the social trap. The results have some limitations as well. While income inequality might be one potential candidate for explaining these traps, future research should try to provide additional 15.
(18) evidence on this respect. In addition, although the recent contribution by Freitag and Bauer (2013) concluded that the concept of trust is equally understood across cultures, the debate on that point remains open, as some contributions hold opposite views. Specifically, Holm and Danielson (2005) argues that trust scores, especially in African countries, might not be capturing the relevant concept and, therefore, results should be taken carefully. In summary, this study has provided evidence for achieving an understanding of the effects of trust on income for different levels of development and, while it has shed light on the issue, additional evidence on related fronts would be welcome. Among them, some of the most intriguing questions would be, first, reaching a fuller understanding of what might exactly underlie the social trap and, second, which could actually be the mechanisms through which governments and international organizations might influence these scenarios.. Acknowledgements We thank Fabio Pieri, Pierre-Alexandre Balland and other participants in the conference “IX Jornadas de Integración Económica INTECO” (València, Spain, November 2012), the research seminar “Creativity, networks and clusters: Learning from interactions” (Castelló, Spain, November 2012), and the XXXVII Simposio de la Asociación Española de Economía (Spanish Economic Association Annual Meeting, Vigo, Spain, December 2012), as well as to Jacint Balaguer, Aurora García-Gallego and Juan Ángel Lafuente for helpful comments. We are especially thankful to two anonymous referees, whose comments have contributed to the overall improvement of the article. The financial support of the Ministerio de Ciencia e Innovación (ECO2011-27227) and Generalitat Valenciana (VALi+d ACIF/2011 and PROMETEO/2009/066) is also gratefully acknowledged. The usual disclaimer applies.. References Ahlerup, P., Olsson, O., Yanagizawa, D., 2009. Social capital vs institutions in the growth process. European Journal of Political Economy 25, 1–14. Akçomak, İ., Ter Weel, B., 2009. Social capital, innovation and growth: evidence from Europe. European Economic Review 53, 544–567. Algan, Y., Cahuc, P., 2010. Inherited trust and growth. American Economic Review 100, 2060–2092. Arrow, K.J., 1972. Gifts and exchanges. Philosophy & Public Affairs 1, 343–362.. 16.
(19) Barreto, R., Hughes, A., 2004. Under performers and over achievers: a quantile regression analysis of growth. Economic Record 80, 17–35. Barro, R., Sala-i Martin, X., 1992. Convergence. Journal of Political Economy 100(2), 223–251. Barro, R.J., Sala-i-Martin, X., 1995. Economic Growth. McGraw Hill, New York. Barrodale, I., Roberts, F., 1974. Solution of an overdetermined system of equations in the l 1 norm [f4]. Communications of the ACM 17, 319–320. Beugelsdijk, S., Van Schaik, T., 2005. Social capital and growth in European regions: an empirical test. European Journal of Political Economy 21, 301–324. Beugelsdijk, S., De Groot, H.L., Van Schaik, A.B., 2004. Trust and economic growth: a robustness analysis. Oxford Economic Papers 56, 118–134. Bjørnskov, C., 2006. The multiple facets of social capital. European Journal of Political Economy 22, 22–40. Bjørnskov, C., 2012. How does social trust affect economic growth? Southern Economic Journal 78, 1346–1368. Bjørnskov, C., 2007. Determinants of generalized trust: a cross-country comparison. Public Choice 130, 1–21. Bjørnskov, C., 2009. Social trust and the growth of schooling. Economics of Education Review 28, 249–257. Bjørnskov, C., Méon, P.G., 2013. Is trust the missing root of institutions, education, and development? Public Choice forthcoming. Boix, C., Posner, D.N., 1998. Social capital: explaining its origins and effects on government performance. British Journal of Political Science 28, 686–693. Brock, W.A., Durlauf, S.N., 2001. What have we learned from a decade of empirical research on growth? Growth empirics and reality. World Bank Economic Review 15, 229–272. Cade, B.S., Noon, B.R., 2003. A gentle introduction to quantile regression for ecologists. Frontiers in Ecology and the Environment 1, 412–420. Cameron, A.C., Trivedi, P.K., 2009. Microeconometrics Using Stata, volume 5. Stata Press College Station, TX. Coad, A., Rao, R., 2008. Innovation and firm growth in high-tech sectors: a quantile regression approach. Research Policy 37, 633–648. Crespo-Cuaresma, J.C., Foster, N., Stehrer, R., 2011. Determinants of regional economic growth by quantile. Regional Studies 45, 809–826. Dearmon, J., Grier, K., 2009. Trust and development. Journal of Economic Behavior & Organization 71, 210–220. Dearmon, J., Grier, K., 2011. Trust and the accumulation of physical and human capital. European Journal of Political Economy 27, 507–519.. 17.
(20) Doh, S., McNeely, C., 2011. A multi-dimensional perspective on social capital and economic development: an exploratory analysis. The Annals of Regional Science 49, 821–843. Doornik, J.A., Hansen, H., 2008. An omnibus test for univariate and multivariate normality. Oxford Bulletin of Economics and Statistics 70, 927–939. Durlauf, S.N., 2002. On the empirics of social capital. Economic Journal 112, 459–479. Durlauf, S.N., Fafchamps, M., 2005. Social capital. In: P. Aghion, S.N. Durlauf (Eds.), Handbook of Economic Growth, North-Holland, Amsterdam, volume 1B, chapter 26, pp. 1639–1699. Fairbrother, M., Martin, I.W., 2013. Does inequality erode social trust? Results from multilevel models of US states and counties. Social Science Research 42, 347–360. Freitag, M., Bauer, P.C., 2013. Testing for measurement equivalence in surveys dimensions of social trust across cultural contexts. Public Opinion Quarterly 77, 24–44. Guiso, L., Sapienza, P., Zingales, L., 2004. The role of social capital in financial development. American Economic Review 94, 526–556. Guiso, L., Sapienza, P., Zingales, L., 2009. Cultural biases in economic exchange? The Quarterly Journal of Economics 124, 1095–1131. Henderson, D.J., Papageorgiou, C., Parmeter, C.F., 2011. Growth empirics without parameters. Economic Journal 122, 125–154. Holm, H.J., Danielson, A., 2005. Tropic trust versus nordic trust: experimental evidence from Tanzania and Sweden. The Economic Journal 115, 505–532. Horvath, R., 2012. Does trust promote growth? Journal of Comparative Economics . Islam, N., 1995. Growth empirics: a panel data approach. Quarterly Journal of Economics 110, 1127. Knack, S., 2002. Social capital and the quality of government: evidence from the States. American Journal of Political Science 46, 772–785. Knack, S., Keefer, P., 1997. Does social capital have an economic payoff? A cross country investigation. Quarterly Journal of Economics 112, 1251–1288. Koenker, R., Hallock, K.F., 2001. Quantile regression. Journal of Economic Perspectives 15, 143–156. Koenker, R., 1994. Confidence intervals for regression quantiles. In: P. Mandl, M. Huskova (Eds.), Asymptotic Statistics, Springer, New York, pp. 349–359. Koenker, R., 2005. Quantile Regression. Cambridge University Press, New York. Koenker, R., Bassett, G., 1978. Regression quantiles. Econometrica 46, 33–50.. 18.
(21) Koenker, R.W., d’Orey, V., 1987. Computing regression quantiles. Journal of the Royal Statistical Society. Applied Statistics 36, 383–393. Maloney, W.F., Cunningham, W.V., Bosch, M., 2004. The distribution of income shocks during crises: an application of quantile analysis to Mexico, 1992–95. World Bank Economic Review 18, 155–174. Mankiw, N., Romer, D., Weil, D., 1992. A contribution to the empirics of economic growth. Quarterly Journal of Economics 107, 407–437. Mello, M., Perrelli, R., 2003. Growth equations: a quantile regression exploration. Quarterly Review of Economics and Finance 43, 643–667. Miguélez, E., Moreno, R., Artís, M., 2011. Does social capital reinforce technological inputs in the creation of knowledge? Evidence from the Spanish regions. Regional Studies 45, 1019–1038. North, D., 1990. Institutions, Institutional Change, and Economic Performance. Cambridge Univ Press, New York. Nunn, N., Wantchekon, L., 2011. The slave trade and the origins of mistrust in africa. American Economic Review 101, 3221–52. Osborne, E., 2006. The sources of growth at different stages of development. Contemporary Economic Policy 24, 536–547. Putnam, R., 1993. Making Democracy Work: Civic Traditions in Modern Italy. Princeton Univ Press, New Jersey. Rothstein, B., Uslaner, E.M., 2005. All for all: equality, corruption, and social trust. World Politics 58, 41–72. Sen, A.K., 1977. Rational fools: a critique of the behavioral foundations of economic theory. Philosophy & Public Affairs 6, 317–344. Shapiro, S., Wilk, M., 1965. An analysis of variance test for normality (complete samples). Biometrika 52, 591–611. Sheather, S.J., Jones, M.C., 1991. A reliable data-based bandwidth selection method for kernel density estimation. Journal of the Royal Statistical Society Ser.B,53, 683–690. Solow, R.M., 1957. Technical change and the aggregate production function. The Review of Economics and Statistics 39, 312–320. Teorell, J., Samanni, M., Holmberg, S., Rothstein, B., 2011. The Quality of Government Dataset. University of Gothenburg. Available online at http://www.qog.pol.gu.se. Uslaner, E., 2002. The Moral Foundations of Trust. Cambridge University Press, Cambridge. Uslaner, E., 2008. Where you stand depends upon where your grandparents sat. Public Opinion Quarterly 72, 725–740.. 19.
(22) Whiteley, P., 2000. Economic growth and social capital. Political Studies 48, 443–466. Yamamura, E., 2012. Social capital, household income, and preferences for income redistribution. European Journal of Political Economy 28, 498–511. Zak, P.J., Knack, S., 2001. Trust and growth. Economic Journal 111, 295–321.. 20.
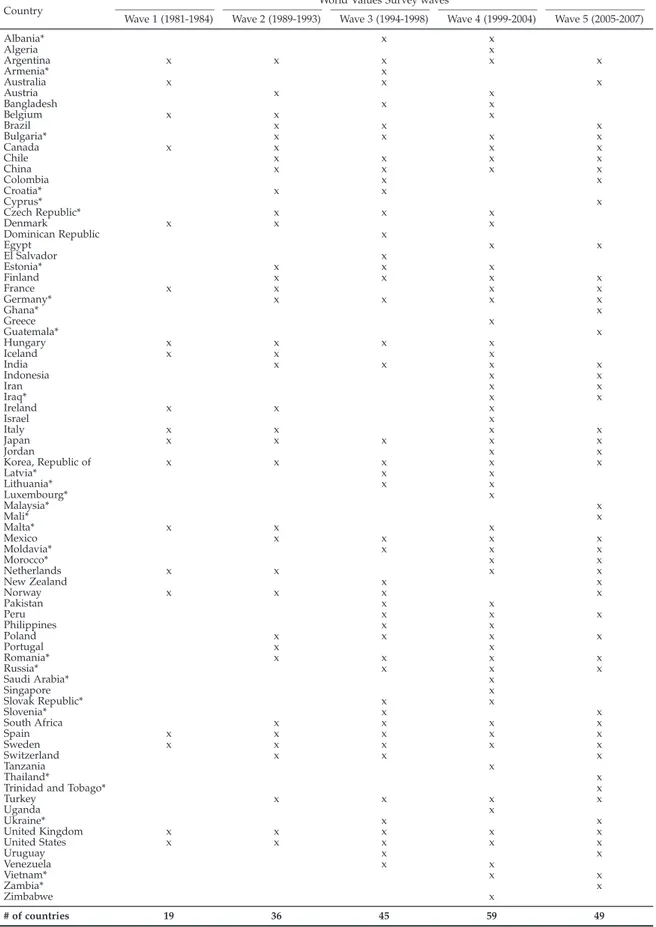
(23) Table 1: Sample description World Values Survey waves. Country. Wave 1 (1981-1984). Albania* Algeria Argentina Armenia* Australia Austria Bangladesh Belgium Brazil Bulgaria* Canada Chile China Colombia Croatia* Cyprus* Czech Republic* Denmark Dominican Republic Egypt El Salvador Estonia* Finland France Germany* Ghana* Greece Guatemala* Hungary Iceland India Indonesia Iran Iraq* Ireland Israel Italy Japan Jordan Korea, Republic of Latvia* Lithuania* Luxembourg* Malaysia* Mali* Malta* Mexico Moldavia* Morocco* Netherlands New Zealand Norway Pakistan Peru Philippines Poland Portugal Romania* Russia* Saudi Arabia* Singapore Slovak Republic* Slovenia* South Africa Spain Sweden Switzerland Tanzania Thailand* Trinidad and Tobago* Turkey Uganda Ukraine* United Kingdom United States Uruguay Venezuela Vietnam* Zambia* Zimbabwe # of countries ∗ Denotes. x x x x. Wave 2 (1989-1993). Wave 3 (1994-1998). Wave 4 (1999-2004). Wave 5 (2005-2007). x. x x x. x. x x x x x x x x x. x. x. x x. x x x x. x x x x x x x x x x x x x x x x. x x x x x x x. x x x x x x x x. x x. x x x. x. x. x x. x x. x. x. x. x x. x. x. x. x. x x x. x x. x x x x. x x x. x x. x x. x x x x. x x x x x x x x x x x x x x x x. x x x x x x. x x x x x x x x x x x x x x x x x x x x x x x x x x x x x x x x x x x x x x x x x. 19. 36. countries not included in Dearmon and Grier (2009).. 45. 59. x. x x x x x x x. x x x x x x x x x x x x x x. x x x x x x x x x x x x. x x x x x x x x x x x x x x 49.
(24) Table 2: Variables and sources Variable GDPPC TRUST GWORK IGDP HK OPENNESS POLITY ET HN IC AFRICA tw. Description. Source. logs)a. GDP per capita (in Share of respondents who trust each other Growth of working population Investment (as a share of GDP) Share of working population with secondary studies Degree of openness (as a share of GDP) Polity 2 (0 − 20)b Ethnic fractionalization (0 − 1)c 1=African country; 0=otherwise Temporal dummy for each periodd. Penn World Tables 6.3 World Values Survey World Development Indicators Penn World Tables 6.3 Barro-Lee Educational Attainment Dataset (2010) Penn World Tables 6.3 Polity IV Dataset Teorell et al. (2011) – –. a. Base year: $US of 2005. Higher values correspond to more democratic institutions. c Higher values correspond to more fractionalization. d The w subscript denotes the time period. b. Table 3: Descriptive statistics Variable. Obs.. Mean. S.d.. Min.. 1st quartile. Median. 3rd quartile. Max.. GDPPC TRUST GWORK IGDP HK OPENNESS POLITYa ET HN IC. 208 208 208 208 208 208 199 208. 15,691.83 0.305 0.061 0.244 0.457 0.694 16.710 0.316. 11,015.73 0.157 0.011 0.079 0.157 0.446 5.080 0.222. 730.368 0.028 0.035 0.044 0.045 0.124 0.000 0.012. 6,324.81 0.188 0.053 0.188 0.357 0.403 16.000 0.118. 12,402.87 0.277 0.060 0.247 0.461 0.586 19.000 0.255. 24,299.99 0.411 0.069 0.298 0.564 0.848 20.000 0.499. 64,467.18 0.742 0.098 0.493 0.804 3.662 20.000 0.930. a. Information is missing for Iceland, Iraq, Malta and Luxembourg.. 22.
(25) Table 4: Determinants of GDP per capita: OLS regressions Dependent variable: GDPPC (in logs) Covariates. Model 1a,c. Model 2a,c. Model 3b,c. Model 4b,c. ( Intercept). 8.674∗∗∗ (0.119) 2.243∗∗∗ (0.347). 8.350∗∗∗ (0.439) 1.451∗∗∗ (0.300) −13.195∗∗∗ (4.838) 4.361∗∗∗ (0.620) 0.665∗∗ (0.339). 6.789∗∗∗ (0.476) 1.556∗∗∗ (0.257) −3.168 (5.741) 3.726∗∗∗ (0.746) 0.336 (0.350) 0.161 (0.150) 0.071∗∗∗ (0.012) −0.264 (0.259) 0.111 (0.244). 7.131∗∗∗ (0.477) 1.448∗∗∗ (0.266) −3.928 (5.770) 3.580∗∗∗ (0.739) 0.346 (0.360) 0.160 (0.160) 0.070∗∗∗ (0.011) −0.259 (0.255) 0.076 (0.251). No 0.164 41.740∗∗∗ 0.004. No 0.422 38.830∗∗∗ 0.106. No 0.578 32.470∗∗∗ 28.088∗∗∗. Yes 0.590 22.370∗∗∗ 26.152∗∗∗. TRUST GWORK IGDP HK OPENNESS POLITY ETHN IC AFRICA Time controls R2 (Adjusted) FSTAT χ2 Cook-Weisebergd a. Standard errors are in parentheses. Robust standard errors are in parentheses. c ∗ , ∗∗ and ∗∗∗ denote significance at 10%, 5%, and 1% significance levels, respectively. d Cook-Weiseberg test for heteroscedasticity. Under the null hypothesis the variance of the disturbances remains constant. b. 23.
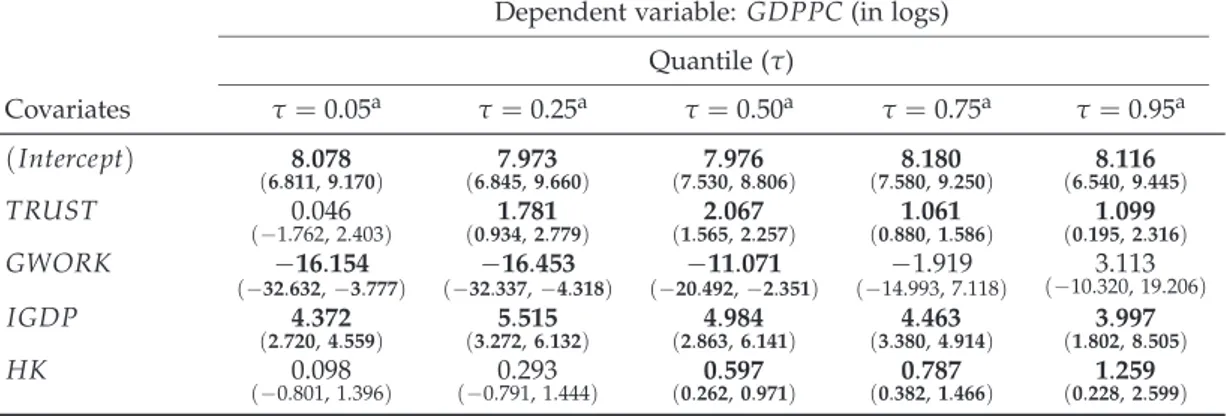
(26) Table 5: Determinants of GDP per capita: quantile regression (Model 1) Dependent variable: GDPPC (in logs) Quantile (τ) Covariates. τ=. ( Intercept). τ=. 7.210. 1.801. 0.25a. 8.221. (6.686, 7.705). TRUST a. 0.05a. (7.945, 8.391). (−0.000, 3.076). 2.745. (0.601, 3.511). τ = 0.50a 8.672. (8.510, 8.844). 2.620. (2.223, 2.961). τ = 0.75a 9.355. (8.930, 9.611). 1.919. (1.325, 3.360). τ = 0.95a 10.042. (9.915,10.224). 0.964. (0.610, 1.948). According to Figure 3, confidence bands (90%) are in parentheses. They are computed using the rank method, suitable for samples with fewer than 1,000 observations (see Koenker, 1994). In bold are those bands not including the zero—i.e. the estimated coefficient (also in bold) is significant for this quantile.. Table 6: Determinants of GDP per capita: quantile regression (Model 2) Dependent variable: GDPPC (in logs) Quantile (τ) Covariates. ( Intercept) TRUST GWORK IGDP HK a. τ=. 0.05a. 8.078. (6.811, 9.170). 0.046. (−1.762, 2.403). −16.154. (−32.632, −3.777). 4.372. (2.720, 4.559). 0.098. (−0.801, 1.396). τ=. 0.25a. τ = 0.50a. 7.973. (6.845, 9.660). 1.781. (0.934, 2.779). −16.453. (−32.337, −4.318). 5.515. (3.272, 6.132). 0.293. (−0.791, 1.444). 7.976. (7.530, 8.806). 2.067. (1.565, 2.257). −11.071. (−20.492, −2.351). 4.984. (2.863, 6.141). 0.597. (0.262, 0.971). τ = 0.75a 8.180. (7.580, 9.250). 1.061. (0.880, 1.586). −1.919. (−14.993, 7.118). 4.463. (3.380, 4.914). 0.787. (0.382, 1.466). τ = 0.95a 8.116. (6.540, 9.445). 1.099. (0.195, 2.316). 3.113. (−10.320, 19.206). 3.997. (1.802, 8.505). 1.259. (0.228, 2.599). According to Figure 3, confidence bands (90%) are in parentheses. They are computed using the rank method, suitable for samples with less than 1,000 observations (see Koenker, 1994). In bold are those bands not including the zero—i.e the estimated coefficient (also in bold) is significant for this quantile.. 24.
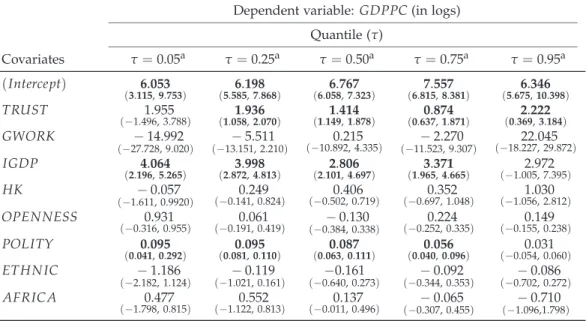
(27) Table 7: Determinants of GDP per capita: quantile regression (Model 3) Dependent variable: GDPPC (in logs) Quantile (τ) Covariates. ( Intercept) TRUST GWORK IGDP. 6.304. (3.844, 7.647). 1.976. (−0.287, 3.439). −1.695. (−2.785, 2.319). 4.279. (3.523, 4.928). −0.417. HK. (−1.751, 1.102). OPENNESS POLITY ETHN IC AFRICA a. τ=. 0.05a. 0.809. (−0.096, 0.964). 0.093. (0.066, 0.272). −1.331. (−2.016, 0.107). 0.224. (−1.798, 0.493). τ=. 0.25a. τ = 0.50a. 5.788. 6.769. (5.332, 6.820). (5.327, 7.425). 1.853. 1.559. (1.284, 2.247). (1.244, 1.789). −0.0780. (−7.774, 6.218). 3.976. −2.966. (−13.578, 10.417). 3.100. (2.852, 5.310). (2.208, 4.133). 0.272. (−0.123, 0.540). 0.146. (−0.189, 0.321). 0.098. 0.572. (−0.260, 0.682). −0.095. (−0.401, 0.314). 0.083. (0.081, 0.119). (0.070, 0.111). −0.459. (−1.000, 0.328). 0.587. (−0.980, 0.866). −0.083. (−0.582, 0.288). 0.251. (0.011, 0.550). τ = 0.75a 7.373. (6.985, 7.954). 0.909. (0.686, 1.409). −0.989. (−10.004, 8.265). 3.307. (1.980, 4.211). 0.399. (−0.107, 1.221). 0.218. (−0.165, 0.347). 0.063. (0.036, 0.094). −0.148. (−0.233, 0.209). 0.024. (−0.297, 0.419). τ = 0.95a 6.215. (5.733, 9.137). 2.130. (0.498, 3.126). 20.240. (−7.514, 31.661). 3.702. (0.527, 7.534). 1.528. (0.104, 2.366). 0.157. (−0.061, 0.204). 0.031. (−0.039, 0.052). −0.389. (−0.703, 0.438). −0.440. (−0.791, 1.798). According to Figure 3, confidence bands (90%) are in parentheses. They are computed using the rank method, suitable for samples with less than 1,000 observations (see Koenker, 1994). In bold are those bands not including the zero—i.e the estimated coefficient (also in bold) is significant for this quantile.. Table 8: Determinants of per capita GDP: quantile regression (Model 4) Dependent variable: GDPPC (in logs) Quantile (τ) Covariates. ( Intercept) TRUST GWORK IGDP HK OPENNESS POLITY ETHN IC AFRICA a. τ=. 0.05a. 6.053. (3.115, 9.753). 1.955. (−1.496, 3.788). − 14.992. (−27.728, 9.020). 4.064. (2.196, 5.265). − 0.057. (−1.611, 0.9920). 0.931. (−0.316, 0.955). 0.095. (0.041, 0.292). − 1.186. (−2.182, 1.124). 0.477. (−1.798, 0.815). τ=. 0.25a. τ = 0.50a. 6.198. (5.585, 7.868). 1.936. (1.058, 2.070). − 5.511. (−13.151, 2.210). 3.998. (2.872, 4.813). 0.249. (−0.141, 0.824). 0.061. (−0.191, 0.419). 0.095. (0.081, 0.110). − 0.119. (−1.021, 0.161). 0.552. (−1.122, 0.813). 6.767. (6.058, 7.323). 1.414. (1.149, 1.878). 0.215. (−10.892, 4.335). 2.806. (2.101, 4.697). 0.406. (−0.502, 0.719). − 0.130. (−0.384, 0.338). 0.087. (0.063, 0.111). −0.161. (−0.640, 0.273). 0.137. (−0.011, 0.496). τ = 0.75a 7.557. (6.815, 8.381). 0.874. (0.637, 1.871). − 2.270. (−11.523, 9.307). 3.371. (1.965, 4.665). 0.352. (−0.697, 1.048). 0.224. (−0.252, 0.335). 0.056. (0.040, 0.096). − 0.092. (−0.344, 0.353). − 0.065. (−0.307, 0.455). τ = 0.95a 6.346. (5.675, 10.398). 2.222. (0.369, 3.184). 22.045. (−18.227, 29.872). 2.972. (−1.005, 7.395). 1.030. (−1.056, 2.812). 0.149. (−0.155, 0.238). 0.031. (−0.054, 0.060). − 0.086. (−0.702, 0.272). − 0.710. (−1.096,1.798). According to Figure 3, confidence bands (90%) are in parentheses. They are computed using the rank method, suitable for samples with less than 1,000 observations (see Koenker, 1994). In bold are those bands not including the zero—i.e the estimated coefficient (also in bold) is significant for this quantile.. 25.
(28) Table 9: ANOVA tests for the equality of the slope coefficients for different quantiles (τ). F-statistic p-value. Model 1. Model 2. Model 3. Model 4. 5.020 0.001. 5.387 0.000. 7.696 0.000. 6.281 0.000. The null hypothesis being tested is whether the slope coefficients for TRUST for the different τ are equal (H0 : β τ =0.05 = β τ =0.25 = β τ =0.50 = β τ =0.75 = β τ =0.95 ).. 26.
(29) 0.6 0.5 0.4 0.3 0.2 0.0. 0.1. Density of countries. 6. 8. 7. 9. 10. 11. 12. log( GDPPC ). Figure 1: Income distribution. 9 7. 8. log( GDPPC ). 10. 11. Notes: Figure shows a Kernel density estimation. We chose a Gaussian kernel, and the bandwidths were implemented using the plug-in methods of Sheather and Jones (1991).. 0.0. 0.1. 0.2. 0.3. 0.4. 0.5. 0.6. 0.7. TRUST. Figure 2: Quantile slopes for TRUST Notes: The plot shows a scatterplot of the data on GDPPC (in logs) vs TRUST. Superimposed on the plot are the (0.05,0.25,0.75,0.95) quantile regression lines in grey (solid), the median fit (quantile 0.50) in black (solid), and the OLS estimation in black (dashed). The above fits are based on a simple regression where GDPPC (in logs) is the dependent variable, and TRUST and an intercept, the regressors.. 27.
(30) 0 -4. -2. Coefficient. 3 2 0. -6. 1. Coefficient. 4. 2. 5. 4. -0.1. 0.2. 0.4. 0.6. 0.8. 0.0. 1.0. 0.2. 0.4. 0.6. Quantile (τ). Quantile (τ). (a) Model 1. (b) Model 2. 0.8. 1.0. 0.8. 1.0. 2. Coefficient. 0. 0. -2. -2. -4. -4. Coefficient. 4. 2. 6. 4. 8. 0.0. 0.0. 0.2. 0.4. 0.6. 0.8. 1.0. 0.0. 0.2. 0.4. 0.6. Quantile (τ). Quantile (τ). (c) Model 3. (d) Model 4. Figure 3: Regression quantiles for TRUST Notes: The slopes for TRUST, estimated by quantile regression for the different models, are plotted as a function of the different quantiles (percentiles from 1 to 99), represented in the horizontal axis. The vertical axis represents the values of the estimated coefficients for each quantile, and the red solid line corresponds to the TRUST coefficient of the OLS estimation. The dashed lines in red correspond to 90% confidence bands for the OLS estimation, whereas those for the quantile estimation are represented by the shaded area. In those areas where the confidence bands contain the zero, the estimated coefficient is non-significant.. 28.
(31)
Figure
+4
Documento similar
The existence of stationary radial solutions to a partial differential equation arising in the theory of epitaxial growth is studied.. It turns out that the existence or not of
In the “big picture” perspective of the recent years that we have described in Brazil, Spain, Portugal and Puerto Rico there are some similarities and important differences,
Simulations showed that (a) our model is consistent with behavioral IOR data [1], (b) the activation of visuomotor neurons in our model is qualitatively similar to the activity
Modern irrigation is transforming traditional water irrigation norms and therefore it is critical to understand how the access mechanisms to assets (natural, financial, social),
In a similar light to Chapter 1, Chapter 5 begins by highlighting the shortcomings of mainstream accounts concerning the origins and development of Catalan nationalism, and
In the preparation of this report, the Venice Commission has relied on the comments of its rapporteurs; its recently adopted Report on Respect for Democracy, Human Rights and the Rule
In the first model (the Theoretical Model), the impact of the existence of innovation on financial performance is potentially mitigated by the extent to which the economic and social
However, the practical bandwidth of the antenna is limited by the aforementioned pattern bandwidth (PBW) for the desired pointing angle (in our case = GOAL =30º). The
