TítuloLamin A deregulation in human mesenchymal stem cells promotes an impairment in their chondrogenic potential and imbalance in their response to oxidative stress
18
0
0
Texto completo
(2) function of lamins, specifically the regulation of the p16/Rb pathway necessary to maintain balance between differentiation and proliferation of multipotent mesenchymal stromal or stem cells (MSCs) in tissue regeneration (Espada et al., 2008, Scaffidi and Misteli, 2008 and Hernandez et al., 2010). Recently, increased accumulation of lamin A in osteoarthritis (OA) chondrocytes and cartilage (RuizRomero et al., 2008 and Attur et al., 2012) has been reported. OA is one of the most common skeletal disorders clinically manifested by joint pain, swelling and progressive loss of function. It is characterized by cartilage degradation, hypertrophy of the subchondral bone and osteophyte formation at the joint margins (Lamas et al., 2010). Although the underlying molecular mechanisms involved in the disease remain unknown, the etiology of OA has been considered an articular cartilage disorder induced by mechanical stress, articular injuries, involvement of inflammatory mediators and aging. Evidence suggests that cellular senescence of the chondrocyte is inherent to the OA process (Loeser, 2011). Finally, progression of the disease has been shown to be therapeutically modulated by MSCs (Mafi et al., 2011 and van Buul et al., 2012). The aim of this study was to demonstrate whether lamin A deregulation in MSCs modulates the chondrogenesis process. We demonstrated that over-expression of lamin A and PG reduces the chondrogenic capacity of MSC. We also provided evidence that linked those defects to alterations in oxidative stress response through using N-acetylcysteine which protects against hypoxia produced by production of oxygen reactive species (Cillero-Pastor et al., 2008). Material and methods Tissue collection Human UCs were obtained from cesarean sections performed on healthy women at the Maternity Facility of Complejo Hospitalario Universitario A Coruña (CHUAC). All tissues were obtained with fully informed consent and ethical approval by the supervisor of the Ethical Committee (CEIC) of Galicia. The UC donors were between 26 and 35 years-old. Isolation and culture of MSCs MSCs were isolated from UC stromal tissue using a previously described protocol (Arufe, de la Fuente et al., 2011). Briefly, the tissue was washed with phosphate-buffered saline (PBS) and cut in small pieces, termed “explants;” which were incubated for three five-minute periods in an enzymatic cocktail containing 1.2 U/mL dispase and 112 U/mL collagenase type I (Sigma-Aldrich, St. Louis, Missouri, USA). The explants were cultured in Dulbecco's Modified Eagles Medium (DMEM) with 10% fetal bovine serum (FBS), 1% penicillin and 1% streptomycin (Sigma-Aldrich) until adhered to the plastic plate. After three days, the explants were removed, leaving the attached UC MSCs, which continued monolayer culture in the same medium. When the cells were 90% confluent, they were removed from the plate using 2% trypsin (Sigma-Aldrich) in PBS and induced to differentiate toward mesoderm cell lines. The cells were characterized by flow cytometry using a FACSAria flow cytometer (BD Bioscience, Madrid, SP) to check the following surface markers: PE-conjugated anti-human CD73 (1:20 from BD Pharmingen); PE-Cy5.5-conjugated mouse anti-human CD90 (1:20 from BD Pharmingen); FITC mouse anti-human CD105: (1:100 from Serotec, Bavaria, Germany); FITC mouse anti-rat CD45 (1:20 BD Pharmingen) and CD34 (1:20 from DakoCytomation, Barcelona, SP). FACS data were generated by DIVA software (BD Bioscience). Negative control staining was performed using FITC-conjugated mouse IgG1k isotype, PE-conjugated mouse IgG1k isotype and PE-Cy5.5-conjugated mouse IgG1k isotype (all from BD Pharmingen). Cells were fixed in 4% paraformaldehyde in PBS. After fixation, the cells were washed twice with PBS, permeabilized with PBS containing 0.1% Triton X-100 (Sigma-Aldrich) for 10 min, then pre-blocked with 3% bovine serum albumin (BSA) and incubated with the different antibodies tested for 30 min at room temperature. The stained cells were then washed twice with PBS and 1 × 10⁵ cells were analyzed..
(3) Cloning procedure Full length human PG, LMNA and green fluorescent protein (GFP) cDNAs were amplified by polymerase chain reaction (PCR) from pBABE-puroGFP-progerin and pBABE-puroGFP-lamin A plasmids (Addgene, donated by Tom Misteli), using the oligonucleotides EcoRI-LMNA-forward: CCGGAATTCATGGAGACCCCGTCCCAGCGG, BamHI-LMNA-reverse: CGCGGATCCTTACATGATGCTGCAGTTCTG, EcoRI-GFP-forward: CCGGAATTCATGGTGAGCAAGGGCGAG, BamHI-GFP-reverse: CGCGGATCCTTACTTGTACACCTCGTC. GFP, LMNA and PG were cloned into pLVX-puro (Clontech Laboratories Inc., Mountain View, CA) in between the EcoRI/BamHI sites following standard cloning procedures. Lentiviral production The Lenti-X™ Lentiviral Expression System (Clontech Laboratories Inc.) was used following the manufacturer's protocol. One day before transfection 4 × 10⁶ 293T producer cells were placed on 100 mm plates in penicillin/streptomycin-free DMEM supplemented with 5% FBS. The following day, three different calcium-phosphate based transfections were performed using LVX-GFP-puro, LVX-Progerinpuro and LVX-lamin A-puro. The cells were incubated overnight with the transfection mixture, then washed with PBS and incubated with 8 mL of fresh complete growth medium. Viral supernatants were collected at 48 h, 60 h and 72 h following transfection, centrifuged, filtered to remove cell debris and stored at 4 °C until transduction. Transduction of human UC MSCs Target cells were plated in 100 mm plates at 6 × 10⁶ cells per plate. After one day, the cells were 70% confluent. The cells were incubated sequentially with the 48 hour, 60 hour, and 72 hour viral supernatants for 12 h. Following the last transduction, the cells were washed and incubated with fresh growth medium to allow puromycin-resistance expression. Two days later, puromycin selection was performed by incubating the cells in growth media supplemented with 1 μg/mL puromycin (Clontech Laboratories Inc.) for five days. After selection, transduced cells were washed and allowed to recover in complete media for two days. Proliferation assay Different numbers of cells (0, 1000, 2000, 4000, 8000 and 16,000), plated in triplicate in 96-well plates and allowed to adhere for 8 h, were used to calculate the proliferation curve. The number of cells was then calculated using CellTiter 96® AQueous Non-Radioactive Cell Proliferation Assay (Promega, Madison, WI, USA) following manufacturer's instructions. For the assay, 4000 cells were plated for each cell line in triplicate in 96-well plates, and the total number of cells was calculated at different time points (0, 2, 4 and 6 days). Chondrogenic differentiation MSCs transduced with GFP, LMNA or PG were seeded into 96-well plates (Sarstedt, Inc., Barcelona, SP) at 2 × 10⁴ cells per well in DMEM with 10% FBS, 1% penicillin, 1% streptomycin, 1.5 × 10− 4 M monothioglycerol (MTG), 5 mg/mL ascorbic acid (AA), and 6 μg/mL transferrin (TRANS) (all from Sigma-Aldrich) to facilitate spontaneous spheroid formation. The medium was then changed after two days to chondrogenic medium composed of DMEM with 15% knockout serum (Gibco, Invitrogen, Barcelona, SP), 5 mg/mL AA, 6 μg/mL TRANS, 10 μM dexamethasone (DEX), 1 × 10− 7 M retinoic acid and 1 ng/mL recombinant human transforming growth factor-β3 (rhTGF-β3) (ProSpec-Tany TechnoGene, Deltaclon, Madrid, SP). This medium was changed every three days. After 21 days in the chondrogenic medium, the spheroids formed were collected, frozen and stored at − 80 °C for later analyses. For the N-acetyl-cysteine (NAC) pulses, spheroids were incubated with DMEM, 10% knockout serum (Gibco, Invitrogen), 1% penicillin and 1% streptomycin (Sigma-Aldrich) with 20 μg NAC for 1 h daily for three days prior to regular change of the differentiation media. Control spheroids were incubated under the same conditions in DMEM with 10% knockout serum, 1% penicillin, and 1% streptomycin without NAC..
(4) Adipogenic and osteogenic differentiation MSCs transfected with LMNA, PG or GFP were seeded into 96-well plates (Sarstedt Inc.) at 2 × 10⁴ cells per well in adipogenic or osteogenic commercial medium (Cambrex, Lonza, A Coruña, SP), following the manufacturer's instructions, to assess the mesoderm differentiation potential. Adipogenic cultures were stained with Oil Red O after 21 days of culture. For staining, the culture plates were fixed in 10 mM sodium periodate, 2% paraformaldehyde, 75 mM l-lysine dihydrochloride, and 37.5 mM dibasic sodium phosphate (Sigma-Aldrich) at pH 7.4 for 15 min at room temperature, then air dried and treated with a filtered solution of 0.3% Oil Red O to stain lipid droplets. After 21 days in culture, the osteogenic cultures were stained with alizarin red S to assess calcium deposits. Following fixation, the cells were covered with alizarin red S 2% aqueous solution at pH 4.2 (Sigma-Aldrich) for 3 min, then washed thoroughly with distilled water. RNA extraction and cDNA synthesis Total RNA was extracted from cultured cells using the Trizol L.S. reagent method (Invitrogen). Reverse transcription (RT) used the SuperScript II system (Invitrogen). Total RNA (2 μg) was reverse transcribed in a 20 μL reaction volume containing SuperScript II (200 units), random primers (25 μM), and dNTP (0.5 mM each) at 42 °C for 50 min. Real-time reverse transcriptase PCR (RT-PCR) analysis The reported sequences of genes for human SOX2 (forward: gtacccgcacttgcacaac; reverse: tcgctctcgttcagaagtctc), Nanog (forward: atgcctcacacggagactgt; reverse: aagtgggttgtttgcctttg), Oct3/4 (forward: ctcctggagggccaggaatc; reverse: atatacacaggccgatgtgg), SOX9 (forward: ctccgggacatgatcagc; reverse: ggtagtgctgggacatgtgaa), lipoprotein lipase (LPL) (forward: agaacatcccattcactctgc; reverse: ccatttgagcttcaacatgagt), fatty acid binding protein (FABP) (forward: ggatgataaactggtggtgga; reverse: cacagaatgttgtagagttcaatc), adiponectin (ADIPOQ) (forward: ggtgagaaaggagatccaggt; reverse: tgctgagcggtatacataggc), alkaline phosphatase (ALP) (forward: gacggacccgtcactctc; reverse: gtgcccgtggtcaattct), osteocalcin (OC) (forward: ggcgctacctgtatcaatgg; reverse: tcagccaactcgtcacagtc), Runx2 (forward: gtgcctaggcgcatttca; reverse: tgactggcggcgtgcaag), aggrecan (AGG) (forward: gcctacgaagcaggctatga; reverse: gcacgccataggtcctga) and RPLP (forward: tctacaaccctgaagtgcttgat; reverse: caatctgcagacagacactgg) as housekeeping were used for primer design. SOX9 was used to check the expression of genes involved in the early chondrogenic stage. Nanog and Sox2 were used to check the expression of genes involved in non-differentiation stages. Genes for human LPL, FABP and ADIPOQ, identified with early and late adipogenic differentiation, and ALP, OC and Runx2 with early and late osteogenic differentiation, were utilized to determine the success of differentiation. The amplification program consisted of an initial denaturation at 92 °C for 2 min followed by 40 cycles from 92 °C for 15 s, annealing at 61 °C for 30 s, and an extension at 72 °C for 15 s. Each PCR analysis was done in duplicate, with each set of assays repeated three times. To minimize effects of unequal quantities of starting RNA and to eliminate potential sources of inconsistency, relative expression levels of each gene were normalized to RPLP using the 2-ΔΔCt method (Livak and Schmittgen, 2001). Control experiments contained no reverse transcriptase. Histological, immunofluorescence and immunohistochemical analysis Spheroids engineered from MSCs following their differentiation into chondrocyte-like cells were frozen in OCT embedding matrix (BDH Chemicals, Poole, UK). Full-depth sections (4 μm) were cut with a cryostat and fixed in 4% (w/v) paraformaldehyde (Sigma-Aldrich) in PBS at pH 7.6. Some sections were stained with safranin O (Sigma-Aldrich) to evaluate the distribution of proteoglycans, others were immunostained with monoclonal antibodies against collagen type 1 (COL1; 1:1000), collagen type 2 (COL2; 1:50) and collagen type 10 (COLX ;1:2000), matrix metalloproteinase-13 (MMP-13; 1:200) and aggrecan (AGG ; 1:50) (Southern Biotechnologies, Birmingham, AL USA) and treated as described by Arufe et al. (2009). Biotinylated secondary antibodies were detected using a peroxidase-labeled biotin– streptavidin complex (Vectastain Elite kit; Vector Laboratories, Peterborough, UK) with diaminobenzidine substrate (Vector Laboratories) (1:1000). Normal mouse serum was used for the negative control, and the sections were not counterstained. Control-MSCs and transduced MSCs were grown in 8-chamber slides at a density of 2 × 10⁴ cells per chamber. When they reached 80% confluency, cells were fixed with paraformaldehyde 5% in phosphate.
(5) buffered saline and processed as previously described (Arufe et al., 2009) in order to study the nuclear morphology by immunofluorescence using mouse lamin A + C (Acris Antibodies) (1:100) as primary antibody and PE-anti rabbit (BD Science) (1:1000) as secondary antibody. Densitometry analysis AnalySIS Image Processing was used to quantify the expression of antibodies obtained by immunohistochemical analyses of sections of spheroids. Three 200 mm2 fields were quantified for each antibody; immunohistochemistry values were expressed in arbitrary units assigned by computer program. The values were expressed as percentage of positive cells for each of the markers studied. Immunoblot procedures Immunoblot analysis was performed on 20 μg of total protein extracted from cells in culture, as previously described (Matsushime et al., 1994). The antibodies used were mouse lamin A + C (Acris Antibodies), rabbit β-catenin (Santa Cruz Biotech., Santa Cruz, CA), rabbit notch-2 (Santa Cruz Biotech.), rabbit glycerol-3-phosphate dehydrogenase (GPDH) (Amersham), mouse MnSODM (Santa Cruz Biotech.), and rabbit AKT (Cell Signaling, Danvers MA). Secondary anti-mouse and anti-rabbit antibodies (Amersham) were used to visualize proteins by the ECL™ Western Blotting Analysis System (GE Healthcare, Amersham Biotechnology, UK). N = 3. Ideal concentrations for each antibody were determined empirically. Working concentrations were 1:1000 of the stock solutions. ROS measurement The percentage of positive cells after treatment with DCFH-DA-2′7′-dichlorofluorescein diacetate (Fluka) was calculated in triplicate as previously described (Cillero-Pastor et al., 2008). Briefly, 500,000 cells plated in 6-well plates were allowed to grow to 80% confluence, then incubated sequentially with or without NAC for 1 h, washed, and incubated with 10 μM DCFH-DA for 30 min. The cells were then recovered in a tube and analyzed using flow cytometry in a FACSAria instrument (Benton Dickinson). The percentage of positive cells was measured for each condition by fluorescent emission at 488 nm; basal levels calculated from the control without fluorophore were subtracted for each measurement. Oriented cell migration assay Cells were detached from regular Petri dishes after reaching a confluence of 80% and 50,000 cells of each cell line were seeded in triplicate on the upper compartment of a modified Boyden's chamber (Corning, Cultek SLU, Madrid, SP) in 200 μL of serum-free medium. The chambers were then introduced in 24well plates with either serum-free medium or serum-free medium supplemented with 10 ng/mL of stromal cell-derived factor-1 (SDF-1) or 50 pg/mL of interleukin-8 (IL-8) as chemotactic agents. After 24 hour incubation in normoxic conditions, cell migration through the filter were evaluated by trypan-blue cell staining and cell counting in 18 randomly selected microscopy fields. Statistics All experiments were done in triplicate and representative results are shown. Statistical analyses used were Student's t test and analysis of variance (ANOVA) using SPSS 16.0 (source). P < 0.05 was considered statistically significant — P < 0.1 for the chondrogenic differentiation with NAC..
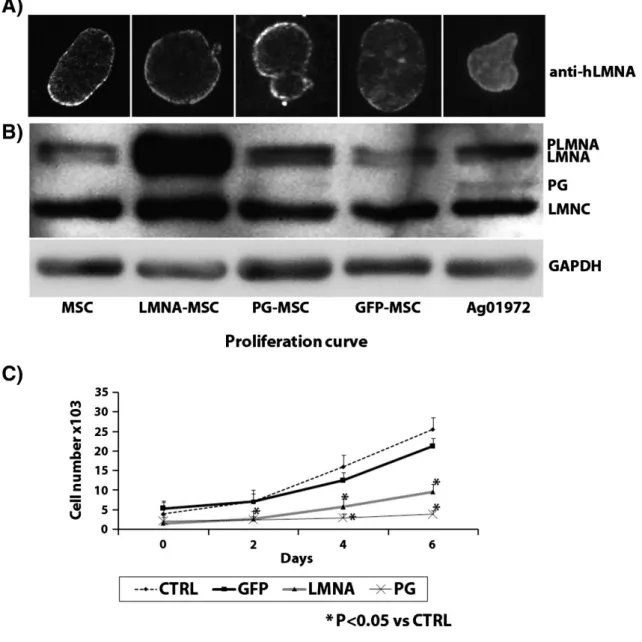
(6) Results LMNA and PG accumulation in LMNA-MSCs and PG-MSCs The expression of lamin isoforms in GFP-MSCs was similar to their expression in non-transduced MSCs. PG over-expression in PG-MSCs produced alterations in the nuclear membrane (blebs and LMNA accumulation), typical from PG-expressing cell lines (Fig. 1A). The efficiency of gene delivery and protein expression was determined using immunoblot analysis of the transduced cells with anti-lamin A + C antibody. Ag1972 HGPS cell line was included as a positive control. LMNA-MSCs showed accumulation of wild type (wt) LMNA and its precursor pre-lamin A (PLMNA) (Fig. 1B). PG-MSCs expressed the lower molecular weight isoform progerin (PG). Mild nuclear defects are only eventually detected in LMNA-MSCs. Furthermore, LMNA and PG over-expressing MSCs show a decrease in their proliferation rate (Fig. 1C).. Figure 1. Characterization of mesenchymal stem cells (MSCs) transduced with progerin (PG), lamin A (LMNA) or green fluorescent protein (GFP). Representative image of the immunofluorescence analysis of the nuclear distribution of LMNA using anti LMNA antibody (A). Representative image of Western-blot analysis using LMN A + C antibody from three experiments. Glyceraldehyde 3-phosphate dehydrogenase (GAPDH) was used as the housekeeping gene (B). Proliferation rate of the different cell lines (C). PLMNA = pre-LMNA; MSC = mesenchymal stem cells not transduced; Ag1972 = HGPS cell line..
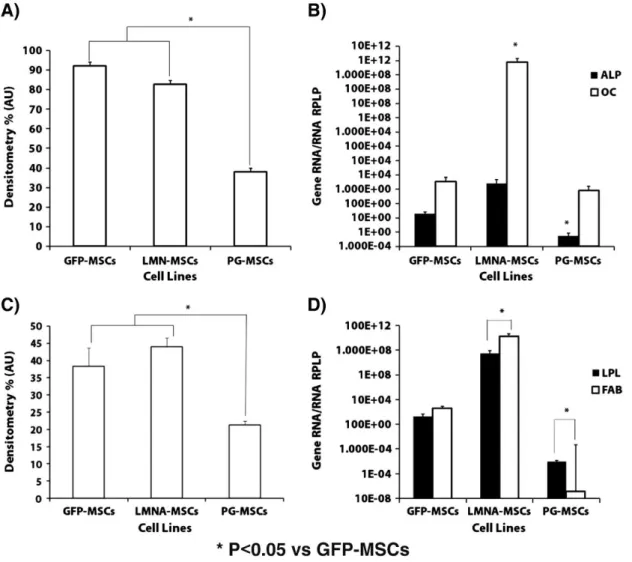
(7) GFP-MSCs differentiation potential comparing to that of non-transduced MSCs To use the GFP-transduced cells as controls for the differentiation study, we first characterized this cell line. The expression of stem cell genes, including Nanog, Oct4 and Sox9, was not significantly different when GFP-MSCs were compared to non-transduced MSCs as determined by real-time RT-PCR (Supplementary Fig. 1A). Primary chondrocytes used as a control did present a significantly (P < 0.05) higher expression of Sox9, an early chondrogenesis gene, compared to GFP-MSCs and non-transduced MSCs (Supplementary Fig. 1A). The directed differentiation of GFP-MSCs and non-transduced MSCs toward adipogenesis (Supplementary Figs. 1D–F), osteogenesis (Supplementary Figs. 1G–I) and chondrogenesis (Supplementary Figs. 1J–L), did not produce any significant differences between the two cell types when examined by immunohistochemistry and RT-PCR analyses. Differential potential of PG-MSCs and LMNA-MSCs vs GFP-MSCs After 21 days in osteogenic medium, almost 100% of the GFP- and LMNA-transduced cells were positive for alizarin red stain, compared with 40% of the PG-MSCs (Figs. 2A–B, Supplementary Fig. 2). Genetic studies revealed that LMNA-MSCs expressed the highest level of the OC gene, while PG-MSCs showed the significant (P < 0.05) lowest ALP expression (Fig. 2B).. Figure 2. Osteogenic and adipogenic potential of mesenchymal stem cells (MSCs) transduced with progerin (PG), lamin A (LMNA) or green fluorescent protein (GFP). Cultures were stained with alizarin red S to assess calcium deposits; densitometry analysis of calcium deposit staining (A). Real-time reverse transcriptase polymerase chain reaction (RT-PCR) analysis of the osteogenic differentiation genes ALP and OC for the three cell lines (B). Oil Red O staining of lipid vesicles; densitometry analysis of the Oil-Red staining (C). Real-time reverse transcriptase polymerase chain reaction (RT-PCR) analysis of the adipogenic differentiation genes LPL and FABP for the three cell lines (D). *P < 0.05 is considered significant using Student's t test versus GFP-MSCs..
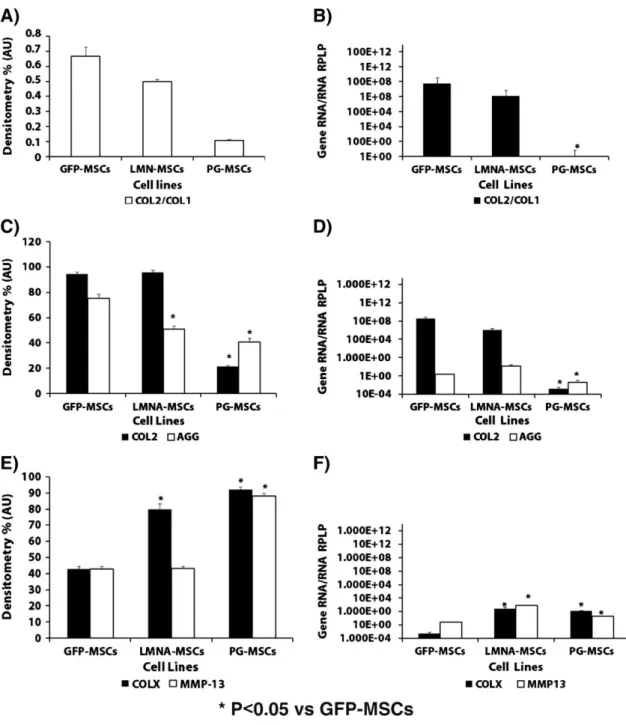
(8) Almost 45% of the seeded GFP-MSCs and LMNA-MSCs were positive for Oil Red O stain, showing adipogenesis, compared with 25% of the PG-MSCs (Figs. 2C–D, Supplementary Fig. 2). The expression of the LPL and FABP genes was significantly (P < 0.05) higher in LMNA-MSCs than in the GFP-MSCs controls, by as much as 100-fold. In contrast, the expression of these genes was lower in PG-MSCs than in GFP-MSCs (Fig. 2D). PG-MSCs present a chondrogenic characteristic ratio of COL2 to COL1 significantly much lower than LMNA-MSCs and GFP-MSCs, as revealed by immunohistochemistry (Fig. 3A) and RT-PCR (Fig. 3B). The histomorphologic study of chondrogenesis demonstrated that PG-MSCs had decreased staining for COL2 and safranin O (proteoglycans) compared to LMNA-MSCs and GFP-MSCs (Fig. 3C and Supplementary Fig. 2). These results were corroborated by real-time RT-PCR analysis of COL2 and AGG gene expression (Fig. 3D). Hypertrophy studies during chondrogenesis used immunohistochemistry to demonstrate the role of LMNA and PG in the process of MSC differentiation. Immunohistochemical analysis of the hypertrophy marker COLX demonstrates that this protein was significantly increased in both PG and LMNA-MSCs (Fig. 3E and Supplementary Fig. 2); this finding was validated by real-time RT-PCR (Fig. 3F). The gene expression of MMP-13, another classical hypertrophy marker, was significantly higher in LMNA and PG-MSCs (Fig. 3F). In this case, the immunohistochemical analysis showed a significant (P < 0.05) increase of MMP-13 only in PG-MSCs when compared to control GFPMSCs (Fig. 3E and Supplementary Fig. 2)..
(9) Figure 3. Chondrogenic potential and markers of hypertrophy during chondrogenic differentiation of mesenchymal stem cells (MSCs) transduced with progerin (PG), lamin A (LMNA) or green fluorescent protein (GFP). Densitometry of the immunostaining for collagen type 2 (COL2) and collagen type 1 (COL1). COL2/COL1 ratio is shown (A). Real-time reverse transcriptase polymerase chain reaction (RT-PCR) analysis of the COL2/COL1 ratio (B). Densitometry analysis of COL2 and safranin O staining of proteoglycans (C). Real-time reverse transcriptase polymerase chain reaction (RT-PCR) analysis of the chondrogenic differentiation genes COL2 and AGG (D) for the three cell lines. Densitometry analysis of the immunostaining for matrix metalloproteinase-13 (MMP13) and collagen type X (COLX) (E). Real-time reverse transcriptase polymerase chain reaction (RTPCR) analysis of hypertrophy markers COLX and MMP13 (F). *P < 0.05 was considered significant using Student's t analysis versus GFP-MSCs.. Role of reactive oxygen species Western-blot analysis showed that MnSODM expression is diminished in both PG-MSCs and LMNAMSCs compared to the control GFP-MSCs (Fig. 4A). The spontaneous production of ROS was significantly (P < 0.05) higher in PG-MSCs and LMNA-MSCs than in the control GFP-MSCs (Fig. 4B). Treatment of the cells for 1 h with NAC reduced the accumulation of ROS from the baseline levels (Fig. 4B)..
(10) Figure 4. Levels of manganese superoxide dismutase (MnSODM), reactive oxygen species ROS production of mesenchymal stem cells (MSCs) transduced with progerin (PG), lamin A (LMNA) or green fluorescent protein (GFP) and the effect on oriented migration capacity. Western blot analysis of the lamin isoforms and MnSODM in the three cell lines (A). Glyceraldehyde 3phosphate dehydrogenase (GAPDH) was used as the housekeeping gene. Flow cytometry of GFP-MSCs, LMNA-MSCs and PGMSCs after one hour incubation with N-acetyl-cysteine (NAC) or treatment with hydrogen peroxide (H2O2) (B). Iso = no treatment; NAC20 = 20 μg NAC; NAC40 = 40 μg NAC; H2O2 = 20 μg; DCFH = 10 μM 2′7′-dichlorofluorescein diacetate control. Modified Boyden's chamber assay of the three cell lines to test their oriented attraction capacity to SDF-1 and IL-8 (C). *P < 0.05 was considered significant using Student's t test versus GFP-MSCs..
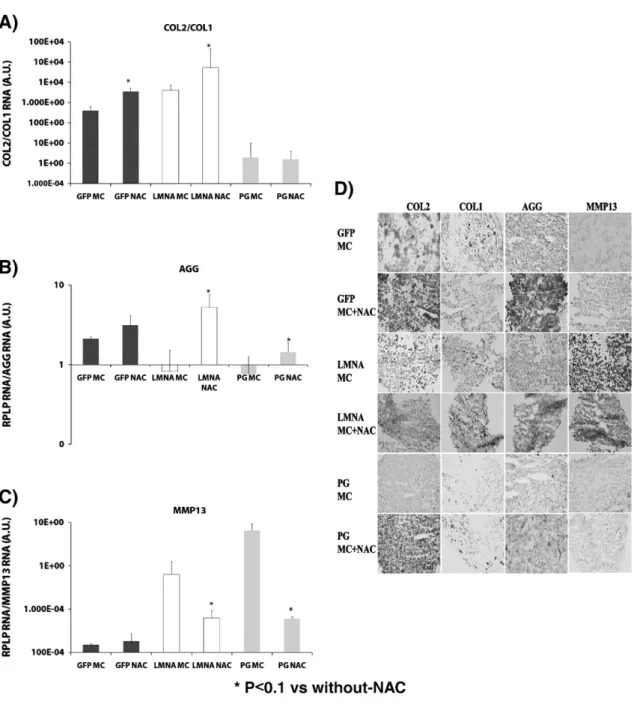
(11) Oriented migration capacity of PG-MSCs and LMNA-MSCs in a modified Boyden's chamber assay under the effect of two inflammation-related chemotactic agents, SDF-1 and IL-8, is significantly increased when compared to the control GFP-MSC cell line (Fig. 4C). To examine the role of ROS in chondrogenic differentiation of the three MSC lines, we analyzed the effect of NAC on the process. Real-time RT-PCR revealed a statistically significant (P < 0.1) increase in the COL2/COL1 ratio of gene expression levels in cells treated with NAC in the GFP-MSC and LMNAMSC cell lines (Fig. 5A). The PG-MSC line was not affected by treatment with NAC, although COL2 gene expression levels were significantly (P < 0.1) higher in NAC-treated compared to NAC-untreated PG-MSCs (data not shown).. Figure 5. Effect of reactive oxygen species (ROS) on chondrogenic differentiation of mesenchymal stem cells (MSCs) transduced with green fluorescent protein (GFP), lamin A (LMNA) or progerin (PG). GFP-MSCs, LMNA-MSCs and PG-MSCs were incubated with 20 μg of N-acetyl-cysteine (NAC). Read procedure in Material and methods. Real-time reverse transcriptase polymerase chain reaction (RT-PCR) analysis for markers of chondrogenic differentiation and hypertrophy COL2/COL1 ratio (A), AGG (B) and MMP13 (C) are shown. *P < 0.1 was considered significant using Student's t test versus controls without NAC treatment. (D) Representative images of the tissue section from immunohistochemistry analysis with different antibodies against COL2, COL1, AGG and MMP-13. Magnification: 20 ×..
(12) In NAC-treated cultures, compared to untreated controls, AGG gene expression increased (Fig. 5B) and MMP-13 gene expression decreased (Fig. 5C) in LMNA-MSC and PG-MSC cell lines. In GFPMSCs there were no significant changes in AGG and MMP-13 gene expression. As well as the same results were found by immunohistochemistry analysis (Fig. 5D). Discussion We have demonstrated that deregulation of LMNA in our previously characterized chondrogenic model compromised chondrogenic differentiation through, partially, redox imbalance. Lamin A is a key factor regulating both normal and accelerated aging as well as stem cell differentiation. Aging is defined as the accumulation of diverse deleterious changes occurring in cells and tissues with advancing age that are responsible for the increased risk of disease and death (Harman, 2003). Aging is now considered to be a very complex, multi-factorial process. Several aging theories have been proposed (Tosato et al., 2007), but no single theory explains all the major age-related physiological changes. Premature aging syndromes are used as models to partially understand molecular causes of normal aging changes. Among those syndromes, Hutchinson–Gilford Progeria Syndrome (HGPS) is one of the most studied. Recent studies have proposed that stem cell dysfunction enhances both normal and premature aging symptoms (Scaffidi and Misteli, 2008 and Zhang et al., 2011). To examine that premise in our model of mesoderm line differentiation, and, specifically, chondrogenic differentiation through spheroid formation employing human UC MSCs, we used a lentiviral system to efficiently deliver genes of wt LMNA, PG and GFP, as a control. Gene expression levels were determined by immunoblot; LMNA-MSCs accumulated wt LMNA and PG-MSCs accumulated PG. The low level of PG detected may reflect the low passage number of the cell line, but is similar to the level found in an HGPS-derived fibroblast cell line, AG01972. Besides, nuclear defects and a decrease in the proliferation rate, both typical from PG-expressing, pre-senescent cells, are detected in PG-transduced MSCs. Mild nuclear defects and a decrease in proliferation rate are also detected in LMNA-transduced MSCs, indicating that nuclear accumulation of the wild-type isoform could alter the nuclear lamina similarly to PG accumulation, which agrees with previously published data (Young et al., 2006). By contrast, GFP-MSCs present similar proliferation rate than non-transduced MSCs. Therefore, we decided to use the GFP-MSCs as control for the differentiation experiments. We previously characterized MSCs from human umbilical cord stroma by flow cytometry (Supplementary Fig. 3) which showed a similar percentage of positive cells for surface markers CD105, CD90 and CD73 and negative for CD45 and 34 as found in former works by Arufe et al. (2011). We demonstrated that GFP-MSCs retain a differentiation potential similar to that of non-transduced MSCs. We then used the GFP-MSCs as a control for differentiation experiments for several reasons. Unlike nontransduced MSCs, GFP-MSCs were transduced in parallel with the other cell lines that underwent lentiviral infection and puromycin selection. Also, GFP-MSCs over-express an exogenous protein. Extensive studies documented in the literature have verified that expression of GFP is innocuous for the cells. Finally, a recently published study demonstrated that lentiviral delivery of GFP into human UC MSCs did not affect their pluripotency (Qian et al., 2010). Alterations in the mesoderm differentiation potential were seen in the transduced cell lines, where osteogenesis, adipogenesis, and especially chondrogenesis were compromised in PG-MSCs compared to controls. In our model, we found calcium deposits secreted by PG-MSCs to be decreased after 21 days in osteogenic medium compared to GFPMSCs. One possible explanation for this might be the low level of expression of the ALP gene in these cells. In contrast, the significantly higher OC gene expression in LMNA-MSCs may indicate that osteogenesis is not altered in these cells. After 21 days in adipogenic medium, adipogenic capacity was lessened in PG-MSCs, demonstrated by a significantly lower expression of LPL and FABP genes than in control cells, as well as significantly lower (close to 50%) Oil Red staining. In contrast, LMNA-transduced cells show a significant increase in the expression of those adipogenic markers. Our results differ from those found previously by Kha et al. (2004). From their results, we would have expected to find an improved osteogenic potential in PG-MSCs because adipogenesis was reduced. One possible explanation for this unexpected result may be that all mechanisms of mesoderm differentiation in PG-MSCs were deregulated as a consequence of the overexpression of PG in our model. Chondrogenic differentiation in our model is affected by deregulation of LMNA, especially in PGMSCs, as revealed by a lowered COL2/COL1 ratio and lower expression of COL2 and AGG as shown by real-time RT-PCR. While our findings do not completely agree with the results of the study by Scaffidi and Misteli (2008), any discrepancies may be explained by the different gene delivery methods, different origins of the MSCs, and the different differentiation models employed..
(13) The hypertrophy markers, MMP-13 and COLX, were detected significantly elevated in PG-MSCs by immunohistochemistry, compared to control, after 21 days in chondrogenic medium. Also, LMNA-MSCs presented an increase in COLX, but not in MMP-13. Real-time analysis showed that these two hypertrophy markers were significantly elevated in both PG and LMNA-MSCs. These results were similar to those found in OA chondrocytes (Blanco et al., 2011). Mitochondrial dysfunction and oxidative stress are known to be responsible for deregulation of chondrogenesis (Ruiz-Romero et al., 2009 and Scott et al., 2010). We have previously reported that MnSODM is down-regulated in OA and that mitochondrial dysfunction and oxidative stress are responsible for deregulation of chondrogenesis (Blanco et al., 2011). Hence, we proposed to ascertain whether the diminished chondrogenic potential of LMNA-MSCs and PG-MSCs is linked to defects in MnSODM and oxidative stress imbalance. We investigated MnSODM levels at day 0. Western blot analysis demonstrated a decrease in total MnSODM in both cell lines, which was accompanied by a stable accumulation of ROS. This accumulation is partially, and dose-dependently, reversed by incubation of the cells with the antioxidant compound NAC, which acts as a ROS scavenger. Previously, a rapid and transitory increase in ROS generation in human MSCs from bone marrow has been proposed as the initial factor to sustain the migratory capacity of these cells (Busletta et al., 2011) suggesting a biphasic scenario for in vivo reparation of injured tissues. We decided to study if the migratory capacity in our in vitro model is altered in PG and LMNAoverexpressing umbilical cord MSCs. Modified Boyden's chamber assay shows that these cells present an increased oriented migration capacity activated by two inflammatory chemokines, SDF-1 and IL-8, when compared to control GFP-MSCs. It is not unreasonable to think that the stable increase in ROS generation that we detected in our MSC model when the expression of lamin A is permanently altered, may interfere with the chain of events that leads to a proper migration of this cells. Gene expression levels of COL2 and COL1 were measured by real-time RT-PCR after 21 days in chondrogenic medium with and without NAC. The COL2/COL1 ratio indicates that NAC treatment improves chondrogenic differentiation. This ratio is significantly higher in GFP-MSCs and LMNAMSCs, comparing NAC-treated and -untreated cells, but not in PG-MSCs, although the COL2 gene expression level was higher in NAC-treated compared to NAC-untreated PG-MSCs (data not shown). The hypertrophy phenotype is lessened by NAC treatment in LMNA- and PG-transduced cells, as shown by increased AGG and decreased MMP-13 gene expression levels. These results indicate that LMNAMSCs and PG-MSCs were more sensitive to NAC treatment because of an accumulation of ROS that correlates with a decrease in MnSODM protein levels. Our results are in agreement with those of Morita et al. indicating that ROS levels regulate the inhibition of proliferation and modulate the initiation of hypertrophic changes in chondrocytes (Morita et al., 2007) and with recent work demonstrating the importance of ROS levels during stem cell differentiation (Hao et al., 2011) (Aly et al., 2011). Conclusion Overall, our results show that chondrogenic differentiation of UC-MSCs is compromised by lamin A deregulation. We also demonstrated that this deregulation alters the oxidative stress balance in MSCs, modifies their migratory properties and induces defects in their capacity to differentiate into chondrocytes in our in vitro model. Further experiments are necessary to determine the in vivo significance of these alterations and to explore putative key targets for stem cell therapies in OA and other aging syndromes. The following are the supplementary data related to this article..
(14) Supplementary Fig. 1. Characterization of mesenchymal stem cells (MSCs) transduced with green fluorescent protein (GFP). Realtime reverse transcriptase polymerase chain reaction (RT-PCR) data for the expression of differentiation markers (A). GFP and 4′,6diamidino-2-phenylindole (DAPI) signals of a GFP-MSC spheroid (B) and a non-transduced MSC spheroid (C). Histological analysis of 21-day spheroids from GFP-MSCs (D, G and J) and non-transduced MSCs (E, H and K). Oil-Red staining (D and E); calcium deposit staining with alizarin red (G and H); and collagen type 2 (COL2) immunostaining (J and K); real-time RT-PCR analysis of differentiation genes for adipogenesis (F), osteogenesis (I) and chondrogenesis (M).*P < 0.05 is considered significant using Student's t test versus GFP-MSCs. CH = chondrocyte control. Magnification: 20 ×..
(15) Supplementary Fig. 2. Characterization of mesenchymal stem cells (MSCs) transduced with green fluorescent protein (GFP), lamin A (LMNA) or progerin (PG). Representative images of the tissue section stainings corresponding to the osteogenic (alizarin red), adipogenic (Oil Red O) and chondrogenic (COL2, COL1, safranin O, COLX and MMP13) differentiations of each transduced lineage..
(16) Supplementary Fig. 3. Characterization of mesenchymal stem cell population from human umbilical cord stroma. Flow cytometry of the surface markers; CD34, CD45, CD73, CD90 and CD105. In each diagram, at the top is the name of the marker, at the bottom the fluorochrome used and at the top right the percentages of positive cells. Isoty = Isotype.. Acknowledgments The authors wish to thank Mrs. Ma José Sánchez Dopico, Mrs. Purificación Filgueira Fernández and Mrs. Noa Goyanes for technical assistance, Mercedes Fernández for help with sequencing the cloning fragments, Berta Cillero-Pastor for helpful suggestions, Esther Rendal for supplying the umbilical cord stroma and Tom Misteli for plasmid donations. This study was supported by grants from the Servizo Galego de Saúde, Xunta de Galicia (PS07/86), Catedra Bioibérica de la Universidade da Coruña and Instituto de Salud Carlos III CIBER BBNCB06-010040; Fondo de Investigación SanitariaPI-11/02799. Alexandre de la Fuente holds a contract from Xunta de Galicia (2008), Spain..
(17) References Aly et al., 2011. A. Aly, K. Peterson, A. Lerman, L. Lerman, M. Rodriguez-Porcel. Role of oxidative stress in hypoxia preconditioning of cells transplanted to the myocardium: a molecular imaging study. J. Cardiovasc. Surg. (Torino), 52 (4) (2011), pp. 579–585. Arufe et al., 2009. M.C. Arufe, A. De la Fuente, I. Fuentes-Boquete, F.J. De Toro, F.J. Blanco. Differentiation of synovial CD-105(+) human mesenchymal stem cells into chondrocyte-like cells through spheroid formation. J. Cell. Biochem., 108 (1) (2009), pp. 145–155. Arufe et al., 2011. M.C. Arufe, A. De la Fuente, J. Mateos, I. Fuentes, F.J. De Toro, F.J. Blanco. Analysis of the chondrogenic potential and secretome of mesenchymal stem cells derived from human umbilical cord stroma. Stem Cells Dev., 20 (7) (2011), pp. 1199–1212. Attur et al., 2012. M. Attur, A. Ben-Artzi, Q. Yang, H.E. Al-Mussawir, H.J. Worman, G. Palmer, S.B. Abramson. Perturbation of nuclear lamin A causes cell death in chondrocytes. Arthritis Rheum., 64 (6) (2012), pp. 1940– 1949. Blanco et al., 2011. F.J. Blanco, I. Rego, C. Ruiz-Romero. The role of mitochondria in osteoarthritis. Nat. Rev. Rheumatol., 7 (3) (2011), pp. 161–169. Busletta et al., 2011. C. Busletta, E. Novo, L. Valfrè Di Bonzo, D. Povero, C. Paternostro, M. Ievolella, K. Mareschi, I. Ferrero, S. Cannito, A. Compagnone, A. Bandino, S. Colombatto, F. Fagioli, M. Parola. Dissection of the biphasic nature of hypoxia-induced motogenic action in bone marrow-derived human mesenchymal stem cells. Stem Cells, 29 (6) (2011), pp. 952–963. Cillero-Pastor et al., 2008. B. Cillero-Pastor, B. Caramés, M. Lires-Deán, C. Vaamonde-García, F.J. Blanco, M.J. López-Armada. Mitochondrial dysfunction activates cyclooxygenase 2 expression in cultured normal human chondrocytes. Arthritis Rheum., 58 (8) (2008), pp. 2409–2419. Eriksson et al., 2003. M. Eriksson, W.T. Brown, L.B. Gordon, M.W. Glynn, J. Singer, L. Scott, M.R. Erdos, C.M. Robbins, T.Y. Moses, P. Berglund, A. Dutra, E. Pak, S. Durkin, A.B. Csoka, M. Boehnke, T.W. Glover, F.S. Collins. Recurrent de novo point mutations in lamin A cause Hutchinson–Gilford progeria syndrome. Nature, 423 (2003), pp. 293–298 (England). Espada et al., 2008. J. Espada, I. Varela, I. Flores, A.P. Ugalde, J. Cadinanos, A.M. Pendas, C.L. Stewart, K. Tryggvason, M.A. Blasco, J.M. Freije, C. Lopez-Otin. Nuclear envelope defects cause stem cell dysfunction in premature-aging mice. J. Cell Biol., 181 (2008), pp. 27–35 (United States). Gruenbaum et al., 2003. Y. Gruenbaum, R.D. Goldman, R. Meyuhas, E. Mills, A. Margalit, A. Fridkin, Y. Dayani, M. Prokocimer, A. Enosh. The nuclear lamina and its functions in the nucleus. Int. Rev. Cytol., 226 (2003), pp. 1–62. Hao et al., 2011. Y. Hao, D. Cheng, Y. Ma, W. Zhou, Y. Wang. The relationship between oxygen concentration, reactive oxygen species and the biological characteristics of human bone marrow hematopoietic stem cells. Transplant. Proc., 43 (7) (2011), pp. 2755–2761. Harman, 2003. D. Harman. The free radical theory of aging. Antioxid. Redox Signal., 5 (5) (2003), pp. 557–561. Hennekam, 2006. R.C. Hennekam. Hutchinson–Gilford progeria syndrome: review of the phenotype. Am. J. Med. Genet. A, 140 (23) (2006), pp. 2603–2624. Hermida-Gómez et al., 2011. T. Hermida-Gómez, I. Fuentes-Boquete, M.J. Gimeno-Longas, E. Muiños-López, S. Díaz-Prado, F.J. de Toro, F.J. Blanco. Quantification of cells expressing mesenchymal stem cell markers in healthy and osteoarthritic synovial membranes. J. Rheumatol., 38 (2) (2011), pp. 339–349. Hernandez et al., 2010. L. Hernandez, K.J. Roux, E.S. Wong, L.C. Mounkes, R. Mutalif, R. Navasankari, B. Rai, S. Cool, J.W. Jeong, H. Wang, H.S. Lee, S. Kozlov, M. Grunert, T. Keeble, C.M. Jones, M.D. Meta, S.G. Young, I.O. Daar, B. Burke, A.O. Perantoni, C.L. Stewart. Functional coupling between the extracellular matrix and nuclear lamina by Wnt signaling in progeria, Dev Cell, 19, Elsevier Inc., United States (2010), pp. 413–425. Kha et al., 2004. H.T. Kha, B. Basseri, D. Shouhed, J. Richardson, S. Tetradis, T.J. Hahn, F. Parhami. Oxysterols regulate differentiation of mesenchymal stem cells: pro-bone and anti-fat. J. Bone Miner. Res., 19 (5) (2004), pp. 830–840. Lamas et al., 2010. J.R. Lamas, L. Rodríguez-Rodríguez, A.G. Vigo, R. Alvarez-Lafuente, P. López-Romero, F. Marco, E. Camafeita, A. Dopazo, S. Callejas, E. Villafuertes, J.A. Hoyas, M.P. Tornero-Esteban, E. Urcelay, B. Fernández-Gutiérrez. Large-scale gene expression in bone marrow mesenchymal stem cells: a putative role for COL10A1 in osteoarthritis. Ann. Rheum. Dis., 69 (10) (2010), pp. 1880–1885. Livak and Schmittgen, 2001. K.J. Livak, T.D. Schmittgen. Analysis of relative gene expression data using real-time quantitative PCR and the 2(-delta delta C(T)) method. Methods, 25 (4) (2001), pp. 402–408. Loeser, 2011. R.F. Loeser. Aging and osteoarthritis. Curr. Opin. Rheumatol., 23 (5) (2011), pp. 492–496. Mafi et al., 2011. R. Mafi, S. Hindocha, P. Mafi, M. Griffin, W.S. Khan. Sources of adult mesenchymal stem cells applicable for musculoskeletal applications — a systematic review of the literature. Open Orthop. J., 5 (Suppl. 2) (2011), pp. 242–248. Matsushime et al., 1994. H. Matsushime, D.E. Quelle, S.A. Shurtleff, M. Shibuya, C.J. Sherr, J.Y. Kato. D-type cyclin-dependent kinase activity in mammalian cells. Mol. Cell. Biol., 14 (3) (1994), pp. 2066–2076. Morita et al., 2007. K. Morita, T. Miyamoto, N. Fujita, Y. Kubota, K. Ito, K. Takubo, K. Miyamoto, K. Ninomiya, T. Suzuki, R. Iwasaki, M. Yagi, H. Takaishi, Y. Toyama, T. Suda. Reactive oxygen species induce chondrocyte hypertrophy in endochondral ossification. J. Exp. Med., 204 (7) (2007), pp. 1613–1623..
(18) Nagase et al., 2008. T. Nagase, T. Muneta, Y.J. Ju, K. Hara, T. Morito, H. Koga, A. Nimura, T. Mochizuki, I. Sekiya. Analysis of the chondrogenic potential of human synovial stem cells according to harvest site and culture parameters in knees with medial compartment osteoarthritis. Arthritis Rheum., 58 (5) (2008), pp. 1389–1398. Prokocimer et al., 2009. M. Prokocimer, M. Davidovich, M. Nissim-Rafinia, N. Wiesel-Motiuk, D.Z. Bar, R. Barkan, E. Meshorer, Y. Gruenbaum. Nuclear lamins: key regulators of nuclear structure and activities. J. Cell Mol. Med., 13 (6) (2009), pp. 1059–1085. Qian et al., 2010. H. Qian, X. Zhang, W. Xu, W. Zhu, H. Cao, Y. Chen, X. Xu, M. Wang, Y. Xie, J. Sun. Lentivirusmodified human umbilical cord mesenchymal stem cells maintain their pluripotency. Biotechnol. Appl. Biochem., 55 (2010), pp. 53–62 (England). Ruiz-Romero et al., 2008. C. Ruiz-Romero, V. Carreira, I. Rego, S. Remeseiro, M.J. López-Armada, F.J. Blanco. Proteomic analysis of human osteoarthritic chondrocytes reveals protein changes in stress and glycolysis. Proteomics, 8 (3) (2008), pp. 495–507. Ruiz-Romero et al., 2009. C. Ruiz-Romero, V. Calamia, J. Mateos, V. Carreira, M. Martinez-Gomariz, M. Fernandez, F.J. Blanco. Mitochondrial dysregulation of osteoarthritic human articular chondrocytes analyzed by proteomics: a decrease in mitochondrial superoxide dismutase points to a redox imbalance. Mol. Cell. Proteomics, 8 (2009), pp. 172–189 (United States). Scaffidi and Misteli, 2008. P. Scaffidi, T. Misteli. Lamin A-dependent misregulation of adult stem cells associated with accelerated ageing. Nat. Cell Biol., 10 (2008), pp. 452–459 (England). Scott et al., 2010. J.L. Scott, C. Gabrielides, R.K. Davidson, T.E. Swingler, I.M. Clark, G.A. Wallis, R.P. BootHandford, T.B. Kirkwood, R.W. Taylor, R.W. Talyor, D.A. Young. Superoxide dismutase downregulation in osteoarthritis progression and end-stage disease. Ann. Rheum. Dis., 69 (8) (2010), pp. 1502–1510. Tosato et al., 2007. M. Tosato, V. Zamboni, A. Ferrini, M. Cesari. The aging process and potential interventions to extend life expectancy. Clin. Interv. Aging, 2 (3) (2007), pp. 401–412. van Buul et al., 2012. G.M. van Buul, E. Villafuertes, P.K. Bos, J.H. Waarsing, N. Kops, R. Narcisi, H. Weinans, J.A. Verhaar, M.R. Bernsen, G.J. van Osch. Mesenchymal stem cells secrete factors that inhibit inflammatory processes in short-term osteoarthritic synovium and cartilage explant culture. Osteoarthr. Cartil., 20 (10) (2012), pp. 1186–1196. Wang et al., 2008. Y. Wang, A.A. Panteleyev, D.M. Owens, K. Djabali, C.L. Stewart, H.J. Worman. Epidermal expression of the truncated prelamin A causing Hutchinson–Gilford progeria syndrome: effects on keratinocytes, hair and skin. Hum. Mol. Genet., 17 (2008), pp. 2357–2369 (England). Worman et al., 2010. H.J. Worman, C. Ostlund, Y. Wang. Diseases of the nuclear envelope. Cold Spring Harb. Perspect. Biol., 2 (2) (2010), p. a000760. Young et al., 2006. S.G. Young, M. Meta, S.H. Yang, L.G. Fong. Prelamin A farnesylation and progeroid syndromes. J. Biol. Chem., 281 (2006), pp. 39741–39745 (United States). Zhang et al., 2011. J. Zhang, Q. Lian, G. Zhu, F. Zhou, L. Sui, C. Tan, R.A. Mutalif, R. Navasankari, Y. Zhang, H.F. Tse, C.L. Stewart, A. Colman. A human iPSC model of Hutchinson Gilford Progeria reveals vascular smooth muscle and mesenchymal stem cell defects, Cell Stem Cell, 8, Elsevier Inc, United States (2011), pp. 31–45 (A 2011).
(19)
Figure

+2
Documento similar