Aid, microfinance and income inequality: a global view
32
0
0
Texto completo
(2) Resumen Este artículo estudia la relación entre los flujos de Ayuda Oficial al Desarrollo (AOD) y de microfinanzas y la desigualdad de ingresos. Utilizando un amplio marco teórico sobre la desigualdad y datos de 87 países desde 1995 hasta 2012, mediante la metodología de los datos de panel estudiamos la relación entre la AOD y las microfinanzas y la desigualdad de ingresos. Nuestros resultados muestran diferencias importantes entre regiones, y la necesidad de considerar las características específicas de cada contexto al evaluar el impacto de la ayuda y de las microfinanzas en la desigualdad. En esta línea, se realiza también un análisis detallado de tres países: Bolivia, Bangladesh e Indonesia. Palabras clave: microfinanzas; Ayuda Oficial al Desarrollo; desigualdad de ingresos; panel de datos. JEL classification : C33; F35; G21; O15..
(3) 1. Introduction Inequality has recently emerged as one of the most controversial academic issues, particularly following reports by international institutions such as the UNDP (2013) and IMF (2014) that show how inequalities affect economic and social development. Inequality is important not only for its adverse and deplorable moral consequences, but also because it hampers processes of economic growth and development (Stiglitz, 2012; Ravallion, 2014). Furthermore, inequality matters because it can concentrate political and decision-making power in the hands of elites, leads to suboptimal use of human resources, and exacerbates political and economic instability and the risk of crisis (Dabla-Norris et al., 2015). Consequently, reducing income inequality is today at the heart of the international agenda, and the United Nations has proposed a stand-alone goal on inequality: the 10th Sustainable Development Goal (United Nations, 2017). To fight income inequality, countries can use both internal and external resources. However, developing countries, especially Least Developed Countries (LDCs), have limited domestic resources and weak internal redistribution systems. Likewise, in these countries, some external resources, like foreign direct investment, are expected to be low. Consequently, aid and microfinance flows become especially relevant, and may have the capacity to influence the evolution of inequality in several ways. For instance, microfinance may improve income equality through wider access for the poor to financial services, whereas foreign aid may align financial and fiscal reforms with capacity, through technical assistance services. However, the association between aid, microfinance and income inequality is still understudied. In this article, we quantitatively analyse the macro-level relationship between foreign aid, microfinance and income inequality, using appropriate panel data for 87 developing countries from 1995 to 2012. We base our empirical analysis in a detailed theoretical discussion of the potential associations between aid and microfinance flows and the evolution of income inequality, and complement it with three specific case studies (Bolivia, Bangladesh and Indonesia). Foreign aid – in the form of Official Development Assistance (ODA), which has reached a record amount of US$ 170.3 billion in 2016 from all donor countries (OECD, 2017), has been used in poverty and income inequality reduction programs (OECD-DAC, 2008). However, there is still substantial controversy concerning aid´s impact on inequality on receiving countries (Chong, et al., 2009;. Revista de Economía Mundial 52, 2019, 143-174.
(4) 146. David Castells-Quintana, José María Larrú, Maricruz Lacalle-Calderón. Herzer & Nunnenkamp, 2012). Microfinance, which emerged and consolidated during the eighties and nineties as a complementary approach to financing development, has also become a major policy tool aimed at promoting social and financial inclusion, job creation, social cohesion and inequality reduction (Balkenhol & Gueìzennec, 2014). However, very little empirical research has been conducted to identify the impact of microfinance on income inequality at the macro-level, probably due to the lack of reliable data on microfinance, which has only recently become available (Bauchet & Morduch, 2010; Imai et al., 2012). To the best of our knowledge, only two articles analyse the inequality reduction effect of microfinance at the macro-level (Hermes, 2014; Kai & Hamori, 2009), but relying on cross-sectional data. None of these papers studies the coevolution of aid and microfinance as potential factors explaining inequality. This paper tries to fill this gap in the literature. The rest of the manuscript is organised as follows. Section 2 theoretically discusses the mechanisms for aid and microfinance flows to potentially influence income inequality. Section 3 looks at the data, presenting some descriptive analysis. In Section 4, we estimate an empirical model that allows us to explore the relationship between aid and microfinance and inequality. Section 5 discusses in detail three case studies: for Bolivia, Bangladesh and Indonesia. Finally, Section 6 offers some conclusions.. 2. Theoretical framework and related literature To frame our analysis, in Figure 1 we try to show the complex relationship between the allocation of internal and external resources and the evolution of income inequality within countries. Any country seeking for a more egalitarian income distribution has two main sources to achieve this objective: domestic resources (namely internal redistribution) or external resources (where foreign aid and some microfinance flows may be included). Policy markers may use both domestic and external financial flows to influence income inequality through a variety of channels. Following Cornia (2014), we have integrated the main determinants of income inequality in five dimensions or groups of variables: internal redistribution and social expenditure, human capital and labour market, political regimes and institutions, macroeconomic conditions and macro-stability, and external redistribution. Income distribution is determined by wages and salaries in a pre-fiscal phase (or the so-called “market incomes”) and by taxes and transfers in a second phase (the so-called “disposable incomes”). Market incomes are strongly influenced by human capital, productivity and returns to education (Lustig, 2011; Rodríguez-Castelán et al., 2016).1 Also, labour market institutions, by influencing employment levels and wages, determine the evolution of inequality (Calderón & Chong, 2009). Gender gap in earnings is an additional 1 See Manacorda et al. (2010) for a wider discussion on returns to education in Latin America..
(5) Aid, Microfinance and Income Inequality: A Global View. 147. Fig. 1. Potential channels to fight inequality.. Domestic resources. - Taxes. - Transfers - Wages & salaries. Internal redistribution & social expenditure Human capital & labour market Political regimes & institutions. External resources. - Microfinance - Foreign aid - FDI - Portfolio investment - Remittances. Income inequality. Macroeconomic conditions & stability External redistribution. Source: Authors´ elaboration.. variable to be considered (Piketty et al., 2016). Finally, formal and informal employments and salaries can also be significant to explain income inequality in some countries (Amarante, 2016).2 Internal redistribution and social expenditure also influence inequality. Internal redistributive and social policies influence transfers and tax collection systems (Alesina & Giuliano, 2010). These policies are influenced by subjective factors, such as beliefs (Benabou & Tirole, 2006), ideology (Alesina et al., 2012), group identity (Costa-Font & Cowell, 2016), or perception of fairness (Durante et al., 2013). Net direct taxes are generally equalising (due to the progressivity effect), whereas indirect taxes (usually regressive) tend to increase inequality (Lustig, 2016).3There are some examples of successful progressive redistributive policies: IMF (2014) and World Bank (2016a) for Brazil; or World Bank (2016b) for Chile.4 2 Amarante (2016) shows how formal salaries increased income inequality in Argentina, Ecuador, Bolivia, Brazil and Uruguay whereas informal wages reduced it, especially in Bolivia and Ecuador. Self-employment in Ecuador and Argentina and transfers in Argentina and Uruguay, also contribute to inequality reduction during 2002-2011. 3 Lustig (2016) shows a redistributive effect of the indirect taxes in nineteen out of twenty-eight countries. The in-kind transfers (through higher education and health services) were also equalizing. But the author reports that the effect on poverty is not always clear. She detected the so-called “fiscal impoverishment effect”, when the transfers are too small to compensate for what the poor pay in taxes. She reports this effect for twelve developing countries. That means that a net fiscal system can be equalizing but poverty-increasing. 4 IMF (2014) and Piketty et al. (2017) particularly remark that exempts in personal income taxes and energy subsidies are one of the worse practices for egalitarian policies.. Revista de Economía Mundial 52, 2019, 143-174.
(6) 148. David Castells-Quintana, José María Larrú, Maricruz Lacalle-Calderón. Political regimes and institutions also play a role in income distribution. On the one hand, democracies can show higher inequality levels than autocracies, because they tend to pay higher wages in manufactures (Rodrik, 1999), have more protection to property rights (Amendola et al., 2013), and prioritise the short-run consumption expenses over the long-run redistributive investments (Huntington, 1968). High rent-seeking behaviour and corruption practices also lead to higher inequality. On the other hand, democracies can show lower inequality levels since they have higher taxes to GDP ratios, higher secondary enrolment ratios, and perform more structural reforms (Brown, 1999; Acemoglu et al., 2015). Good macroeconomic conditions and stability can spur economic growth. If this growth is inclusive, it can reduce inequality (Ravallion, 2014; Kireyev & Chen, 2017). On the contrary, output volatility tends to increase inequality (López & Perry, 2008). The exchange rate regime, external and public debt, and domestic saving capacity are also macro variables linked to inequality (Cornia, 2011). Finally, external redistribution, through foreign aid and microfinance, may also help to reduce income inequality (Cornia & Martorano, 2013). For instance, aid and microfinance flows may act as complementary resources for programmes to enhance labour skills, entrepreneurship and the quality of human capital, vocational training, the efficiency of labour market institutions, collective bargaining, and more, with the potential to benefit those in the low part of the income distribution. In the rest of this section we seek to explain in more detail the potential impact of aid and microfinance on income inequality. The potential impact of aid and microfinance flows on income inequality: Although both foreign aid and microfinance are funding tools for development and have very similar objectives, their characteristics and dynamics are not the same. The channels by which aid affects inequality may be different than those of microfinance. Therefore, it is important to analyse how each tool behaves and may affect income inequality. Aid and microfinance can exert their influence on inequality indirectly (modifying public policies, political stability, macroeconomic management -e.g. through conditionality in the aid case-, and labour market and institutions), or directly, when the resources reach the poorest, assuming all the rest remains equal. In what follows we develop these channels in more detail. Following with Figure 1, foreign aid can influence inequality through various channels (see Castells-Quintana & Larrú, 2015, for a detailed framework and evidence for Latin America). Firstly, aid can spur redistributive policies through technical assistance related to taxes and transfers, or even through conditionality linked to structural reforms and macroeconomic stability (e.g. low inflation rates and budget deficit). Multilateral aid is accustomed to this instrument (Temple, 2009). Programmes aimed at improving real exchange rates and terms of trade may help to reduce income inequality (Cornia & Martorano, 2013). Secondly, aid can be used for better governance. Aid.
(7) Aid, Microfinance and Income Inequality: A Global View. 149. flows, especially when channelled through non-state actors, can strengthen trade unions activities, leading to better labour market institutions (European Commission, 2002). Thirdly, aid in terms of debt relief can also help improve income distribution (Ndikumana, 2004). This is expected if debt relief frees up resources to be invested in pro-poor projects such as debt-for-education (Cassimon et al., 2009), or debt-for-health swap programmes (Cassimon et al., 2008). In the same line, as aid is fungible, more public resources, in cash or in-kind transfers, may be channelled to the lowest income quintiles, improving income distribution. Fourthly, this aforementioned effect is even clearer if aid channelled through direct budget support is considered. Aid might feed the budgets for conditional cash transfer programmes. Their impact on inequality has been well documented in the literature (Lustig, 2011 and 2016), although their effects on inequality can be low if their volume is not big enough (Amarante & Brun, 2016; Bastagli et al., 2016). Finally, aid projects and programmes focused on education, nutrition and health care may have significant long-run impacts on earnings and opportunities for the destitute (Asiedu & Nandwa, 2007; Dreher et al., 2008; Wilson, 2011). Microfinance —this is, financial services targeting small-scale entrepreneurial activities of the poor who may otherwise be financially excluded—5 can also influence inequality. The primary goal of microfinance is to reduce disparities in the access to financial resources (Roodman, 2012). Financial markets have traditionally failed to reach the poor, as they lack collateral due to asymmetrical information problems, high transaction costs and difficulties enforcing contracts (Armendariz & Morduch, 2010). In most cases, the poor face great difficulties in acquiring the capital needed to save or to start up productive initiatives, and thus to improve their well-being (Robinson, 2001). By reducing information problems and transaction costs, microfinance extends financial intermediation—that is, reduces credit constraints on the poor— making it possible for them to take advantage of investment opportunities (Armendariz & Morduch, 2010). Financial market failures are actually considered to be one of the most important causes of inequality in developing countries (Hermes, 2014; Li et al., 1998). Consequently, extending financial intermediation through microfinance services provides the possibility to finance more productive investments from the bottom segments of the population, and can therefore reduce income inequality (Dabla-Norris et al., 2015; Zahonogo, 2017).6 Microfinance can thus have a positive impact on inequality reduction because it disproportionately gives opportunities to the poor rather than the rich (Hermes, 2014). However, contrary to this position, some authors have raised concerns and showed negative side effects of microcredits (see for instance Bateman, 2012). Specifically, authors such as Mansour and Mendel (2015) affirm that 5 Includes not only small-scale loans—known as microcredits—but also savings accounts, insurance, housing loans and other financial services to the poor (CGAP, 2009). 6 Ahlin & Jiang (2008) and Mahjabeen (2008) are two theoretical models finding that microfinance reduces inequality.. Revista de Economía Mundial 52, 2019, 143-174.
(8) 150. David Castells-Quintana, José María Larrú, Maricruz Lacalle-Calderón. financial deepening will not reduce inequality, since low-income populations do not (and never will) benefit from any financial development. In sum, when that aid and microfinance flows are able to reach the poorest, ceteris paribus, poverty and income are reduced. Our goal in this article is precisely to study how aid and microfinance relate to income inequality. In the next sections, we address the issue from an empirical perspective.. 3. Data and descriptive analysis 3.1. Data Our key dependent variable is income inequality (measured through the GINI index. Despite its acknowledged shortcomings (such as its higher sensitivity to the income of the middle classes than that of the extremes, or that two countries with very different distributions may yield the same value of the index), the Gini index is the most commonly used measure for income inequality. Three main sources provide world-wide cross-country inequality data: 1) The World Income Inequality Database (WIID), developed by UNU-WIDER,7 2) The All the Ginis 1950-2012 Database, developed by Milanovic (2014) and available at the World Bank,8 and 3) The Standardized World Income Inequality Database (SWIID), developed by Solt (2009)9. Researchers must choose between comparability (homogeneous sources such as “identical” household surveys versus national accounts) and coverage (Jenkins, 2015; Cornia & Martorano, 2017).10 Briefly, while SWIID allows for larger coverage, comparability is maximised with the All the Ginis database, which relies on household surveys only and is therefore considered to be more homogeneous. Given the nature of our panel data (yearly structure for developing countries), maximizing comparability is crucial and we consequently rely on the All the Ginis database.11 Our key independent variables are aid and microfinance. The first one, measured through the total net ODA received by each country and each year as a percentage of its GDP (Aid). Data for aid has been obtained from the DAC-OECD Database (OECD, 2017). The second one, the country’s macroscale of microfinance activities, has been measured through the microcredit 7 Available at: https://www.wider.unu.edu/project/wiid-–-world-income-inequality-database 8 Available at: http://data.worldbank.org/data-catalog/all-the-ginis 9 Available at: http://myweb.uiowa.edu/fsolt/swiid/swiid.html 10 Cornia & Martorano (2017) point out these shortcomings: survey design; assumptions and data harmonization; top incomes and tax returns; trends in the labour share of total incomes; assets held abroad; price dynamics between food process and overall CPI; and differences in the provision of the “social wage” across countries. Also see Ferreira et al. (2015) for a description of the characteristics and limitations of each database. 11 SWIID (Solt, 2009) and All the Ginis (Milanovic, 2014) correlate highly. We perform some robustness analysis using SWIID data. We have also done some robustness checks using other inequality indices when available. For Latin American countries, for instance, we have Theil and Atkinson values (from SEDLAC), and their correlation with Gini coefficients is higher than 0.95 in both cases, yielding similar results that when using the Gini..
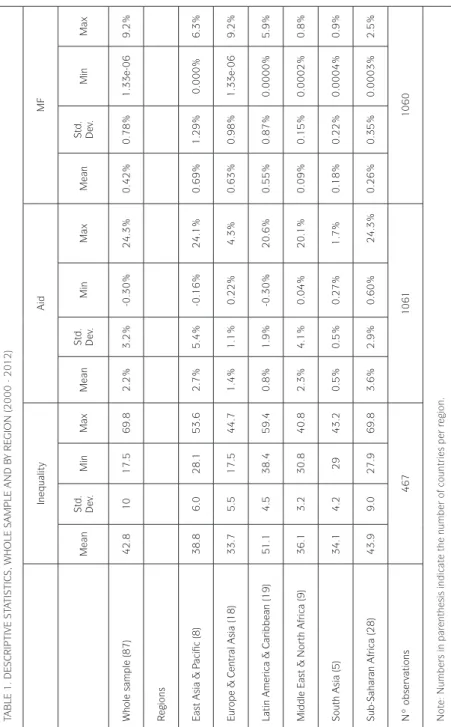
(9) Aid, Microfinance and Income Inequality: A Global View. 151. gross-loan-portfolio as a percentage of the GDP in each country and each year (MF). This data comes from the Microfinance Information Exchange (MIX MF) Market database (Mix Market, 2015), the best and largest database on the microfinance sector (Cull et al., 2011). Today, the MIX Market database contains information provided by over 2,000 microfinance institutions (MFIs) throughout the world and covers nearly 100 million borrowers. Table A.1 in Appendix A defines all variables and their sources in detail (including control variables later used in the econometric analysis). The records collected from these sources were matched by country and year, and made comparable. After removing the country-year observations that could not be properly matched, we were left with an unbalanced panel-data set covering a total of 87 developing countries over the period 1995–2012. Data limitations such as missing values limit the analysis to this period. A list of the countries in our sample is provided in Table A.2 of Appendix A.12 Table A.3 of Appendix A provides summary statistics for all variables included in the analysis.. 3.2. Descriptive analysis on aid, microfinance and inequality Table 1 provides some descriptive statistics of our three key variables: inequality, aid and microfinance. As it can be seen, the mean level of inequality in our whole sample of developing countries is very high (Gini of 42.8). Concerning aid and microfinance, the volume of aid received by all the countries in our sample is more than five times higher than the total volume of microfinance activities implemented. Looking at figures in different world regions, some interesting facts can be highlighted. Regarding inequality, Latin America & the Caribbean is the region with the highest average level, followed by Sub-Saharan Africa and the two Asian regions. Regarding aid, Sub-Saharan Africa is the region receiving the highest volumes (as share of its GDP). East Asia & Pacific also receives a large amount of its GDP in the form of aid, being South Asia and Latin America & the Caribbean the regions receiving the smallest share of their GDP in the form of aid. Concerning microfinance, the largest share of the total volume of microfinance activities is concentrated in East Asia & Pacific and Europe & Central Asia, followed by Latin America & the Caribbean. The smallest share of total microfinance is found in the Middle East & North Africa. Figure 2 shows the evolution of inequality, aid, and microfinance in our sample (mean across countries). As it can be seen, the volume of aid received has remained relatively constant over the analysed period, while microfinance has experienced a steady growth. Inequality shows more variability, with a significant increase since 2008. More details of these evolutions by world regions can be observed in Figure B.1 in Appendix B. 12 The sample comprises all countries that are foreign aid recipients and that have a microfinance sector, that is, all countries for which there are data on aid and microfinance.. Revista de Economía Mundial 52, 2019, 143-174.
(10) 33.7. 51.1. 36.1. 34.1. 43.9. Europe & Central Asia (18). Latin America & Caribbean (19). Middle East & North Africa (9). South Asia (5). Sub-Saharan Africa (28). 9.0. 4.2. 3.2. 4.5. 5.5. 6.0. 10. Std. Dev.. 467. 27.9. 29. 30.8. 38.4. 17.5. 28.1. 17.5. Min. 69.8. 43.2. 40.8. 59.4. 44.7. 53.6. 69.8. Max. Note: Numbers in parenthesis indicate the number of countries per region.. Nº observations. 38.8. 42.8. East Asia & Pacific (8). Regions. Whole sample (87). Mean. Inequality. 3.6%. 0.5%. 2.3%. 0.8%. 1.4%. 2.7%. 2.2%. Mean. TABLE 1. DESCRIPTIVE STATISTICS, WHOLE SAMPLE AND BY REGION (2000 - 2012). 2.9%. 0.5%. 4.1%. 1.9%. 1.1%. 5.4%. 3.2%. Std. Dev.. 1061. 0.60%. 0.27%. 0.04%. -0.30%. 0.22%. -0.16%. -0.30%. Min. Aid. 24.3%. 1.7%. 20.1%. 20.6%. 4.3%. 24.1%. 24.3%. Max. 0.26%. 0.18%. 0.09%. 0.55%. 0.63%. 0.69%. 0.42%. Mean. Min. 0.0003%. 0.0004%. 0.0002%. 0.0000%. 1.33e-06. 0.000%. 1.33e-06. 1060. 0.35%. 0.22%. 0.15%. 0.87%. 0.98%. 1.29%. 0.78%. Std. Dev.. MF. 2.5%. 0.9%. 0.8%. 5.9%. 9.2%. 6.3%. 9.2%. Max. 152 David Castells-Quintana, José María Larrú, Maricruz Lacalle-Calderón.
(11) Aid, Microfinance and Income Inequality: A Global View. 153. Fig. 2. Evolution of aid, microfinance and inequality. Authors’ elaboration with data from: Milanovich (2014); MIX Market (2015); OECD (2017).. Table 2 shows correlations between our key variables, for the whole sample and by world regions. We find a negative correlation between aid and inequality and between microfinance and inequality for the whole sample, although they are very low (-0.14 and -0.04 respectively). When we analyse by regions, we find no clear pattern. Only for East Asia & Pacific we find negative and relatively high correlations between aid and inequality and between microfinance and inequality. Regarding aid and microfinance, there seems to be no significant correlation between the two (except in Middle East & North Africa where it is 0.77).13. 13 For more details on the correlations between our key variables by world region see Figures B.2 and B.3 in Appendix B.. Revista de Economía Mundial 52, 2019, 143-174.
(12) 154. David Castells-Quintana, José María Larrú, Maricruz Lacalle-Calderón. Table 2. Correlations among key variables, whole sample and world regions Inequality - Aid. Inequality - MF. Aid - MF. World. -0.144. -0.037. 0.021. East Asia & Pacific. -0.364. -0.48. 0.479. Europe & Central Asia. 0.058. -0.006. 0.306. Latin America & the Caribbean. 0.285. -0.162. 0.182. Middle East & North Africa. 0.039. 0.129. 0.772. South Asia. 0.463. 0.108. 0.182. Sub-Saharan Africa. -0.156. -0.268. -0.072. Note: Pearson correlations calculated by authors. Italic numbers indicate significance at 5% level.. 4. Econometric analysis and results To complement the descriptive analysis carried out in the previous section, we perform a simple econometric analysis of the relationship between aid and microfinance flows and income inequality. To quantitatively capture all direct and indirect effects, we would have to evaluate each specific mechanism discussed in Section 2. As most of the existing evaluations do not focus on distributive effects of aid, this is difficult to do. In line with previous studies, we have instead decided to look at the aggregate effect of microfinance and aid relying on a reduced-form specification. To do this we run cross-country regressions where we control for possible relevant factors associated with inequality. Hence, we use our panel data to estimate a model like the one in Equation (1): Inequalityit=α1MFit-1+βAidit-1+ψXi t-1+εit. (1). Where Inequalityit is income inequality, measured through the Gini Index, in country i in time t; MF is the macro scale of microfinance activities, measured through the Gross Loan Portfolio as percentage of the GDP, in country i in time t; Aidi is foreign aid, measured through the net ODA received as percentage of the GDP; X potential factors influencing income inequality, and εit a countrytime specific shock. As control variables X, we follow the literature and include those variables that have shown to be related to income inequality and explained in Section 2 (see Table A1 in Appendix A for all the details). We estimate Equation (1) considering as many countries as possible and the longest time span depending on data availability: 1995-2012. All right-handside variables are included one period before to reduce problems of reverse causality. All estimations are done clustering errors at the country level. Time.
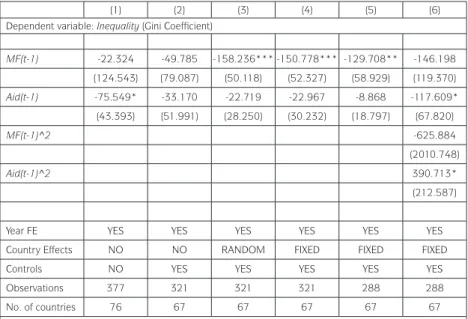
(13) Aid, Microfinance and Income Inequality: A Global View. 155. effects are included to control for global shocks. Several panel data techniques are implemented, including Ordinary Least Squares (pooled-OLS), Random Effect (RE) and country-Fixed Effects (FE), to control for country-specific characteristics.. 4.1. Main results Table 3 presents main results. Columns 1 and 2 display pooled-OLS estimates: while column 1 only considers our two key variables, MF and Aid, column 2 introduces main controls. Column 3 displays RE estimates and column 4 displays FE estimates. Column 5 displays FE estimates but considering data only from the year 2000 onwards, as the quality of microfinance data before 2000 is very scarce (Mix Market, 2015). Finally, column 6 considers quadratic associations between our key independent variables and inequality. Table 3: main results (1). (2). (3). (4). (5). (6). Dependent variable: Inequality (Gini Coefficient) MF(t-1). Aid(t-1). -22.324. -49.785. (124.543). (79.087). -158.236*** -150.778*** -129.708** (50.118). (52.327). -146.198. (58.929). (119.370) -117.609*. -75.549*. -33.170. -22.719. -22.967. -8.868. (43.393). (51.991). (28.250). (30.232). (18.797). MF(t-1)^2. (67.820) -625.884 (2010.748). Aid(t-1)^2. 390.713* (212.587). Year FE. YES. YES. YES. YES. YES. YES. Country Effects. NO. NO. RANDOM. FIXED. FIXED. FIXED. Controls. NO. YES. YES. YES. YES. YES. Observations. 377. 321. 321. 321. 288. 288. 76. 67. 67. 67. 67. 67. No. of countries. Note: Controls include GDPdeflator, Eco_growth, Gov_exp, FDI, Democ, all lagged one period. In columns 1 to 4 the time span goes from 1995 to 2012. In column 5 the time span goes from 2000 to 2012. Robust standard errors (clustered by country) in parentheses. *** p<0.01, ** p<0.05, * p<0.1. Results in Table 3 yield negative coefficients for both microfinance and aid. However, the coefficient for aid is only statistically significant in column 1, while the coefficient for microfinance is significant in columns 3, 4 and 5 (RE and FE estimates). OLS estimates capture both variation between countries as well as variation within countries over time, and can be considered as capturing a. Revista de Economía Mundial 52, 2019, 143-174.
(14) 156. David Castells-Quintana, José María Larrú, Maricruz Lacalle-Calderón. long-run association (Baltagi & Griffin, 1984; Pirotte, 1999). By contrast, FE estimates consider only variation within countries over time, so results can be interpreted as related to the short run (Partridge, 2005). Taking this into account, our results would suggest that aid may be significantly associated with inequality in the long run, and microfinance may be significantly associated with inequality in the short run. Further, since results in Table 3 may hide potential non-linearites in the relationship between microfinance and aid flows and income inequality, in line with Shafiullah (2011), we explore this possibility considering quadratic effects for aid and microfinance (Column 6 in Table 3). We find a significant U-shaped relationship between aid and inequality; inequality first decreases, then increases with aid. This could also suggest different patterns across countries in the allocation and impact of aid. As a robustness check to results in Table 3, we have estimated the same regressions but considering microfinance and aid flows in per capita terms. We have also aggregated the data in 3-year periods, to reduce short-run noise but at the expense of losing observations. Results are presented in Table C.1 in Appendix C. Coefficients for microfinance and aid keep their negative signs, but are no longer significant.. 4.2. Results by world region Given the nature of our results so far, in Table 4 we explore potential differences across world regions in the association between microfinance and aid and inequality. To do so, we introduce regional dummies and interact our key variables, MF and Aid, with these dummies. As in Table 3, we present results by OLS (with and without controls), RE and FE. Results in Table 4 show substantial differences across regions. For microfinance, the coefficient is always negative and significant for Latin America & the Caribbean. For East Asia & Pacific, we also find a negative coefficient, significant under RE and FE estimates. For the other regions, we find no significant coefficients under any estimation technique. For the case of aid, the results have an even more unclear pattern. In East Asia & Pacific, the results are similar to those of microfinance: a negative coefficient, significant under RE and FE. For Latin America & the Caribbean, the results are somehow unexpected; there is a positive and significant coefficient under OLS and RE estimates. For South Asia, the coefficient is also positive and significant under OLS, but becomes negative and significant under RE and FE. For the Middle East & North Africa, we find a positive and significant coefficient under RE and FE estimates. Finally, for Sub-Saharan Africa we find non-significant results.14 14 However, when we consider non-linearites by regions, we do find significant results for aid in SSA; inequality first declines with aid to then increase. In fact, our significant quadratic relationship between aid and inequality found for the world sample seems to be driven by countries in SSA and Europe and Central Asia..
(15) Aid, Microfinance and Income Inequality: A Global View. 157. These mixed results found by region point towards the difficulty of generalizing about the relationship between aid and microfinance and inequality. In any case, results suggest that the negative coefficients for microfinance found in Table 3 are mainly driven by countries in Latin America and East Asia & Pacific. However, for the case of aid, negative results seem to be mainly driven by East Asia & Pacific, with other regions displaying opposing (positive) coefficients. Table 4: results by world region (1). (2). (3). -114.817. -397.694*. 98.810. 122.188. (4). (5). Dependent variable: Inequality (Gini Coefficient). MF* East Asia & Pacific Europe & Central Asia Latin Ame & the Caribbean. -303.018 136.034 -100.404*. -598.694** -640.956*** 121.856. 174.517. -99.718* -166.065*** -169.275*** -171.517***. Middle East & North Africa. 592.811. 871.997. 176.195. 306703. 196871. South Asia. -233.286. 137.465. -29.666. -140.577. -259.688. Sub-Saharan Africa. -346.799. -195.174. 397.409. 513.793. 442338. East Asia & Pacific. -186.912. -208.561. Europe & Central Asia. -42.786. -79.943. Aid* -433.869** -870.041*** -992.591*** -2.431. Latin Amer & the Caribbean 178.715*** 172.665*** 118.555** Middle East & North Africa South Asia Sub-Saharan Africa. -6.82. -121.046. -4.272. -45264. 86098. 108103. 355.728** 499.034*** 349.129**. 264.800*** 375.798*** -524.381* -16.245. -983.982** -942.552**. -38.083. -34.520. -18.889. 2.401. Year FE. YES. YES. YES. YES. YES. Country Effects. NO. NO. RANDOM. FIXED. FIXED. Controls. NO. YES. YES. YES. YES. Observations. 377. 321. 321. 321. 288. 76. 67. 67. 67. 67. No. of countries. Note: Controls include GDPdeflator, GDP_growth, Gov_Consump_Exp, FDI, Democ, all lagged one period. Regional dummies are included in columns 1 to 3. In columns 1 to 4 the time span goes from 1995 to 2012. In column 5 the time span goes from 2000 to 2012. Robust standard errors (clustered by country) in parentheses. *** p<0.01, ** p<0.05, * p<0.1. Revista de Economía Mundial 52, 2019, 143-174.
(16) 158. David Castells-Quintana, José María Larrú, Maricruz Lacalle-Calderón. It is also important to notice that our results so far only highlight associations between microfinance and aid and inequality; although we lagged right-handside variables and included several controls, our results cannot be interpreted in causal terms. Regarding aid, poorer countries tend to have higher levels of inequality in general and are, therefore, subject to higher external aid flows. In this case, our coefficient for aid would be biased towards a positive sign, which may partially explain why we find some positive coefficients. Consequently, a negative coefficient for aid would represent an upper bound of an unbiased result, which would support a negative association of aid with inequality. Regarding microfinance, our regional results are in line with what we found in Table 3; that there does not seem to be a clear pattern with inequality when one analyses the cross-sectional variation (OLS and RE estimates), but only when one controls for country fixed effects (FE estimates).. 5. Case studies Results found so far suggest that the association between microfinance and aid flows and inequality vary depending on the world region considered, and therefore very likely to be context specific. To go deeper into this line of reasoning, we have considered three case studies (from the regions where we have found significant coefficients for aid and microfinance): Bolivia as a Latin American country, Bangladesh as a South Asian case, and Indonesia as an East Asia and Pacific one. These are aid-recipient countries and have accumulated large experiences with microfinance. As it can be seen in Table 5, inequality and aid flows have fallen in the three cases, especially in Bolivia. On the contrary, microfinance has remarkably increased in the three countries. Table 5. Inequality, aid and microfinance in three case studies Gini index. Bangladesh Bolivia Indonesia. Aid (%GDP). MF (%GDP). 1995. 2012. 1995. 2012. 1996*. 2012. 32.7. 31.7. 1.030%. 0.500%. 0.002%. 0.668%. 58. 43.6. 3.141%. 1.090%. 0.330%. 5.928%. 34.2. 32.3. 0.150%. 0.003%. 0.005%. 0.467%. Notes: * we select 1996 as the first year with comparable data. Data for Indonesia is 1997. Authors’ elaboration with data from: Milanovich (2014), MIX Market (2015), & OECD (2017).. Bolivia: Bolivia has developed a huge and very successful microfinance industry since the early eighties. Today, there are 29 microfinance service providers, from which BancoSol, Banco Fassil, Banco FIE and Banco PRODEM are the four biggest entities. All of these 29 institutions are offering microfinance services to 1.25 million people (MIX Market, 2017) and have developed.
(17) Aid, Microfinance and Income Inequality: A Global View. 159. the largest ranges of microfinance design technology in Latin America, and possibly the world (Mosley, 2001). Innovations in lending technologies and market saturation have made Bolivia one of the most rapidly growing and competitive microfinance markets in the world (Navajas et al., 2003), having also one of the wider and deeper coverage among the lower income social sectors and financially excluded segments of the population (Arriola, 2003). This last point may be one of the reasons why we have found a negative and significant association between microfinance and income inequality in LatinAmerican countries. Another reason may be the positive impact of microfinance on human capital formation (see Maldonado and González-Vega, 2008). These authors found that in Bolivia, children from poor rural households with access to microfinance services were kept in school longer than children from households without access to these services. Among the channels through which microfinance influence human capital formation, these authors identified the increased household income that resulted in higher schooling expenditures and longer and sustained enrolment over time. All this contrasts with the nonsignificant results for the case of aid in Latin America, where aid flows received have experienced an important decrease (in Bolivia for instance from 3.4% of the GDP in 1996 to 1% in 2012). Moreover, aid to Bolivia and other LatinAmerican countries has been focused on social infrastructure and services (36 per cent of the total ODA) and debt relief (31 per cent). The potential influence of these flows over income inequality may be low, at least in the short run. Moreover, 20 per cent of aid to Bolivia was channeled through technical cooperation, but none of those programs were related to fiscal policies or tax administration support.15 Indonesia: In East Asia & Pacific we found a negative and significant association between microfinance and inequality and between aid and inequality. Many countries in this region are well-known for their large-scale and well-developed microfinance sector. In Indonesia, the vibrant microfinance market reached 1.2 million of active borrowers and 570 million of depositors in 2015 (Mix Market, 2017). Microfinance began in the country in 1970 with the Bank Dagang Bali, but attained nationwide coverage with the opening of Bank Rakyat Indonesia (BRI) in 1984. Today, there are around 50 MFI reporting to Mix Market, among which Bank Tabungan Pensiunan Nasional (BTPN), Bina Artha and BRI are the most powerful microfinance firms in the country. Also, Indonesia is another country where microfinance has a very wide and deep coverage among the lower income social sectors. For this reason, Robinson (2001) defines a financial revolution in Indonesia based on the increase in the availability of financial services in rural areas and low-income urban neighbourhoods, not exempt from some criticism (Gerber, 2013). Concerning aid, Indonesia, contrary to Bangladesh and Bolivia, 15 Bourguignon et al. (2009) found that aid has an extremely small impact on inequality but near half of it is removed when technical cooperation and debt relief are deducted.. Revista de Economía Mundial 52, 2019, 143-174.
(18) 160. David Castells-Quintana, José María Larrú, Maricruz Lacalle-Calderón. has received a big sum of humanitarian aid, especially after the tsunami of 2004.16 These aid flows may have had an egalitarian effect by helping affected people rebound and therefore narrow income differences with those not affected. Also, community-based programmes in Indonesia have been able to elude rent-seeking behaviour by elites (see Dasgupta & Bear, 2007). Bangladesh: Finally, in South Asia we found a negative and significant association between aid and inequality, but not for microfinance. In countries like Bangladesh, contrary to what happens for instance in Bolivia, nearly half of the aid flows are loans (46 per cent for our time span 1995-2012) instead of grants.17 About one third of the aid programs in Bangladesh were channeled through multilateral institutions. 20 per cent of aid flows were to develop economic infrastructure18 and services, and 8 per cent for General Programme Assistance. As Clemens et al. (2012) has shown, these types of aid have a positive impact on economic growth, and might have also helped to reduce inequality. As the figures are similar for the rest of the south Asia region, it might be possible to extend the association to the region. Concerning microfinance, programs cover only a very low percentage of the total population and GDP, despite the well-known case of the Grameen Bank, (see Table 5).19 In fact, evaluations have shown that, although microcredits have tried to focus on the poorest, the instrument has had limited success in helping households escape from poverty (Roodman & Morduch 2012; Hossain 2012), and therefore in reducing the overall level of inequality.. 6. Conclusions In this article, we have studied the co-evolution of aid, microfinance and income inequality. To do this, we have relied on panel data for 87 developing countries from 1995 to 2012. We have based our empirical analysis in a detailed theoretical discussion of the potential associations between aid and microfinance flows and the evolution of income inequality. We have further complemented our analysis with three specific case studies (Bolivia, Bangladesh and Indonesia). Our theoretical discussion in Section 2 allows us to expect a positive relationship between microfinance and aid flows and reductions in inequality in many developing countries. We have found some evidence (Sections 3 and 4) suggesting that in some world regions this may have been the case. 16 On average, humanitarian aid was 8 per cent of the total ODA in Indonesia, 3.8 per cent in Bangladesh and near 1 per cent in Bolivia. 17 In Bolivia, 76 per cent of the ODA flows were grants. 18 Only 7 per cent in the case of Bolivia and 10 per cent for America’s region. 19 In 2015, the total number of MFI borrowers and depositors in Bangladesh was 15.8 and 19.2 million respectively..
(19) Aid, Microfinance and Income Inequality: A Global View. 161. Nevertheless, our results do not allow us to derive unambiguous conclusions about the impact of microfinance and aid on inequality. Neither microfinance nor aid flows seem to be a panacea to lower inequality. The impact of microfinance and aid on inequality seems to depend on the specific context as well as on many other factors. Consequently, our results question simplistic claims on the effectiveness of aid and microfinance flows without considering specificities on the allocation of the flows, programs funded, recipient characteristics, and several other contextual factors. As our study of the specific cases of Bolivia and Indonesia highlights, when microfinance flows reach the lowest-income and financially excluded segments of the population, they can help in reducing income inequality. For the case of aid, flows to economic infrastructure and productive sectors, loans, and humanitarian responses focused on the poorest (instead of aid for debt relief or pure technical assistance) may be more desirable to improve income distribution. Given the importance of reducing income inequality, and our limited knowledge to date, increasing our understanding of the macroeconomic effects of aid and microfinance on inequality arises as a valuable goal for both academics and policy makers. Policy makers might consider aid, microfinance, or both, as instruments to reduce income inequality. However, the effectiveness of these instruments is not guaranteed; as we have shown it highly depends on several contextual factors. Further research and country-specific studies and evaluations are clearly needed in this regard.. References Acemoglu, D., Naidu, S., Restrepo, P. and Robinson, J. (2015): “Democracy, Redistribution and Inequality”, in Atkinson, A. and Bourguignon, F. (eds.): Handbook of Income Distribution, vol.2A, North Holland, Amsterdam, Chapter 21: 1885-1966. Ahlin, C. and Jiang, H. (2008): “Can Microcredit Bring Development?”, Journal of Development Economics 86: 1–21. Alesina, A. and Giuliano, P. (2010): “Preferences for Redistribution”, in Ben Habib, J. and Bisin, A. (eds.): Handbook of Social Economics, 93-131, North Holland, Amsterdam. Alesina, A., Cozzi, G. and Mantovan, N. (2012): “The Evolution of Ideology, Fairness and Redistribution”, The Economic Journal, 122 (Dec), 1244–1261. Amarante, V. and Brun, M. (2016): “Cash Transfers in Latin America. Effects on poverty and redistribution”, UNU-WIDER Working Paper 136, Helsinki. Amarante, V. (2016): “Income Inequality in Latin America: A Factor Component Analysis”, Review of Income and Wealth. Forthcoming. DOI: 10.1111/ roiw.12236.OEC. Amendola, A., Easaw, J. and Savoia, A. (2013): “Inequality in Developing Economies: The Role of Institutional Development”, Public Choice 155(1-2): 43-60, doi:10.1007/s11127-011-9838-3.. Revista de Economía Mundial 52, 2019, 143-174.
(20) 162. David Castells-Quintana, José María Larrú, Maricruz Lacalle-Calderón. Armendáriz, B. and Morduch, J. (2010): The Economics of Microfinance, 2nd Edition, Cambridge, MA: The MIT Press. Asiedu, E. and Nandwa, B. (2007): “On the Impact of Foreign Aid in Education on Growth: How Relevant Is the Heterogeneity of Aid Flows and the Heterogeneity of Aid Recipients?”, Review of World Economics, 143(4): 631-649. Balkenhol, B. and Guézennec, C. (2014): “Microcredit in France: What Impact Does It Have on Employment?”, Social Finance Working Paper, Geneva: International Labour Organization. Baltagi, B. and Griffin, J. (1984): “Short and Long Run Effects in Pooled Models”, International Economic Review, 35(3): 631-645. Bastagli, F., Hagen-Zanker, J., Harman, L. and Barca, V. (2016): Cash Transfers: What Does the Evidence Say? A Rigorous Review of Programme Impact and of the Role of Design and Implementation Features, Overseas Development Institute, London. Bateman, M. (2012): “How Lending to the Poor Began, Grew, and Almost Destroyed a Generation in India”, Development and Change 43(6): 13851402. Bauchet, J. and Morduch, J. (2010): “Selective Knowledge: Reporting Biases in Microfinance Data”, Perspectives on Global Development and Technology 9(3): 240–269. Benabou, R. and Tirole, J. (2006): “Belief in a Just World and Redistributive Politics”, Quarterly Journal of Economics 121(2): 699-746. Bourguignon, F., Levin, V. and Rosenblatt, D. (2009): “International Redistribution of Income”, World Development, 37(1): 1-10. Brown, D. (1999): “Reading, Writing, and Regime Type: Democracy’s Impact on Primary School Enrolment”, Political Research Quarterly, 52: 681-707. Calderón, C., and Chong, A. (2009):” Labor Market Institutions and Income Inequality: An Empirical Exploration”, Public Choice, 138(1): 65–81. Cassimon, D., Essers, E. and Renard, R. (2009): “What Potential for Debtfor-Education Swaps in Financing Education for All?”, Background Report for the 10th Meeting of the EFA Working Group, Paris: UNESCO, Available at: http://www.unesco.org/education/EFAWG2009/additional/ Deskstudyondebt.pdf. Cassimon, D., Renard, R. and Verbeke, K. (2008): “Assessing Debt-to-Health Swaps: a case study on the Global Fund Debt2Health Conversion Scheme” Tropical Medicine and International Health, 13: 1188–1195, doi:10.1111/ j.1365-3156.2008.02125.x. Castells-Quintana, D. and Larrú, J. M. (2015): “Does Aid Reduce Inequality? Evidence for Latin America”, European Journal of Development Research, 27: 826–849. CGAP (Consultative Group to Assist the Poor) (2009): About Microfinance. Washington, DC.: The World Bank, Available at: www.cgap.org Chong, A., Calderon, C. and Gradstein, M. (2009): “Can Foreign Aid Reduce Income Inequality and Poverty?”, Public Choice 140 (1–2): 59–84..
(21) Aid, Microfinance and Income Inequality: A Global View. 163. Clemens, M., Radelet, S., Bhavnani, R. and Bazzi, S. (2012): “Counting Chickens when They Hatch: Timing and the Effects of Aid on Growth”, Economic Journal 122: 590-617. Cornia, A. and Martorano, B. (2013): “Development Policies and Income Inequality in Selected Developing Regions 1980-2010”, DISEI, Università degli Studi di Firenze Working Paper 13. Cornia, A. and Martorano, B. (2017): “Building the Integrated Inequality Database and the Seven Sins of Inequality Measurement in Sub-Saharan Africa”, DISEI Working Papers 05. Cornia, G.A. (2011): “Economic Integration, Inequality and Growth: Latin America vs. the European Economies in Transition”, Review of Economics and Institutions 2(2): Article 2. Cornia, G. A. (2014): “Recent Distributive Changes in Latin America: An Overview”, Chapter 1, in Falling Inequality in Latin America: Policy Changes and Lessons, Oxford University Press and UNU-WIDER. Costa-Font, J. and Cowell, F. (2016): “Social Identity and Redistributive Preferences: A Survey”, Journal of Economics Surveys, 29(2): 357-374. Cull, R., Demirgüc-Kunt, A. and Morduch, J. (2011): “Does Regulatory Supervision Curtail Microfinance Profitability and Outreach?”, World Development, 39(6): 949–965. Dabla-Norris, E., Ji, Y., Townsend, R. M. and Filiz Unsal, D. (2015): “Distinguishing Constraints of Financial Inclusion and Their Impact on GDP and Inequality”, NBER Working Paper 20821. Dasgupta, A. and Bear, V. (2007): “Community Driven Development, Collective Action and Elite Capture in Indonesia”, Development and Change, 38(2): 229–249. Dreher, A., Nunnenkamp, P. and Thiele, R. (2008): “Does Aid for Education Educate Children? Evidence from Panel Data”, The World Bank Economic Review, 22: 291-314. Durante, R., Putterman, L. and Ven der Weele, J. (2013): “Preferences for Redistribution and Perception of Fairness: An Experimental Study”, Journal of the European Economic Association, 12(4): 1059–1086. European Commission (2002): “Participation of Non-State Actors in EC development policy”, Communication from the Commission to the Council, the European Parliament and the Economic and Social Committee, COM(2002) 598 final, Brussels, 07.11.2002. Ferreira, F. H. G., Lustig, N. and Teles, D. (2015): “Appraising Cross-National Income Inequality Databases. An Introduction”, World Bank Policy Research Working Paper 7489. Gerber, J-F. (2013): “The Hidden Consequences of Credit: An Illustration from Rural Indonesia”, Development and Change, 44(4): 839–860. Hermes, N. (2014): “Does Microfinance Affect Income Inequality?”, Applied Economics, 46(9): 1021–1034, DOI: 10.1080/00036846.2013.864039. Herzer, D. and Nunnenkamp, P. (2012): “The Effect of Foreign Aid on Income Inequality: Evidence from Panel Cointegration”, Structural Change and Economic Dynamics, 23(3): 245–255.. Revista de Economía Mundial 52, 2019, 143-174.
(22) 164. David Castells-Quintana, José María Larrú, Maricruz Lacalle-Calderón. Hossain, M. (2012): “Measuring the Impact of BRAC Microfinance Operations: A Case Study of a Village”, International Business Research, 5 (4): 112-123. Huntington, S. (1968): Political Order in Changing Societies, New Haven, Yale University Press. Imai, K. S., Gaiha, R., Thapa G. and Kobina Annim, S. (2012): “Microfinance and Poverty – A Macro Perspective”, World Development, 40(8): 1675–1689. IMF (2014): “Fiscal Policy and Income Inequality”, IMF Policy Paper, January 23. Jenkins, S. (2015): “World Income Inequality Databases: An Assessment of WIID and SWIDD”, The Journal of Economic Inequality, 13(4): 629-671. Kai, H. and Hamori, S. (2009): “Microfinance and Inequality”, Research in Applied Economics, 1(1): 1–12. Kireyev, A. and Chen, J. (2017): “Inclusive Growth Framework”, IMF Working Paper 17/127, Washington. Li, H., Squire, L. and Zou, H. F. (1998): “Explaining International and Intertemporal Variations in Income Inequality”, The Economic Journal, 108(446): 26–43. López, J.H. and Perry, H. (2008): “Inequality in Latin America: Determinants and Consequences”, World Bank Policy Research Working Paper 4504. Lustig, N. (2011): “Fiscal Policy and Income Redistribution in Latin America: Challenging the Conventional Wisdom”, ECINEQ Working Paper 227, Society for the Study of Economic Inequality, Verona. Lustig, N. (2016): “Fiscal Policy, Income Redistribution and Poverty Reduction in Low and Middle Income Countries”, Chapter 9 in Lustig, N. (ed.): Commitment to Equity Handbook. A Guide to Estimating the Impact of Fiscal Policy on Inequality and Poverty, Brookings Institution Press, Washington. Mahjabeen, R. (2008): “Microfinancing in Bangladesh: Impact on Households, Consumption and Welfare”, Journal of Policy Modeling, 30(6): 1083–1092. Maldonado, J. H., & González-Vega, C. (2008): “Impact of Microfinance on Schooling: Evidence from Poor Rural Households in Bolivia”, World Development, 36(11): 2440-2455. Manacorda, M., Sánchez-Páramo, C. and Schady, N. (2010): “Changes in Returns to Education in Latin America: The Role of Demand and Supply of Skills”, Industrial and Labor Relations Review, 63(2): 307–26. Mansour, M. S. and Mendel, M. (2015): “Finance and Inequality – Evidence from East Asia”, Eurasian Journal of Economics and Finance, 3(3): 1–16. Milanovic, B. (2014): “Description of All the Ginis Dataset”. Version November 2014. Available at http://pubdocs.worldbank.org/ en/728601472744842249/Description-of-AllGinis-Oct2014. MIX Market (2015): “Bolivia MIX – Microfinance Information Exchange”, Available at: https://www.themix.org/mixmarket/countries-regions/bolivia. MIX Market (2015): “Mix Market Database”, Available at: http://www. mixmarket.org. Mosley, P. (2001): “Microfinance and poverty in Bolivia”, Journal of Development Studies 37(4): 101-132..
(23) Aid, Microfinance and Income Inequality: A Global View. 165. Navajas, S., Conning, J., & Gonzalez-Vega, C. (2003): “Lending Technologies, Competition and Consolidation in the Market for Microfinance in Bolivia”, Journal of International Development, 15(6): 747-770. Ndikumana, L. (2004): “Additionality of Debt Relief and Debt Forgiveness, and Implications for Future Volumes of Official Assistance”, International Review of Economics and Finance, 13(3): 325-340. OECD-DAC (2008): “The Accra Agenda for Action. 3rd High Level Forum on Aid Effectiveness”, Development Co-operation Directorate, DCD-DAC. Sep. 2-4. Organisation for Economic Co-operation and Development (OECD) (2017): “DAC database”, OECD, Accessed 31 October 2016, Available at: http:// www.oecd.org/dac/financing-sustainable-development/developmentfinance-data/ Partridge, M. (2005): “Does Income Distribution Affect US State Economic Growth?”, Journal of Regional Science, 45(2): 363-394. Piketty, T, Saez, E. and Zucman, G. (2017): “Distributional National Accounts: Methods and Estimates for the United States”, The Quarterly Journal of Economics, 133(2): 553-609. Pirotte, A. (1999): “Convergence of the Static Estimation Toward the Long Run Effects of Dynamic Panel Models”, Economic Letters, 63(2): 151-158. Ravallion, M. (2014): “Income Inequality in the Developing World”, Science 344(6186): 851-855. Robinson, M. (2001): The Microfinance Revolution: Sustainable Finance for the Poor. Washington, DC: The World Bank. Rodríguez-Castelán, C, López-Calva, L.F., Lustig, N. and Valderrama, D. (2016): “Understanding the Dynamics of Labor Income Inequality in Latin America”, Tulane Economics Working Paper Series 1608. Rodrik, D. (1999): “Democracies Pay higher Wages”, Quarterly Journal of Economics, 114(3): 707-738. Roodman, D. (2012): Due Diligence: An Impertinent Inquiry into Microfinance, Washington, DC: Center for Global Development. Roodman, D. and Morduch, J. (2012): “The Impact of Microcredit on the Poor in Bangladesh: Revisiting the Evidence”, Journal of Development Studies, 50(4): 583-604. Shafiullah, M. (2011): “Foreign Aid and its Impact on Income Inequality”, International Review of Business Research Papers, 7(2): 91-105. Solt, F. (2009): “Standardizing the World Income Inequality Database”, Social Science Quarterly, 90(2): 231–242, SWIID Version 4.0, September 2013. Solt, F. (2016): “Standardizing the World Income Inequality Database”, Social Science Quarterly, 97(5): 1267-1281. Stiglitz, J. (2012): The Price of Inequality: How Today’s Divided Society Endangers our Future, W. W. Norton and Co. New York. Temple, J. (2009): “Aid and Conditionality”, in Rodrik, D. and Rosenzweig, M. (eds.): Handbook of Development Economics, vol5, chapter 67: 44154523. UNDP (2013): Humanity Divided: Confronting Inequality in Developing Countries, UNDP, New York.. Revista de Economía Mundial 52, 2019, 143-174.
(24) 166. David Castells-Quintana, José María Larrú, Maricruz Lacalle-Calderón. United Nations (2017): Goal 10: Why Addressing Inequality Matters, UNChronicle. Available at: https://unchronicle.un.org/article/goal-10-whyaddressing-inequality-matters. Wilson, S.E. (2011): “Chasing Success: Health Sector Aid and Mortality”, World Development, 39(11): 2032-2043. World Bank (2016a): “Brazil Systematic Country Diagnostic: Retaking the Path to Inclusion, Growth, and Sustainability”, Report 101431-BR, World Bank, Washington. World Bank (2016b): “Chile: Distributional Effects of the 2014 Tax Reform”, World Bank, Washington. Zahonogo, P. (2017): “Financial Development and Poverty in Developing Countries: Evidence from Sub-Saharan Africa”, International Journal of Economics and Finance 9(1): 211-220..
(25) Aid, Microfinance and Income Inequality: A Global View. 167. Appendix A Table A.1. List of Variables, Description, and Data Sources Variable. Description. Data source. A: Dependent variable Inequality. Gini index. All the Ginis (Milanovic, 2014). B: Key variables of interest Aid. Official Development Assistance (ODA), expressed as a fraction of GDP, measured in current USD. OECD (2017). MF. Gross Loan Portfolio (GLP), expressed as a fraction of GDP, measured in current USD. MIX Market (2015). C: Control variables Inflation rate. Annual growth rate of GDP deflator, expressed in %. World Development Indicators. GDP Deflactor. World Development Indicators. GDP Growth. Annual percentage growth rate of GDP, measured in constant 2005 USD. Government Consumption Expenditure. (World Bank, 2015). (World Bank, 2015). General government final consumption expenditure, expressed as a fraction of GDP. World Development Indicators (World Bank, 2015). Foreign Direct Investment. Foreign direct investment, net inflows expressed as a fraction of GDP. World Development Indicators (World Bank, 2015). Democracy. Democracy Index (1-10). Polity IV Database (Polity IV, 2012). Revista de Economía Mundial 52, 2019, 143-174.
(26) 168. David Castells-Quintana, José María Larrú, Maricruz Lacalle-Calderón. Table A.2. List of Countries Analyzed Albania. Congo Dem Rep. Iraq. Nigeria. Tanzania. Argentina. Congo, Rep.. Jordan. Pakistan. Thailand. Armenia. Costa Rica. Kazakhstan. Panamá. Togo. Azerbaijan. Cote d’Ivore. Kenya. Paraguay. Tunisia. Bangladesh. Dominican Rep. Kyrgyz Rep. Peru. Turkey. Benin. East Timor. Lebanon. Philippines. Uganda. Bolivia. Ecuador. Macedonia. Poland. Ukrania. Bosnia& Herz.. Egypt, Arab Rep.. Madagascar. Romania. Urugay. Brazil. El Salvador. Malawi. Russia. Uzbekistan. Bulgaria. Ethiopia. Mali. Rwanda. Venezuela, RB. Burkina Faso. Georgia. Mexico. Senegal. Vietnam. Burundi. Ghana. Moldova. Serbia. W Palestina. Cambodia. Guatemala. Mongolia. Sierra Leone. Yemen, Rep.. Cameroon. Guinea. Morocco. South Africa. Zambia. Chad. Haiti. Mozambique. Sri Lanka. Zimbawe. Chile. Honduras. Nepal. Swaziland. China. India. Nicaragua. Syrian Ar Rep. Colombia. Indonesia. Niger. Tajikistan. Table A.3. Descriptive Statistics Variable. Number Obs. 638. Median. Mean. Standard Dev.. 42.6. 42.9. 9.58. 1202. 0.0009. 0.004. 0.007. 1458. 0.11. 0.22. 0.32. 1540. 7.37. 16.31. 80.19. 1359. 0.27. 0.28. 0.51. 1466. 12.62. 13.44. 4.77. 1436. 6. 4.97. 3.44. 1483. 2.54. 3.71. 4.57.
(27) Aid, Microfinance and Income Inequality: A Global View. 169. Appendix B Fig. B.1. Evolution of inequality, aid and microfinance by world regions. Authors’ elaboration with data from: Milanovich (2014), MIX Market (2015), & OECD (2017).. Revista de Economía Mundial 52, 2019, 143-174.
(28) 170. David Castells-Quintana, José María Larrú, Maricruz Lacalle-Calderón. Fig. B.2. Joint evolution of Aid and Inequality, and MF and Inequality, by world regions.
(29) Aid, Microfinance and Income Inequality: A Global View. 171. Authors’ elaboration with data from: Milanovich (2014), MIX Market (2015), & OECD (2017).. Fig. B.3. Scatterplots. between. Aid. and. Inequality,. and. Microfinance. and. Inequality (whole. sample and world regions). Revista de Economía Mundial 52, 2019, 143-174.
(30) 172. David Castells-Quintana, José María Larrú, Maricruz Lacalle-Calderón. Authors’ elaboration with data from: Milanovich (2014); MIX Market (2015); OECD (2017)..
(31) NO. 126. 58. Controls. Observations. No. of countries. NO. 54. 118. YES. 54. 118. YES. RANDOM. YES. (1.37e-09). -6.99E-10. (89.411). -172.044*. (3). 54. 118. YES. FIXED. YES. (1.58e-09). -1.24E-10. (113.682). -139.548. (4). 54. 114. YES. FIXED. YES. 1.40e-09. -8.77E-10. (103.780). -166.455. (5). 54. 114. YES. FIXED. YES. (2.60e-08). 2.75E-09. (3537.62). -9523.172***. (1.87e-09). -8.89E-10. (178.446). 188.329. (6). Note: Controls include GDPdeflator, Eco_growth, Gov_exp, FDI, Democ, all lagged one period. In columns 1 to 4 the time span goes from 1995 to 2012. In column 5 the time span goes from 2000 to 2012. Robust standard errors (clustered by country) in parentheses. *** p<0.01, ** p<0.05, * p<0.1. NO. Country Effects. YES. (2.16e-09). (5.74e-10). YES. -9.71e-10. (132.537). (163.953). -9.48e-10. -103.348. (2). -25.1485. Year FE. Aid(t-1)^2. MF(t-1)^2. Aid(t-1). MF(t-1). Dependent variable: Inequality (Gini Coefficient). (1). Table C.1 Main results, 3-year periods. Appendix C. Aid, Microfinance and Income Inequality: A Global View 173. Revista de Economía Mundial 52, 2019, 143-174.
(32)
(33)
Figure

Documento similar
It is also shown that the foreign debt is sustainable if (1) share of capital income is small, i.e., inequality is small, (2) initial ratio of the foreign debt to GDP is
In this paper we measure the degree of income related inequality in mental health as measured by the GHQ instrument and general health as measured by the EQOL-5D instrument for
And 2017 Order of the Community of Madrid, regulating aid for R&D programmes, in article 7.8 establishes the obligation to archive in repositories the documents
mortalidad es mayor en todas las clases entre ambos sexos en el Norte, con la excepción de las mujeres en la Clase I. La tabla también muestra que las desigualdades tienden a
Additionally, slightly negative relationship between the level of regional inequality and the level of economic development is found out regarding regional inequality within
18 The signi ficant association observed in South Africa may have been attributable to the exceptionally high propor- tion of class III obesity (11.6%) as when we excluded
According to my theory, given two democracies with the same conservatives’ support for public spending and the same level of income inequality, it is more likely to have a change in
PIAAC data, available for 30 upper-middle and high-income countries and nationally representative for the working-age population, allow us to construct a multidimen- sional measure
