Thermal treatment for decontamination of mercury containing wastes from chlor alkali industry
205
0
0
Texto completo
(2) Promoters: . Prof. Dr. ir. Filip Tack Department of Applied Analytical and Physical Chemistry Faculty of Bioscience Engineering Ghent University Belgium. . Prof. Dr. ir. Xiomara Cabrera Bermúdez Chemical Engineering Department Faculty of Chemical and Pharmacy Central University of Las Villas Cuba. . Prof. Dr. ir. Luis M. Peralta Suarez Chemical Engineering Department Faculty of Chemical and Pharmacy Central University of Las Villas Cuba. Dean: Prof. Dr. ir. Guido Van Huylenbroeck Rector: Prof. Dr. ir. Paul Van Cauwenberge.
(3) WORD OF THANKS. WORD OF THANKS This thesis reflects between its lines, some years of hard work, but more than that, it represents an invaluable experience not only as a professional but as a person, and I would like to thank to all that were involved in it. I am extremely grateful to my dear parents Miriam and Roberto and my incredible sister Yairen, who form with the rest of my loving family, the origin of my happiness. I would like to thanks also, to my dear grandmother Elena, for always watching over me and guiding my steps like a star from the heaven. Their love and support without any complaint or regret have enabled me to complete this Ph.D. study. I would like to give my sincere thanks to my supervisor, Prof. Dr. ir. Filip Tack for all the advice, support and supervising that he offered me every time when I called his door. Without his help I could not have finished my doctorate successfully. I would like to thank to my supervisors Prof. Dr. ir. Xiomara Cabrera and Prof. Dr. ir. Luis M. Peralta who have helped and supported me throughout the work of this thesis and especially to that extraordinary person who held out me his hand only for the pleasure of help. Also I would say thanks to the fellows of the Laboratory for Analytical Chemistry and Applied Ecochemistry of Ghent University for their support in the experimental work and much more than that, in my life in Gent. I would also like to thank the personal of the Chlor-alkali Cuban plant for their help and support. I appreciate as well the advice of the committee members, Prof. Dr. ir. Valérie Cappuyns, Prof. Dr. ir. Gijs Du Laing and Prof. Dr. ir. Frederik Ronsse, for their critical comments, which enabled me to notice the weaknesses of my dissertation and make the necessary improvements according to their comments. I would like to thank to my truly friends (too many to list here but they know who they are!) for being always there when I needed. Finally I would like to say thanks only for being live in this world sometimes ruthless but where I have had the privilege to meet during these intense years of Ph.D. research hearted people willing to give “Goodwill Love”.. Thank you very much! Dank u wel! Muchas Gracias!. Yailen Busto Yera, December 2012. I.
(4) WORD OF THANKS. II.
(5) TABLE OF CONTENTS. TABLE OF CONTENTS WORD OF THANKS TABLE OF CONTENTS LIST OF FIGURES LIST OF TABLES LIST OF SYMBOLS ABBREVIATIONS INDEX ACKNOWLEDGEMENTS SUMMARY SAMENVATTING. CHAPTER 1: General Introduction and Conceptual Framework 1.1 A global view of mercury pollution-------------------------------------------------------------- 1 1.1.1. Natural and anthropogenic sources of mercury---------------------------------------. 1. 1.2 Mercury in the environment----------------------------------------------------------------------. 3. 1.3 Mercury impacts to the environment and human health-------------------------------------- 4 1.4 Regulatory considerations on mercury contaminated wastes--------------------------------. 5. 1.5 Mercury cell chlor-alkali process----------------------------------------------------------------. 6. 1.6 Trends in the use of mercury cell chlor-alkali plants------------------------------------------ 7 1.7 Mercury pollution in the Cuban context--------------------------------------------------------- 9 1.7.1 Mercury solid waste generated from the chlor-alkali process---------------------- 10 1.7.2 Cuban legislation------------------------------------------------------------------------- 10 1.7.3 Management of mercury solid wastes-------------------------------------------------. 11. 1.8 Objectives and general outline-------------------------------------------------------------------. 12. CHAPTER 2: Remediation Technologies for Mercury Contaminated Wastes 2.1 Remediation techniques for heavy metals contaminated soils and wastes-----------------. 15. 2.2 Remediation techniques for mercury contaminated wastes----------------------------------. 16. 2.2.1. Stabilization/Solidification (S/S)------------------------------------------------------. 17. 2.2.2. Vitrification------------------------------------------------------------------------------- 19. 2.2.3. Soil washing------------------------------------------------------------------------------ 20. 2.2.4. Acid extraction--------------------------------------------------------------------------- 22.
(6) TABLE OF CONTENTS. 2.2.5. Thermal treatment-----------------------------------------------------------------------. 24. 2.3 Thermal treatment technologies------------------------------------------------------------------ 25 2.3.1. Thermal desorption---------------------------------------------------------------------. 2.3.2. Retorting--------------------------------------------------------------------------------- 25. 2.4 Retorting treatment of mercury contaminated wastes---------------------------------------2.4.1. 2.4.2. 25. 26. Process variables influencing mercury removal------------------------------------ 26 2.4.1.1. Solid matrix properties---------------------------------------------------. 26. 2.4.1.2. Mercury speciation-------------------------------------------------------- 27. 2.4.1.3. Temperature and retorting time-----------------------------------------. 27. Kinetic model of mercury reactions during retorting treatment------------------ 29. 2.5 Design of the chemical process------------------------------------------------------------------ 32 2.5.1. Mathematical modelling to design chemical process------------------------------- 32 2.5.1.1. Dynamic modelling------------------------------------------------------- 32. 2.5.2. Conceptual types of mathematical models------------------------------------------ 33. 2.5.3. Phenomenological models------------------------------------------------------------. 33. 2.6 Scale-up of the chemical process---------------------------------------------------------------. 35. 2.7 Simulation for designing, upscaling and optimising chemical processes------------------ 36 2.7.1. Methodology to simulate a chemical process---------------------------------------. 37. 2.7.2. Sequential modular simulators--------------------------------------------------------. 37. 2.8 Indicators used to evaluate a technology-------------------------------------------------------. 38. 2.8.1. Techno-economic methods------------------------------------------------------------. 38. 2.8.2. Environmental methods----------------------------------------------------------------. 38. 2.8.2.1. Life Cycle Assessment (LCA) methodology-------------------------- 38. CHAPTER 3: Leaching behaviour of mercury from hazardous solid waste generated by chlor-alkali industry 3.1. Introduction----------------------------------------------------------------------------------------- 42. 3.2. Material and Methods----------------------------------------------------------------------------- 43. 3.3. 3.2.1. Site description-------------------------------------------------------------------------- 43. 3.2.2. Sampling and sample preparation----------------------------------------------------- 44. 3.2.3. Sample characterization---------------------------------------------------------------- 44. 3.2.4. DIN 38414 S4 leaching test----------------------------------------------------------- 45. Results and discussion---------------------------------------------------------------------------- 46.
(7) TABLE OF CONTENTS. 3.3.1 3.3.2 3.4. Chemical characteristics of the solid waste------------------------------------------ 46 Actual Leachability--------------------------------------------------------------------. 47. Conclusions----------------------------------------------------------------------------------------- 50. CHAPTER 4: Mercury mobility and availability in highly contaminated solid wastes from a chlor-alkali plant 4.1 Introduction----------------------------------------------------------------------------------------4.2. 4.3. 4.4. 54. Material and Methods------------------------------------------------------------------------------ 56 4.2.1. Sampling and sample preparation----------------------------------------------------. 56. 4.2.2. Physico-chemical analysis------------------------------------------------------------. 56. 4.2.3. Total mercury determination---------------------------------------------------------- 57. 4.2.4. TCLP leaching test---------------------------------------------------------------------. 4.2.5. Sequential extraction------------------------------------------------------------------- 58. 57. Results and discussion----------------------------------------------------------------------------- 59 4.3.1. Chemical characteristics of the mercurial sludge---------------------------------- 59. 4.3.2. Mercury contents and leachability--------------------------------------------------- 60. 4.3.3. Evaluation of the environmental risk (mercurial sludge fractionation)--------- 60. Conclusions----------------------------------------------------------------------------------------- 62. CHAPTER 5: Potential of thermal treatment for decontamination of mercury containing wastes from chlor-alkali industry 5.1. Introduction-----------------------------------------------------------------------------------------. 5.2. Material and Methods------------------------------------------------------------------------------ 65. 5.3. 5.4. 64. 5.2.1. Mercury waste sampling and preparation-------------------------------------------- 65. 5.2.2. Sample characterization---------------------------------------------------------------- 65. 5.2.3. Mercury determination----------------------------------------------------------------- 66. 5.2.4. TCLP tests-------------------------------------------------------------------------------. 5.2.5. Thermal treatment----------------------------------------------------------------------- 67. 66. Results and discussion----------------------------------------------------------------------------- 67 5.3.1. Chemical and physical characterization of samples-------------------------------- 67. 5.3.2. Thermal treatment----------------------------------------------------------------------- 69. 5.3.3. Leachability of the treated wastes----------------------------------------------------- 71. Conclusions-----------------------------------------------------------------------------------------. 73.
(8) TABLE OF CONTENTS. CHAPTER 6: Kinetic modelling of mercury removal from contaminated solid waste generated by chlor-alkali plant using thermal treatment 6.1. Introduction-----------------------------------------------------------------------------------------. 6.2. Material and Methods------------------------------------------------------------------------------ 78. 6.3. 6.4. 76. 6.2.1. Sampling and chemical analysis------------------------------------------------------. 78. 6.2.2. Thermal treatment set-up at bench scale--------------------------------------------- 78. 6.2.3. Thermodynamic analysis--------------------------------------------------------------- 79. 6.2.4. Kinetics of thermal decomposition of the solid mercury waste------------------- 80 6.2.4.1. Equations rate simulated using the PSI software---------------------- 83. 6.2.4.2. Kinetic model adjustment------------------------------------------------. 85. Results and discussion----------------------------------------------------------------------------- 85 6.3.1. Mercurial sludge characterization----------------------------------------------------- 85. 6.3.2. Thermal treatment of the mercurial sludge sample--------------------------------- 86. 6.3.3. Chemical reaction mechanism--------------------------------------------------------- 88 6.3.3.1. Thermodynamic analysis of the reaction scheme--------------------- 89. 6.3.3.2. Kinetic model for thermal decomposition of mercurial sludge------ 90. 6.3.3.3. Kinetic model behaviour- dependence of the temperature----------- 92. 6.3.3.4. Comparison among nine kinetic reaction mechanisms--------------- 95. 6.3.3.5. Statistical analysis--------------------------------------------------------- 96. Conclusions-----------------------------------------------------------------------------------------. 97. CHAPTER 7: Treating high mercury containing wastes from chlor-alkali plant using pilotscale thermal treatment technology: techno-economic and environmental analysis 7.1. Introduction-----------------------------------------------------------------------------------------. 7.2. Material and Methods------------------------------------------------------------------------------ 101 7.2.1. 100. Bench-scale thermal treatment process---------------------------------------------. 101. 7.2.1.1. Input variables-------------------------------------------------------------. 102. 7.2.1.2. Design parameters at bench-scale--------------------------------------- 103. 7.2.1.3. Operating conditions at bench-scale------------------------------------. 103. 7.2.2. Scale-up of the thermal treatment to pilot-scale------------------------------------. 104. 7.2.3. Pilot-scale thermal treatment process------------------------------------------------. 105. 7.2.4. Mass and energy balance of the overall process------------------------------------ 106.
(9) TABLE OF CONTENTS. 7.3. 7.2.5. Design and selection of the equipments at pilot scale----------------------------- 111. 7.2.6. Techno-economic and environmental analysis------------------------------------- 112. Results and discussion----------------------------------------------------------------------------- 113 7.3.1. Bench-scale thermal treatment process---------------------------------------------- 113. 7.3.2. Operating conditions of the proposed thermal treatment plant------------------- 113. 7.3.3. Mass and energy balance of the overall process-----------------------------------. 7.3.4. Design and selection of the overall process equipment--------------------------- 116. 7.3.5. Detailed description of the thermal treatment process at pilot scale------------- 117. 7.3.6. Economic assessment of the thermal treatment technology---------------------- 119 7.3.6.1. 7.3.7 7.4. 114. Integrated economic assessment----------------------------------------- 123. Environmental impact assessment by Life Cycle Analysis (LCA)-------------- 125. Conclusions-----------------------------------------------------------------------------------------. 131. CHAPTER 8: General discussion, Conclusions and Future Perspectives 8.1. General Discussion-------------------------------------------------------------------------------. 133. 8.2. Conclusions----------------------------------------------------------------------------------------. 137. 8.3. Future Perspectives-------------------------------------------------------------------------------. 138. REFERENCES-------------------------------------------------------------------------------------------. 141. CURRICULUM VITAE--------------------------------------------------------------------------------. 169.
(10) TABLE OF CONTENTS.
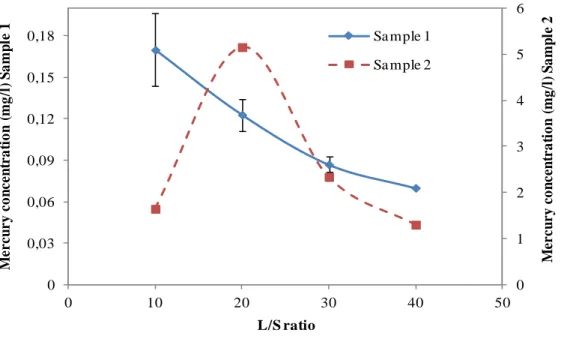
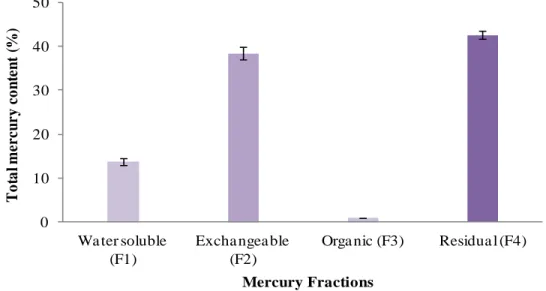
(11) LIST OF FIGURES. LIST OF FIGURES Figure 1.1.. Global mercury consumption by application and by region (Maxson, 2010 cited in Pirrone, 2012)----------------------------------------------------------------------------. 2. Figure 1.2.. Schematic of the mercury transport cycle (Subir et al., 2011)-------------------------------. 4. Figure 1.3.. Trends in mercury emissions by region from 1990 until 2005 (UNEP, 2008)------------. 7. Figure 1.4.. Map of Sagua La Grande region (Díaz-Asencio et al., 2009)-------------------------------. 9. Figure 1.5.. Satellite picture of Electrochemical plant “Elpidio Sosa”------------------------------------. 10. Figure 1.6.. Pictures of the concrete niches located around the electrochemical plant-----------------. 11. Figure 3.1.. Mercury concentration in the DIN S4 leaching test fractions at increasing L/S ratio for the two mercurial sludge samples------------------------------------------------. Figure 4.1.. Mercury fractionation in contaminated solid waste from Chlor-alkali Cuban plant using sequential extraction procedure-------------------------------------------. Figure 5.1.. 87. Behaviour of mercury concentrations (TCLP test) in ashes with the retorting time at three different temperatures--------------------------------------------------. Figure 6.3.. 72. Behaviour of mercury content in ashes with the retorting time at three different temperatures-------------------------------------------------------------------. Figure 6.2.. 71. Mercury concentrations in TCLP extracts of mercury sludges, treated at increasing temperatures---------------------------------------------------------------. Figure 6.1.. 70. Final pH of the TCLP extract of mercury sludges, treated during 1 h at increasing temperatures------------------------------------------------------------------------. Figure 5.3.. 61. Influence of retorting temperature during 1 h on the residual ash, expressed as percentage of the initial dry mercury sludge------------------------------------------------. Figure 5.2.. 49. 88. Behaviour of the mercury compounds present in the sludge matrix with the time at three different temperatures---------------------------------------------------. 93. Figure 6.4.. Conversion profiles of the kinetic model at the three retorting temperatures-------------. 94. Figure 6.5.. Mechanisms comparison to determine the controlling stage for the thermal decomposition of the mercurial sludge sample at low temperature (250 °C) and high temperature (450 °C)-------------------------------------------------------. 96 i.
(12) LIST OF FIGURES. Figure 7.1.. Flow diagram of the bench-scale thermal treatment process--------------------------------. 102. Figure 7.2.. Schematic diagram of the proposed pilot-scale thermal treatment plant-------------------. 105. Figure 7.3.. Representation in 3D of the proposed thermal treatment plant (superior panoramic view)------------------------------------------------------------------------. Figure 7.4.. 118. Comparison of Net Present Value profiles during the health life of the project for both integrated alternatives--------------------------------------------------. 125. Figure 7.5.. General description of the Scenario 1-----------------------------------------------------------. 126. Figure 7.6.. Comparative analysis by environmental impact assessment of the Scenario 1-----------. 127. Figure 7.7.. General description of the Scenario 2-----------------------------------------------------------. 128. Figure 7.8.. Comparative analysis by environmental impact assessment of the Scenario 2-----------. 129. ii.
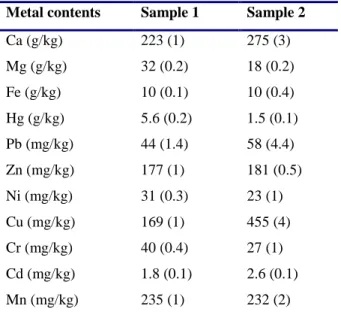
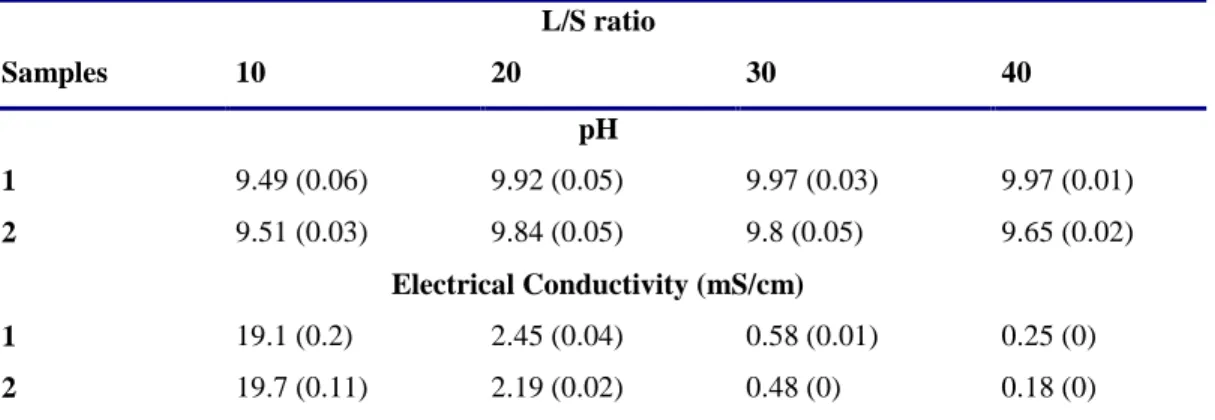
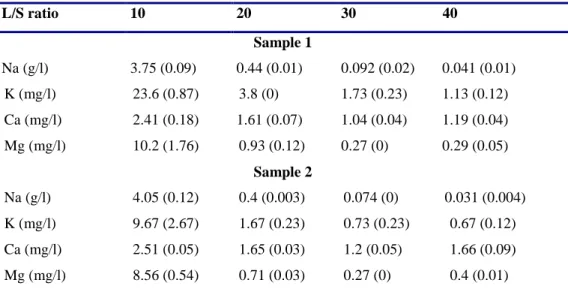
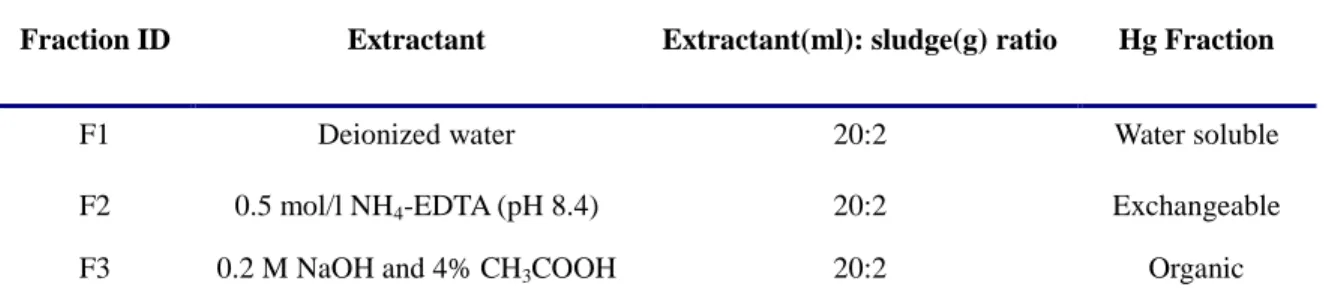
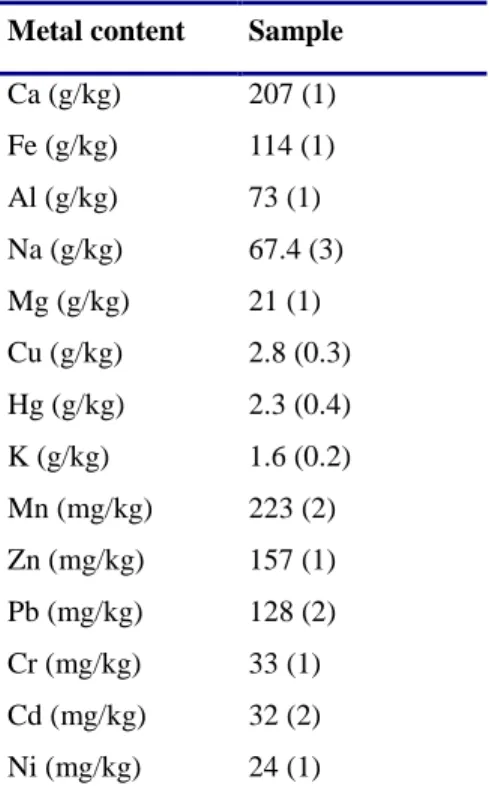
(13) LIST OF TABLES. LIST OF TABLES Table 1.1.. Countries with the highest mercury production capacities (adapted from UNEP, 2009)---------------------------------------------------------------------------------------. Table 2.1.. 8. Technologies for remediation of heavy metals contaminated soils, sediment and wastes-------------------------------------------------------------------------------. 16. Table 2.2.. Overview of mercury treatment technologies (adapted from USEPA, 2007)-------------. 17. Table 2.3.. Desorption temperatures for different mercury phases (Navarro et al., 2009)------------. 28. Table 3.1.. Chemical characteristics of the mercurial sludge---------------------------------------------. 46. Table 3.2.. Pseudo-total metal content of the mercurial sludge-------------------------------------------. 46. Table 3.3.. pH and electrical conductivity in the fractions of the DIN S4 leaching test---------------. 47. Table 3.4.. Metal concentration in the fractions of the DIN S4 leaching test---------------------------. 48. Table 4.1.. Extractants and Hg fractions defined in the sequential extraction procedure-------------. 58. Table 4.2.. Chemical characteristics of the mercury solid waste-----------------------------------------. 59. Table 4.3.. Pseudo total metal content and total Hg content----------------------------------------------. 60. Table 5.1.. Properties and metal contents of mercury sludge samples-----------------------------------. 68. Table 5.2.. pH and Hg concentrations in extracts according to the TCLP leaching test---------------. 69. Table 5.3.. Effects of time and temperature on residual ash content, residual Hg content and Hg removal efficiency--------------------------------------------------------------. Table 5.4.. Total mercury and mercury removal efficiency remaining after thermal treatment of the mercury sludges as a function of treatment temperature-----------------------------. Table 6.1.. 80. Empirical kinetic model (α) functions for solid state thermal decomposition reactions (Rodriguez et al., 2009)---------------------------------------------. Table 6.3.. 71. The reaction scheme representing the mercury removal of the mercury waste generated from the chlor-alkali process using thermal treatment---------------------------. Table 6.2.. 70. 82. Initial data and design parameters used in the thermal decomposition process (operating conditions of the simulated laboratory furnace)----------------------------------. 84 i.
(14) LIST OF TABLES. Table 6.4.. Properties and metal contents of mercurial sludge sample-----------------------------------. 86. Table 6.5.. Thermodynamic parameters (∆G, ∆H, Ke) of the chemical reaction mechanism--------. 89. Table 6.6.. Kinetic parameters (kj, αf, nr) obtained by the adjusted kinetic model for each operating temperature ----------------------------------------------------------. Table 6.7.. Comparison between maximum conversion values achieved by the experimental data and the simulated model----------------------------------------------------. Table 6.8.. 104. Definition of the inlet and outlet streams of the pilot-scale thermal treatment process------------------------------------------------------------------------. Table 7.3.. 94. Summary data of the drying test applied to the mercurial sludge sample at bench-scale-----------------------------------------------------------------------------. Table 7.2.. 92. Values of Activation energy (E) and Pre-exponential factor (A) of the chemical reactions involved in the proposed reaction scheme ----------------------. Table 7.1.. 91. 114. Design parameters and operating conditions of the pilot-scale thermal treatment plant---------------------------------------------------------------------------. 117. Table 7.4.. Equipment investment costs of the thermal treatment plant---------------------------------. 120. Table 7.5.. Estimation of the Total Capital Investment of the thermal treatment plant----------------. 120. Table 7.6.. Estimation of the Annual Total Production Cost (without depreciation) at 100% capacity of the thermal treatment plant for the Alternatives 1 and 2------------. 121. Table 7.7.. Capital spending and annual sales reported by the ELQUIM plant in 2011---------------. 123. Table 7.8.. Economic assessment of both integrated alternatives using static and dynamic economic indicators-------------------------------------------------------------------------------. ii. 124.
(15) LIST OF SYMBOLS. LIST OF SYMBOLS L/S. Liquid to solid ratio (unitless). CMR. Cumulative mercury leaching (mg Hg/kg dry sludge). F1. Water soluble fraction (unitless). F2. Exchangeable fraction (unitless). F3. Organic fraction (unitless). F4. Residual fraction (unitless). i. Components involved in each reaction (unitless). j. Chemical reactions (unitless). αi, βi, γi. Coefficients which correlate heat capacity and temperature for each component (kcal). Cp. Heat capacity of components in the thermodynamic analysis (kcal/mol K). T. Temperature (K). Tr. Reference temperature (K). Kej. Equilibrium constant (unitless). ∆G0. Gibbs free energy at reference temperature (kcal/mol). ∆H0. Heat of Formation at reference temperature (kcal/mol). ∆Gj. Gibbs free energy variable with temperature (kcal/mol). ∆Hj. Heat of Formation variable with temperature (kcal/mol). IKj. Integration constant to calculate ∆Gi (unitless). IHj. Integration constant to calculate ∆Hi (unitless). E. Activation energy (kJ/mol). A. Pre-exponential factor (min-1). R. Universal gas constant (kJ/mol K). i.
(16) LIST OF SYMBOLS. α. Total mercury conversion in the solid matrix (unitless). t. Retorting time (min). dα/dt. Variation of mercury conversion with the time (min-1). n0. Initial moles (mol). n. Final moles (mol). f(α). Mathematical function of referred at the total solid mercury converted (unitless). mT. Inlet sludge mass (g). nij. Moles of each component in each reaction (mol). Vlf. Volume of laboratory furnace (m3). Rj. Rate expression of each reaction. Pmi. Molecular weight (g/mol). Fi. Outlet molar flux of the process (mol/min). Rjfs. Kinetic reaction rate of thermal decomposition of Hg compounds in the solid phase. kj. Kinetic constant (min-1 g -1). nr. Reaction order (unitless). αf. Final conversion (%). pHgS. Partial pressure of HgS (atm). pO2. Partial pressure of O2 (atm). pHgSO4. Partial pressure of HgSO4 (atm). Fobj. Objective function to optimize the adjustment of the model kinetic parameters. αfmod. Final conversion by the model (%). αfexp. Final conversion by the experimental data (%). mT0. Sludge mass inlet to the laboratory furnace (g). ii.
(17) LIST OF SYMBOLS. hT0. Sludge humidity (g). xMs0. Mass fraction of HgS (g HgS/g total Hg). xMcm0. Mass fraction of HgCl2 (g HgCl2/g total Hg). xMm0. Mass fraction of metallic Hg (g Hg0/g total Hg). xMsu0. Mass fraction of HgSO4 (g HgSO4/g total Hg). xMT0. Total initial Hg content in the sludge/g of sludge (g total Hg/g sludge). xMO0. Organic matter content/g of sludge (g OM/g sludge). xCa0. Carbonate content/g of sludge (g CaCO3/g sludge). mMm. Desorbed mass of Hg (g). mCM. Desorbed mass of HgCl2 (g). mST. Desorbed mass of HgS (g). mSuT. Desorbed mass of HgSO4 (g). l, w, h. Length, width and height of the laboratory furnace (m). nut. Number of electric resistance strip. lt, lct. Length of the strip and hot strip (m). kwe. Power of the simulated furnace (kW/cm of steel). hair. Air humidity (%). mSdin. Sludge inlet mass in the drying (kg). mSdout. Sludge outlet mass in the drying (kg). mWdevap. Water evaporated mass in the drying (kg). fmWdout. Water outlet mass flow in the drying (kg/s). fmWdin(air). Water intlet mass flow (by the air) in the drying (kg/s). fmWdevap. Water evaporated mass flow in the drying (kg/s). i.
(18) LIST OF SYMBOLS. mWdin(sludge). Water inlet mass (by the sludge) in the drying (kg). mWdout(sludge). Water outlet mass (by the sludge) in the drying (kg). fmAdout. Air outlet mass flow in the drying (kg/s). fmAdin. Air intlet mass flow in the drying (kg/s). CpSd. Sludge heat capacity in the drying (kJ/kg °C). T2d. Outlet temperature in the drying (°C). T1d. Inlet temperature in the drying (°C). ηd. Efficiency of the drying equipment (%). Qcd(air). Heat liberated by the air (kJ/s). Qgd(sludge). Heat delivered by the sludge (kJ/s). λH2O. Latent heat of water (kJ/Kg). mMlfout. Mercury outlet mass in the laboratory furnace (g). mMflin. Mercury inlet mass in the laboratory furnace (g). mMlfgen. Mercury generated mass in the laboratory furnace (g). nMlf. Mercury inlet moles in the laboratory furnace (mol). nMClf. Mercury chloride inlet moles in the laboratory furnace (mol). nMSlf. Mercury sulphide inlet moles in the laboratory furnace (mol). nMSulf. Mercury sulphate inlet moles in the laboratory furnace (mol). nestM/nestMC. Stoichiometric molar ratio of Hg generated and HgCl2 consumed (unitless). nestM/nestMS. Stoichiometric molar ratio of Hg generated and HgS consumed (unitless). nestM/nestMSu. Stoichiometric molar ratio of Hg generated and HgSO4 consumed (unitless). MMHg. Molecular weight of mercury (g/mol). nOlfin. Oxygen inlet moles in the laboratory furnace (mol). ii.
(19) LIST OF SYMBOLS. nOlfout. Oxygen outlet moles in the laboratory furnace (mol). nOlfcons. Oxygen consumed moles in the laboratory furnace (mol). mOlfout. Oxygen outlet mass in the laboratory furnace (g). MMO2. Molecular weight of oxygen (g/mol). MMair. Molecular weight of air (g/mol). ρair. Density of humid air (kg/m3). mNlfout. Nitrogen outlet mass in the laboratory furnace (g). mNlfin. Nitrogen inlet mass in the laboratory furnace (g). MMN2. Molecular weight of nitrogen (g/mol). mSDlfout. Sulphur dioxide outlet mass in the laboratory furnace (g). mSDlfgen. Sulphur dioxide generated mass in the laboratory furnace (g). nestSD/nestMS nestSD/nestMSu MMSO2. Stoichiometric molar ratio of SO2 generated and HgS consumed (unitless) Stoichiometric molar ratio of SO2 generated and HgSO4 consumed (unitless) Molecular weight of sulphur dioxide (g/mol). mClfout. Chlorine outlet mass in the laboratory furnace (g). mClfgen. Chlorine generated mass in the laboratory furnace (g). nestC/nestMC. Stoichiometric molar ratio of Cl2 generated and HgCl2 consumed (unitless). MMCl2. Molecular weight of chlorine (g/mol). mWlfout. Water outlet mass in the laboratory furnace (g). mWlfin(air). Water inlet mass by the air in the laboratory furnace (g). mWlfin(sludge). Water inlet mass by the sludge in the laboratory furnace (g). mSlfout. Sludge outlet mass in the laboratory furnace (g). QR(LF). Heat liberated by the reactions in the laboratory furnace (kJ/s) i.
(20) LIST OF SYMBOLS. Qsludge(LF). Heat liberated by the sludge in the laboratory furnace (kJ/s). Qgases(LF). Heat liberated by the gases in the laboratory furnace (kJ/s). ∆HR(M). Heat of reaction of Hg (kcal/mol). ∆HR(MS). Heat of reaction of HgS (kcal/mol). ∆HR(MSu). Heat of reaction of HgSO4 (kcal/mol). ∆HR(MC). Heat of reaction of HgCl2 (kcal/mol). ∆T. Difference of working temperature in the laboratory furnace (°C). tlf. Total operating time in the laboratory furnace (min). Cpk. Heat capacity of k compounds in the laboratory furnace (kJ/g K). mk. Mass of k compounds in the laboratory furnace (g). k. Gaseous compounds of the laboratory furnace (Hg, Cl2, SO2, O2, N2 and H2O). VLF. Volume of the laboratory furnace (m3). mSerfout. Sludge outlet mass in the electric resistance furnace (kg). mSerfin. Sludge inlet mass in the electric resistance furnace (kg). mMerfevap. Mercury evaporated mass in the electric resistance furnace (kg). mWerfevap. Water evaporated mass in the electric resistance furnace (kg). mIGerfout. Incondensable gases outlet mass in the electric resistance furnace (kg). Sf. Scaled-up factor (unitless). mOerfout. Oxygen outlet mass in the electric resistance furnace (kg). mNerfout. Nitrogen outlet mass in the electric resistance furnace (kg). mCerfout. Chlorine outlet mass in the electric resistance furnace (kg). mSDerfout. Sulphur dioxide outlet mass in the electric resistance furnace (kg). ii.
(21) LIST OF SYMBOLS. ηERF. Efficiency of the electric resistance furnace (%). QR(ERF). Heat liberated (by the reactions) in the electric resistance furnace (kJ/s). Qsludge(ERF). Heat liberated (by the sludge) in the electric resistance furnace (kJ/s). Qgases(ERF). Heat liberated (by the gases) in the electric resistance furnace (kJ/s). Qg(ERF). Heat delivered in the electric resistance furnace (kJ/s). VERF. Volume of the electric resistance furnace (m3). fmWhe. Water mass flow in the heat exchanger (kg/s). fmIGhe. Incondensable gases mass flow in the heat exchanger (kg/s). fmMhe. Mercury mass flow in the heat exchanger (kg/s). fmAhe. Air mass flow in the heat exchanger (kg/s). ηHE. Efficiency of the heat exchanger (%). Qc(HE). Heat liberated by the gases in the heat exchanger (kJ/s). Qg(HE). Heat delivered by the air in the heat exchanger (kJ/s). CpIGhe. Heat capacity of incondensable gases in the heat exchanger (kJ/kg °C). CpvMhe. Heat capacity of mercury (vapor phase) in the heat exchanger (kJ/kg °C). CpvWhe. Heat capacity of water (vapor phase) in the heat exchanger (kJ/kg °C). λmercury. Latent heat of mercury (kJ/kg). CpLMhe. Heat capacity of mercury (liquid phase) in the heat exchanger (kJ/kg °C). CpLWhe. Heat capacity of water (liquid phase) in the heat exchanger (kJ/kg °C). CpmAhe. Heat capacity of humid air in the heat exchanger (kJ/kg °C). T1he. Air inlet temperature in the heat exchanger (°C). T2he. Air outlet temperature in the heat exchanger (°C). Tg(in). Gases inlet temperature in the heat exchanger (°C). i.
(22) LIST OF SYMBOLS. Tg(out). Gases outlet temperature in the heat exchanger (°C). Tb(Hg). Boiling temperature of mercury (°C). Tb(H2O). Boiling temperature of water (°C). mWstortaccum. Water accumulated mass in the storage tank (kg). mWstortin. Water inlet mass in the storage tank (kg). mWstoverflow. Water overflow mass in the sedimentation tank (kg). SW0. Sludge initial weight (g). CW. Crucible weight (g). Xf. Final humidity of the sludge after drying test (kg of water/kg of dry sludge). ∆X. Variation of the final humidity of the sludge (kg of water/kg of dry sludge). N. Drying regimen (unitless). ii.
(23) ABBREVIATIONS INDEX. ABBREVIATIONS INDEX AGP. Annual Gross Profit. AMAP. Arctic Monitoring and Assessment Programme. AMPL. Average Maximum Permissible Limit. BDAT. Best Demonstrated Available Technology. CAP. Chlor-Alkali plant. CFR. Code of Federal Regulations. CVAAS. Could Vapour Atomic Absorption Spectrometry. DIN. Deutches Institut Für Normung. DOE. Department of Energy. EEA. European Environment Agency. EEC. European Economic Community. EIA. Environmental Impact Assessment. ELQUIM. Electrochemistry Cuban plant. EU. European Union. FAO. United Nations Food and Agriculture Organization. FCI. Fixed Capital Investment. FRTR. Federal Remediation Technologies Roundtable. GMOS. Global Mercury Observation System. GWRTAC. Groundwater Remediation Technologies Analysis Center. ICP-OES. Inductivity Coupled Plasma Optical Emission Spectrometry. IPPC. Integrated Pollution Prevention and Control. IRR. Internal Rate of Return I.
(24) ABBREVIATIONS INDEX. ISO. International Standards Organization. ITRC. Interstate Technology and Regulatory Council. LCA. Life Cycle Assessment. LCIA. Life Cycle Impact Assessment. LDRs. Land Disposal Restrictions. MCCAPs. Mercury Cell Chlor-Alkali Plants. NATO/CCMS. NATO Committee on the Challenges of Modern Society. NC. Norma Cubana (Cuban standard). NIOSH. National Institute for Occupational Safety and Health. NPV. Net Present value. OM. Organic matter. OSPAR. Oslo and Paris Convention. PP. Payback period. PRC. Professional Regulation Commission. RAAG. Remediation Alternative Assessment Group. REL. Recommended Exposure Limit. REMERC. Retorting or Roasting with recovery of mercury for reuse. ROI. Return on investment. S/S. Stabilization/Solidification. SEP. Sequential Extraction Procedure. TCI. Total Capital Investment. TCLP. Toxicity Characteristic Leaching Procedure. TDAAS. Thermo Desorption Atomic Absorption Spectroscopy II.
(25) ABBREVIATIONS INDEX. TPC. Total Production Cost. TTLC. Total Threshold Limit Concentration. UNEP. United Nations Environment Programme. USEPA. United States Environmental Protection Agency. UTS. Universal Treatment Standard. WC. Working Capital. WHO. World Health Organization. III.
(26) ABBREVIATIONS INDEX. IV.
(27) ACKNOWLEDGEMENTS. ACKNOWLEDGEMENTS This research has been financially supported by the Belgian Programme for Institutional University Co-operation (VLIR-UCLV). Project 7: Environmental Education and Development of Clean Technologies. The research was conducted at three research groups: Research Group of the Laboratory of Analytical Chemistry and Applied Ecochemistry (ECOCHEM), Faculty of Bioscience Engineering, Ghent University, Coupure Links 653, 9000 Ghent, Belgium, URL: http://www.ecochem.ugent.be/. Department of Chemical Engineering, Chemical and Pharmacy Faculty, Central University "Marta Abreu" de Las Villas, Road to Camajuaní Km 5.5. Santa Clara, 54830 Villa Clara, Cuba, URL: http://www.uclv.edu.cu/. Study Center of Applied Chemistry, Chemical and Pharmacy Faculty, Central University "Marta Abreu" de Las Villas, Road to Camajuaní Km 5.5. Santa Clara, 54830 Villa Clara, Cuba, URL: http://www.uclv.edu.cu/.. IX.
(28) ACKNOWLEDGEMENTS. X.
(29) SUMMARY. SUMMARY Through the conventional chlor-alkali production process using mercury cells, large amounts of highly mercury (Hg) contaminated waste sludges are produced. This process is not considered good industrial practice anymore and is gradually being phased out. There is an urgent need for a proper management and disposal of mercury wastes generated by chlor-alkali plants worldwide. In Cuba, the Electrochemistry plant “Elpidio Sosa” (ELQUIM), located in the central region of the country, constitutes the main source of mercury pollution. This factory has been producing mercury solid wastes for more than forty years and has caused a widespread contamination with mercury in the surrounding environment. In the present study, a thermal treatment technology for decontamination of mercury containing wastes from chloralkali Cuba industry was developed. In a first part of this work, mercury contaminated wastes from a chlor-alkali plant in Cuba were characterised for mercury contents, fractionation and leaching behaviour. Total mercury content and concentrations in leachates from TCLP test were generally subjected to a large variability (Chapters 3, 5 and 7) demonstrating significant differences in the chlor-alkali production process quality as well as in the sludge stabilisation process done by the factory. Total mercury content of sludge samples was far above the environmental standard (260 mg/kg) stipulated by LDR 40 CFR, Part 268 US EPA. Consequently, the sludge was classified as “hazardous and high mercury waste”. Mercury leachability according to the US EPA TCLP leaching test was higher than the threshold value of 0.2 mg Hg/l, leading to a classification as toxic waste” according to US EPA regulations. The dynamic leaching study (German DIN 38414-S4 test) demonstrated that concentrations of mercury in the leachates were higher than 0.02 mg/l, the maximum limit for a waste to be landfilled according to the 1991 EEC Landfill Directive Draft. This was related to the presence of rather soluble species such as HgCl2. The mercury fractionation study revealed that up to 52% of the total Hg was present in the mobile fractions, that represent water-soluble and exchangeable mercury compounds. This suggests a high risk of Hg mobilisation. Moreover, the water-soluble fraction already accounted for 14% of total Hg, indicating the highly significant hazards that may arise if this material is not stored in tightly sealed conditions. It was clearly demonstrated that the current approach used by the chlor-alkali Cuban plant to stabilize the sludge has not been effective. A second part of this work deals with the potential of thermal treatment for decontamination of mercury containing wastes from chlor-alkali industry. This treatment was selected because it represents the best demonstrated available technology for the treatment of wastes containing more than 260 mg/kg of mercury (high mercury wastes). The effects of temperature and treatment time on both residual mercury levels and mercury leachability were investigated. In small-scale experiments, it was shown that i.
(30) SUMMARY. this treatment reduces the total mercury content as well as the leachability of the residual mercury. The high mercury removal efficiency (close to 100%) and leachability values below the threshold value of 0.2 mg Hg/l after treatment at a temperature of 400 °C or higher, demonstrated that thermal treatment technology may be used to effectively remove the mercury. In the third part of this work, a reaction mechanism was proposed to describe mercury removal from solid wastes generated by the chlor-alkali process during thermal treatment. The proposed model was compared to nine previously models reported in the literature, to elucidate the controlling reaction mechanisms. The kinetic model that best describes the thermal decomposition of the mercury solid waste can be represented by the general expression of Rj = kj∙ (αf - α)nr. The kinetic parameters (kj, αf and nr) of the chemical reactions involved have been determined. No single mechanism is ruling the process. At high retention times, the diffusion mechanism could be considered the controlling step of the thermal decomposition process while at low times (< 15 min), the third order reaction mechanism also could be controlling the process. Nevertheless, as a first depth-in to the knowledge of the thermal decomposition of this type of systems, polydisperse and multicomponent (mercurial sludge), the diffusion mechanism (D1) can be considered the overall controlling stage as an increase of temperature smooth the progress of the chemical reactions involved. In the last part of this work, a pilot-scale thermal treatment technology to treat high mercury containing wastes generated by the chlor-alkali Cuban plant was designed. The proposed pilot plant with 960 ton of sludge/y of processing capacity would be able to recover 639 kg of metallic Hg/y and 479 ton/y of treated sludge (“arid”) that can be valorized as construction material. Two operating conditions (alternatives) were evaluated considering as the first alternative working conditions suited to achieve a maximum mercury removal, and as the second alternative, working conditions that allow treating the waste up to a point that it meets TCLP leaching criteria. An integral economic analysis for both alternatives of the proposed technology was performed in the context of the currently operating chloralkali plant in Cuba. The second alternative constitutes the most attractive option. An annual gross profit of US$ 166 450, a return on investment of 10.6 %/y, a net present value of US$ 12 157 and an internal rate of return of 15% could be realised under that scenario. Finally, an environmental impact assessment for both operational alternatives and the current treatment applied by the chlor-alkali Cuban plant using Life Cycle Analysis was developed. Also from an environmental point of view alternative 2 emerged as the preferable option. Compared to the existing treatment that is applied in Cuba, the newly proposed technology could reduce the damage on human health by 95%. At the same time, it could reduce the damage on the ecosystem quality by 83% and damage on the resources by 78%. For Cuban conditions, the implementation of the proposed thermal treatment technology (alternative 2) although stand for a project of significant costs, represents considerable benefits for the environment and human health. ii.
(31) SAMENVATTING. SAMENVATTING Via het conventionele chlooralkali productieproces met kwikcellen worden grote hoeveelheden slibafval gegenereerd, die sterk vervuild zijn met kwik (Hg). Dit procestype wordt niet langer beschouwd als een valabele industriële optie en wordt bijgevolg stapsgewijs afgebouwd. Wereldwijd is er dringend nood aan correct beheer en verwerking van kwikhoudend afval geproduceerd door de chlooralkali industrie. De voornaamste bron van kwikvervuiling in Cuba is het elektrochemisch bedrijf “Elpidio Sosa“ (ELQUIM), gelegen in de centrale regio van het land. Deze fabriek genereert al meer dan veertig jaar lang vast kwikhoudend afval, wat geleid heeft tot een uitgebreide kwikvervuiling in de omgeving. In deze studie werd een thermische behandelingsmethode voor kwikhoudend afval afkomstig van de chlooralkali industrie in Cuba ontwikkeld. In een eerste deel van deze thesis werd kwikhoudend afval afkomstig van een Cubaanse chlooralkali installatie grondige gekarakteriseerd op kwikgehalte, fractionering en uitlooggedrag. Totaal gehalte kwik in het slibafval alsook de kwikconcentratie in de percolaten van TCLP tests vertoonden over het algemeen een grote variabiliteit (hoofdstukken 3, 5 en 7), duidend op significante verschillen in de kwaliteit van het chlooralkali productieproces en het slib stabilisatieproces uitgevoerd door het bedrijf. Het gemeten totale gehalte aan kwik in de slibstalen lag ver boven de milieunorm (260 mg/kg) bepaald door “LDR 40 CFR, PART 268 US EPA”, waardoor het slib geclassificeerd kan worden onder de noemer “schadelijk en hoog geconcentreerd kwikafval”. De uitloogbaarheid van kwik, bepaald via US EPA TCLP uitloogtesten, lag hoger dan de drempelwaarde van 0.2 mg Hg/l, waardoor het slib volgens de richtlijnen van de US EPA geclassificeerd kan worden als “toxisch afval”. Met een dynamische uitloogproef (Duitse DIN 38414-S4 test) werd aangetoond dat het kwikgehalte in de percolaten hoger lag dan 0.02 mg Hg/l, de in de “1991 EEC Landfill Directive Draft” richtlijn vastgelegde maximale waarde om afval te mogen storten. Dit was gerelateerd aan de aanwezigheid van eerder oplosbare kwik species zoals HgCl2. Met een fractioneringstest werd aangetoond dat tot 52% van het totale kwikgehalte terug te vinden was in de mobile fracties, die water oplosbare en uitwisselbare kwikverbindingen uitmaakt. Dit suggereert een verhoogd risico op Hg mobilisatie. Bovendien werd er aangetoond dat reeds 14% van het totale kwikgehalte terug te vinden was in de water oplosbare fractie, indicatief voor de bijzonder significante gevaren die kunnen ontstaan wanneer dit materiaal niet opgeslagen wordt in goed afgesloten condities. Er werd duidelijk aangetoond dat de huidige benadering van het Cubaanse chlooralkali bedrijf om het slib te stabiliseren, niet bijster effectief is. Het tweede deel van dit werk behandelt het potentieel van thermische behandeling om met kwik vervuild afval afkomstig uit de chlooralkali industrie te saneren. Deze behandeling werd geselecteerd daar het momenteel de best beschikbare technologie is om afval met een kwikgehalte van meer dan 260 mg/kg i.
(32) SAMENVATTING. (hoog geconcentreerd kwikafval) mee te behandelen. Het effect van temperatuur en behandelingstijd op zowel het residueel als uitloogbaar kwikgehalte werd onderzocht. Met behulp van kleinschalige experimenten werd aangetoond dat zowel het totale gehalte aan kwik alsook de uitloogbaarheid van residueel kwik verminderd konden worden. De hoge verwijderingsefficiëntie van kwik (~100%) en uitlooggehalten lager dan 0.2 mg Hg/l na behandeling bij 400°C of hoger, toonde aan dat thermische behandeling doeltreffend gebruikt kan worden om kwik te verwijderen. In een derde deel van dit werk werd een reactiemechanisme voorgesteld om kwik verwijdering vanuit vast afval, gegenereerd door de chlooralkali industrie tijdens thermische behandeling, te beschrijven. Het voorgestelde reactiemechanisme werd vergeleken met negen eerder in de vakliteratuur gerapporteerde reactiemechanismes, om dusdanig de controlerende reactiemechanismen op te helderen. Het kinetisch model dat de thermische decompositie van het vast kwikhoudend afval het best beschrijft kan worden voorgesteld door volgende algemene uitdrukking: Rj = kj . (αf – α)nf. De kinetische parameters (kj, αf en nf) van de betrokken chemische reacties werden bepaald. Geen eenzijdig mechanisme beheerst het proces. Bij hoge retentietijden kan het diffusie mechanisme beschouwd worden als de controlerend stap in het thermische decompositie proces, terwijl bij korte tijden (<15 min) mogelijk ook een derde orde reactiemechanisme het proces wou kunnen controleren. Desondanks kan, als eerste diepgaande kennis inzake de thermische decompositie van dit type systemen (polydispers en multi component kwikhoudend slib), het diffusie mechanisme beschouwd worden als het algehele stadium wanneer het verhogen van temperatuur de progressie van de betrokken chemische reacties afvlakt. Tenslotte werd in het laatste deel van deze thesis een thermische behandelingstechnologie op pilootschaal ontwikkeld ter behandeling van hoog kwikhoudend afval, gegenereerd door de Cubaanse chlooralkali fabriek. Het voorgestelde pilootbedrijf met een verwerkingscapaciteit van 960 ton slib per jaar zou in staat zijn om 639 kg metallisch Hg per jaar alsook 479 ton behandeld slib dat gevaloriseerd kan worden als bouwmateriaal, te recupereren. Twee werkingscondities werden geëvalueerd waarvan het eerste alternatief, werkingscondities het best geschikt voor maximale kwikverwijdering, en het tweede, werkingscondities die toelaten het afval te behandelen zodanig de TCLP uitloogcriteria bereikt worden. In de context van de huidig werkzame chlooralkali installatie in Cuba werd er een integrale economische analyse uitgevoerd voor beide alternatieven van de voorgestelde technologie. Het tweede alternatief werd als de meest attractieve optie aangewezen. Onder dat scenario werd een jaarlijkse brutowinst (annual gross profit) van US$ 166 450, een investeringsrendement (return on investment) van 10.6% per jaar, een netto contante waarde (net present value) van US$ 12 157 en een intern rendement (internal rate of return) van 15% bewerkstelligd. Tenslotte werd er een milieueffectrapportage via “Life Cycle Analysis” ontwikkeld voor zowel de beide technologische alternatieven als voor het huidig procedé toegepast door het Cubaanse chlooralkali bedrijf. Vanuit milieukundig standpunt is alternatief twee eveneens als ii.
(33) SAMENVATTING. geprefereerde optie uit de bus gekomen. In vergelijking met het bestaande behandelingsproces in Cuba zou dit alternatief namelijk leiden tot een significante vermindering in milieuschade en -impact. Zo zou bijvoorbeeld de schade voor de menselijke gezondheid met 95%, op de kwaliteit van het ecosysteem met 83% en op de middelen met 78% verminderd kunnen worden. Ondanks het feit dat het voorgestelde thermische behandelingsprocedé (alternatief twee) naar Cubaanse normen een substantiële kost inhoudt, zou de implementatie hiervan zowel voor het milieu als voor de mens significante voordelen inhouden.. iii.
(34) SAMENVATTING. iv.
(35) GENERAL INTRODUCTION AND CONCEPTUAL FRAMEWORK. CHAPTER 1. GENERAL INTRODUCTION AND CONCEPTUAL FRAMEWORK 1.1. A global view of mercury pollution Mercury has been recognized as a global pollutant and toxic hazard since ancient times (Hylander and Goodsite, 2006) and is considered a priority matter in the European Union (European Parliament, 2006). Certain forms of mercury can be transported globally following releases to the environment from both natural and anthropogenic sources. Environmental mercury levels have increased considerably in recent years. Even regions with no significant emissions, such as the Arctic, are affected by the transcontinental transport of mercury (Streets et al., 2005). Modeling studies have confirmed the ability of elemental mercury and mercury compounds to be transported over long distances (Seigneur et al., 2001; Travnikov and Ryaboshapko, 2002; Dastoor and Larocque, 2004). 1.1.1. Natural and anthropogenic sources of mercury The Global Mercury Assessment by the United Nations Environment Programme (UNEP, 2002) has found that nearly every part of the Earth’s ecosystem, including air, soils, sediments, vegetation, and water, contains some mercury due to natural degassing or volatilization of mercury from the earth’s crust. Furthermore, it distinguished four types of emissions: primary natural sources, primary anthropogenic sources, secondary anthropogenic sources, re-mobilization and re-emission. Primary natural sources of mercury include volcanic eruptions, crustal degassing, and emissions from forest, lakes and oceans (Dommergue et al., 2002). Natural sources of mercury are responsible for about 40% of the total mercury released annually (550 ton) to the European atmosphere (Pacyna et al., 2001; Pirrone, 2001). Two groups of anthropogenic sources of mercury can be distinguished: primary anthropogenic sources and secondary anthropogenic sources. Primary anthropogenic sources are those where mercury of geological origin is mobilized and released to the environment. The two main sources within this category are mining and extraction and burning of fossil fuels which contain mercury as a trace contaminant. Secondary anthropogenic sources are those where emissions occurs from the intentional use of mercury, including mercury use in industrial processes, products, dental applications, or in artisanal and small-scale gold mining (ASGM) operations. Emissions to the environment from both primary and secondary sources can occur via direct discharge of exhaust gases and effluents, and through the generation of mercurycontaining wastes (Pacyna et al., 2010). A fourth type of emission was distinguished by UNEP (2002). Mercury can also be re-mobilized and re-emitted to the air. Re-mobilization occurs when mercury that had been taken out from atmospheric circulation is released again. For instance, mercury accumulated in soils or sediments may be remobilized by rain or floods to enter the aquatic system. Mercury taken up by vegetation can be re-emitted to the atmosphere during forest fires or biomass burning (UNEP, 2008). 1.
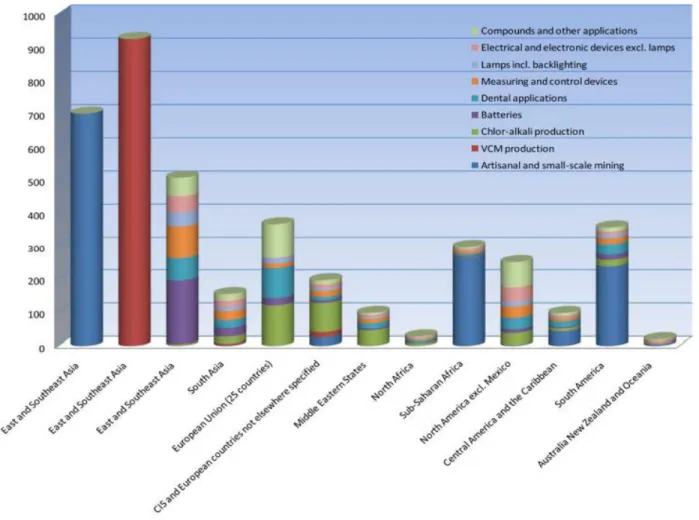
(36) CHAPTER 1. GENERAL INTRODUCTION AND CONCEPTUAL FRAMEWORK. According to Reis et al. (2009) the anthropogenic emissions are leading to a general increase in mercury on local, regional and global scales. Of the primary anthropogenic sources of mercury, the principle sources are those where mercury is emitted as an unintentional side contaminant by-product. With the exception of mercury mining itself, the mercury emissions arise from mercury that is present as an impurity in the fuel or raw material used. The main emissions are from sectors that involve combustion of coal or oil, production of pig iron and steel, of non-ferrous metals, and cement (Streets et al., 2005; Pacyna et al., 2006). Secondary anthropogenic sources of mercury are these related to emissions from intentional mercury use. The three largest sources are artisanal and small-scale gold mining (ASGM) (Telmer and Veiga, 2008), production of vinyl chloride monomer (VCM), with the use of mercuric chloride as a catalyst, and the chlor-alkali industry (Swain et al., 2007). Other mercury uses like batteries, dental amalgam, mercurycontaining measuring and control devices (thermometers, barometers and manometers) and mercurycontaining lamps, among others (Figure 1.1), are still considerable (AMAP/UNEP, 2008).. Figure 1.1. Global mercury consumption by application and by region expressed in tonnes (Maxson, 2010 cited in Pirrone, 2012). 2.
(37) GENERAL INTRODUCTION AND CONCEPTUAL FRAMEWORK. CHAPTER 1. As a result of anthropogenic emissions, the global atmospheric Hg deposition rate is approximately three times higher than in pre-industrial times and has increased by a factor of 2-10 in and around the most industrialized regions (Meili, 1995; Bergan et al., 1999; Martinez-Cortizas et al., 1999; Lamborg et al., 2002). The chlor-alkali industry represents the third major mercury user worldwide (AMAP/UNEP, 2008). In this process, very large quantities of liquid mercury are used as a cathode in electrolytic cells to produce chlorine, sodium hydroxide and hydrogen by electrolysis of brine solution (Southworth et al., 2004). In the United States, mercury cell chlor-alkali plants (MCCAPs) were estimated to be the largest noncombustion anthropogenic sources of atmospheric mercury pollution, emitting 6.5 ton/y from the 14 operating plants in 1994-1995 (USEPA, 1997d). In 2000 chlor-alkali industry was responsible for about 17% (40.4 ton/y) of the anthropogenic total mercury emissions in Europe (Pacyna et al., 2006). In Western Europe, the total mercury emissions to the air, water and waste products from the chlor-alkali plants were 9.5 ton in 1998. At the level of the individual plant, mercury emissions between 0.2 and 3 g Hg/ton of produced chlorine have been reported (IPPC, 2001). The amount of Hg in wastes from chloralkali productions only in the European Union has been estimated at about 990 ton (Mukherjee, 2004). Significant and negative impacts to the human health and environment can be correlated with the mercury due to its unique high toxicity, volatility, and persistence in the environment and easiness of bioaccumulation (Zhang et al., 2009). However, its impacts are directly linked with the mercury form which acts as a contaminant. After more than 50 years of the Minamata disaster in Japan, the negative effects on the environment and human health due to methylmercury (MeHg) poisoning are still observed. Only in 1995, MeHg poisoning which is also known as Minamata disease, caused the death of 1043 people in Japan (Harada, 1995). 1.2. Mercury in the environment Mercury is present in the environment in a number of forms including elemental mercury (Hg0), inorganic mercurous (Hg+) and mercuric (Hg2+) salts and as organic compounds (e.g. methyl-, ethyl and phenyl-mercury). Each form has different physicochemical properties and toxicity profiles (Clarkson, 1997; Goldman and Shannon, 2001). Once released into the environment (Figure 1.2), the various forms of mercury are subject to complex inter-conversions, principally through oxidation–reduction and methylation–demethylation reactions involving bacteria, and to transport on a global scale, processes that together are termed as the ‘mercury cycle’ (Clarkson, 1997).. 3.
(38) CHAPTER 1. GENERAL INTRODUCTION AND CONCEPTUAL FRAMEWORK. Figure 1.2. Schematic of the mercury transport cycle (Subir et al., 2011). The organic forms are the principal human source of mercury pollution since all forms of organomercury are strongly accumulated in living organisms (Sharma, 1993). Methylmercury (MeHg) is the most stable of the organo-mercury compounds and hence is the primary concern regarding human exposure to this type of mercury (European Commission, 2006). Any mercury form however has to some extent negative impacts on the environment and human health. A considerable body of evidence from experimental animal studies of the toxic effects that may arise from short-term (acute) and prolonged (chronic) exposures to the various types of mercury compounds (Bull, 2007) is now available. 1.3. Mercury impacts to the environment and human health The environmental impact of Hg emissions from MCCAPs has been demonstrated in several studies (Lodenius and Tulisalo, 1984; Baldi and Bargagli, 1984; Maserti and Ferrara, 1991; Gonzalez, 1991). Workplace environments presenting the largest potential sources of occupational exposure to mercury include chlor-alkali production facilities and cinnabar mining (Dikshith and Diwan, 2003). On the other hand, dietary intake is the most important source of nonoccupational exposure to mercury, with fish and other seafood products being the dominant source of mercury in the diet (WHO 1990, 1991). For the human health several diseases have been correlated with mercury pollution depending on the mercury form and the time and quantity that the human have been exposed. Mercury is a highly toxic metal that affects the nervous and cardiovascular systems. Nausea, vomiting, diarrhea and severe kidney damage may occur due to exposure to high doses of mercury over a short period of time. Hallucinations, memory loss, nerve damage and the inability to concentrate can occur. Symptoms also include tremors, loss of dermal sensitivity, slurred speech and, in rare cases, even paralysis and death (Nierenberg et al.,. 4.
(39) GENERAL INTRODUCTION AND CONCEPTUAL FRAMEWORK. CHAPTER 1. 1998). Chronic degenerative diseases of the nervous system such as Alzheimer’s disease are likely caused or exacerbated by mercury released from amalgam (Clarkson, 2002). On the other hand, the negative impacts of mercury pollution on the environment are mainly due to its potential of biomagnification, bioconcentration and bioaccumulation throughout the food chain (Yi et al., 2011). Over the last decades, increased awareness of the environmental and human health impacts of mercury has led to stronger regulations against mercury emissions, leading to decreased emissions (Schroeder and Munthe, 1998). 1.4. Regulatory considerations on mercury contaminated wastes One of the major concerns from the chlor-alkali mercury emissions are the mercury solid waste generated by the industrial process. In the future there will be fewer and fewer mercury cells operating, as the older plants are shut down or converted into technology membrane cells. During the remaining life of mercury cell plants, however, measures should be taken to minimize current and future mercury emissions from handling, storage, treatment and disposal of mercury-contaminated wastes (Directive 2008/1/EC, 2008). In the United States, the management and ultimate disposal of mercury hazardous wastes is controlled by USEPA (2008a) regulations known as the Land Disposal Restrictions (LDRs) (40 CFR, Part 268). Under the current LDR program, the USEPA has established thermal recovery (e.g., roasting/retorting) as the best demonstrated available technology (BDAT) for treatment of wastes containing more than 260 mg/kg of mercury. For treatment of wastes with less than 260 mg/kg of mercury, other extraction technologies (e.g., acid leaching) or immobilization technologies (e.g., stabilization/solidification) may be considered (USEPA, 1997c). The toxicity characteristic leaching procedure (TCLP) in the EPA publication SW-846 plays an important role in determining whether or not the material can be accepted by a landfill. According to the LDR rules (40 CFR, Part 261), mercury hazardous waste is defined as any waste that has a TCLP value greater than 0.2 mg/l (USEPA, 1992). Mercury-contaminated wastes that exceed this value generally must be treated to meet the Universal Treatment Standard (UTS) of 0.025 mg/l or less prior to disposal in a landfill. In addition, some states may set criteria that define hazardous wastes given the total metal concentration such as California’s Total Threshold Limit Concentration (TTLC) of 20 mg/kg for mercury (Randall and Chattopadhyay, 2004). Moreover, according to the European Economic Community (EEC) Landfill Directive Draft of 1991 (Directive 91/689/EEC, 1991) mercury hazardous waste is defined as any waste that has a DIN 38414-S4 test value greater than 0.02 mg/l of mercury in the leachates (Bayar et al., 2009). The Basel Convention stipulated that all wastes having mercury, mercury compounds and mercury vapour are hazardous wastes (Basel Convention, 1989). Furthermore, detailed classifications of 5.
(40) CHAPTER 1. GENERAL INTRODUCTION AND CONCEPTUAL FRAMEWORK. hazardous waste in EU countries are available in the publication of the European Environment Agency (EEA, 1999, 2001). The stricter application and control of previous regulations could help largely to reduce the high levels of mercury pollution in the world. In line with this, over the past decades special attention has been paid to the mercury cell chlor-alkali production process due to the toxic nature of mercury and the significant amount of mercury solid wastes generated from its use (OSPAR, 2005). 1.5. Mercury cell chlor-alkali process Chlor-alkali manufacturing industry produces chlorine, hydrogen and sodium hydroxide through electrolysis of saline solution. The primary product is Cl2. There are three main electrolytic production technologies used in the chlor-alkali industry, diaphragm cell, mercury cell and membrane cell (Schmittinger, 1991). In the mercury cell chlor-alkali process, elemental mercury (Hg0) is used as a flowing cathode in the electrolytic cells where the process can be divided into three large phases, brine purification, electrolysis and purification of the obtained products (Melián-Martel et al., 2011). The overall electrochemical reaction is as follows:. 2 NaCl 2 H2O energy Cl2 H2 2 NaOH. (1.1). The Hg electrolytic cell consists of an electrolyser and a decomposer. In the electrolyser section, a sodium chloride (NaCl) brine solution flows concurrently above the Hg0 cathode. A high current density is applied between the Hg0 cathode and metal anodes, and chlorine gas (Cl2) forms at the anode while a sodium amalgam forms at the Hg0 cathode. The amalgam is separated from the brine in the discharge endbox and then enters the decomposer, where deionised water is added. In the decomposer, the amalgam becomes the anode to a short circuited cathode of graphite pellets yielding hydrogen (H 2) gas and sodium hydroxide (NaOH) plus liberation of Hg0. The Hg0 is then recycled to the inlet end-box, where it re-enters the electrolyser (Kinsey et al., 2004). In the electrochemical process, mercury solid wastes are formed in the brine purification stage before passing through the electrolytic cells. Several compounds are added to the brine solution as a precipitation agent (sodium hydroxide and carbonate) to remove calcium and magnesium followed by a filtration step. After the filter is washed, the mud with water goes to a recirculation pool to keep the sludge in suspension. Next, it is pumped to a decanter and Na2S is added to stabilize the obtained sludge (Gonzalez, 2004, 2008) by means of HgS formation. It has been reported by Brandon et al. (2001) that also H 2S can be added to aqueous solutions (containing Hg2+ ions) to form black HgS (metacinnabar) and it will exist indefinitely at room temperature. 6.
(41) GENERAL INTRODUCTION AND CONCEPTUAL FRAMEWORK. CHAPTER 1. From comparison with diaphragm or membrane processes, mercury cell technology has the advantage that a high purity caustic soda is produced by merely simple brine purification (IPPC, 2001). Nevertheless, it is the most environmental unfriendly technology. Is well known that for most processes where mercury is used, mercury-free alternatives exist. Consequently, many of the uses of mercury are declining, at least in some regions, as alternative products or processes are adopted (UNEP, 2008). Regarding with this, new trends in the use of this heavy and toxic metal have been coming up. 1.6. Trends in the use of mercury cell chlor-alkali plants Mercury cell chlor-alkali plants are not anymore considered good industrial practice and the Integrated Pollution Prevention and Control (IPPC) of the European Union has indicated that chlor-alkali installations require obtaining licenses based in the Best Available Techniques (Directive 2008/1/EC, 2008). Membrane cell technology is considered the best available alternative technology. A report from the Euro-Chlor Association (Eurochlor, 2011) revealed a constant decrease, but still significant, emission of mercury from chlor-alkali plants. In 1990, global anthropogenic mercury releases to the atmosphere from sources associated with incidental pollutant emissions, and the intentional use of mercury in the Chlor-alkali industry were estimated at about 1910 ton. However, in 2005 global emissions inventories estimated a total emission at about 1480 ton (Figure 1.3). The greatest decreases were in Europe, with substantial declines also in North America, reflecting the introduction and wider use of emission control technologies (AMAP/UNEP, 2008).. Figure 1.3. Trends in mercury emissions by region from 1990 until 2005 (AMAP/UNEP, 2008) 7.
(42) CHAPTER 1. GENERAL INTRODUCTION AND CONCEPTUAL FRAMEWORK. According to data compiled by the UNEP during the Global inventory of mercury cell chlor-alkali facilities (UNEP, 2009), 100 facilities in 44 countries today have some industrial mercury cell chlorine production capacity. Although fewer and fewer mercury cells will be operating in the future, currently only 12 countries have plan for closure or conversions to non-mercury technology during the period 2010 to 2015 (Table 1.1). Table 1.1. Countries with the highest mercury production capacities (adapted from UNEP, 2009) Country. Existing Mercury Cell Facilities. Mercury Chlorine Production Capacity 2010a. Plans for Closure or Conversions to Non-Mercury Technology 2010-2015. Germany. 6. 870. Ludwigshafen (BASF) not specified conversion/closure date in permit. Akzo Nobel (Ibbenburen) conversion or closing estimated between 2010-2015. Evonic (Degussa) not specified conversion/closure date in permit. Akzo Nobel (Frankfurt) - conversion estimated by 2010.. Spain. 7. 732. All Spanish plants have to submit a plan for conversion or closure by 2011.. France. 6. 690. Jarrie plant expected to convert in 2012, Solvay Tavaux - 2 out of 4 units use mercury, 1 is being converted in 2010.. United States. 4. 437. Belgium. 2. 420. Russia. 3. 401. Iran. 4. 332. United Kingdom. 1. 277. Brazil. 4. 217. Cubab. 1. 7. Note:. a. In thousands of tons of chlorine capacity.. Tessenderlo and Antwerp plants plan to switch to membrane technology in 2015 and 2012, respectively.. b. Cuba in comparison.. Although this process seem to be in decline around the world, it still accounts for roughly 15% of the global mercury demand, representing a significant source of local and global mercury pollution (Ulrich et al., 2007; Mahan and Warner, 2009; Reis et al., 2009). The closure or conversion of mercury cell chloralkali plants constitutes a huge challenge mainly for developing countries where the change is needed for. 8.
(43) GENERAL INTRODUCTION AND CONCEPTUAL FRAMEWORK. CHAPTER 1. environmental reasons but it may not be economically viable. In Cuba, the one mercury facility existing (Table 1.1) represents the major source of mercury pollution in the country and has become a significant concern. 1.7.. Mercury pollution in the Cuban context. In Cuba, production of chlorine and caustic soda by using mercury cell technology dates back of the 30s, when a small chlor-alkali facility was installed in Sagua La Grande city, in the central region of the country (Figure 1.4). The industry went through several owners and adopted different trade names over the years. Due to a growth of the country's population and an increase of the economic and industrial activity after 1959, the capacity of that chlor-alkali plant was found to be insufficient. There was an increase in the import of these products. A new chlor-alkali plant “Elpidio Sosa” (ELQUIM) with higher production capacity was installed. That plant, which currently still is in use, has a daily production capacity of 48 t of chlorine gas and 108 t of caustic soda at 50% concentration.. Figure 1.4. Map of Sagua La Grande region (Díaz-Asencio et al., 2009).. Currently, the Electrochemistry “Elpidio Sosa” (Figure 1.5) is the only industry of its kind in the country. It covers the domestic demand for these products, and the surplus is exported to the Caribbean region.. 9.
(44) CHAPTER 1. GENERAL INTRODUCTION AND CONCEPTUAL FRAMEWORK. Figure 1.5. Satellite picture of Electrochemical plant “Elpidio Sosa”.. 1.7.1. Mercury solid waste generated from the chlor-alkali process Mercury solid wastes from “Elpidio Sosa” chlor-alkali Cuban plant were obtained during the brine purification stage of the electrolytic process as detailed above (section 1.5.). Once the sludge is formed, it is disposed in concrete niches. According to data provided by the plant, the sludge has total mercury contents ranging between 1000-2000 mg/kg. However, concentrations in excess of 5000 mg/kg of total mercury were found (Current work, Chapter 3). Taking in to account the toxicity and volatility of this heavy metal and the higher content found in the sludge, regulations for its proper management, transport and disposal constitute the key to control its damage. 1.7.2. Cuban legislation In Cuba, the only legislation that sets a regulatory value for Hg is the norm NC 27:1999 “Disposal of residuary waters to soil waters and sewerage. Specifications” (NC 27/1999, 1999) where 0.01 mg/l is set as the average maximum permissible limit (AMPL) for mercury in liquid waste. According to EPA regulations and due to the chemical characteristic of these mercury contaminated wastes, they can be categorized as hazardous wastes, and in particular as high mercury wastes with more than 260 mg/kg of total mercury. The best demonstrated available technique (BDAT) established by US EPA for a proper management of this sludge require a thermal recovery treatment to reduce or remove completely the mercury from this sludge. However, in Cuba another management of this mercurial sludge has been followed.. 10.
(45) GENERAL INTRODUCTION AND CONCEPTUAL FRAMEWORK. CHAPTER 1. 1.7.3. Management of mercury solid wastes Once the sludge is formed (see section 1.5.), it is hand-transported by the plant’s workers for disposal in concrete niches (Figure 1.6). The current storage of this waste in concrete niches is inadequate, allowing Hg to leach from the waste. The regular occurrence of natural disasters such as hurricanes (very often in Cuba), inundations and earthquakes aggravates the risks for dispersion of Hg into the environment.. Figure 1.6. Pictures of the concrete niches located around the electrochemical plant.. In 2008 the Cuban government approved plans for a change in technology from mercury electrolytic cells to membrane based technology. While this transition will prevent further production of mercury contaminated waste, thousands of tons of mercurial sludge are currently stored in the surroundings of the plant, constituting a potential hazard to human health and environment. The conversion of this technology into a cleaner technology (membrane) is needed for environmental reasons and it should occur before 2020 in order to comply with the international regulations (UNEP, 2007) and the Cuban environmental strategy. Nevertheless, the required timing to achieve this conversion can not be set with certainty. Recycling of waste is higher up the “waste management hierarchy” than landfill disposal (Mukherjee, 2004). If economically or environmentally viable, hazardous waste should be recycled, limiting the risk to environment and public health. Several technologies can be applied to treat hazardous mercury wastes such as stabilization/solidification, soil washing, acid leaching, vitrification and thermal treatment. This will be reviewed in Chapter 2. Many studies and technological treatments over the world have been developed to treat mercury contaminated wastes efficiently. Nevertheless, in Cuba, no research has been conducted to treat the hazardous mercury wastes generated by the electrochemical Cuban plant.. 11.
Figure


+7
Documento similar