Removal of dichloromethane from waste
gases using a fixed-bed biotrickling filter
and a continuous stirred tank bioreactor
LAURA BAILÓN1, YOLANDA DOPICO1, MARCELL NIKOLAUSZ2, MATTHIAS KÄSTNER2,
MARÍA C. VEIGA1AND CHRISTIAN KENNES1
1 Chemical Engineering Laboratory, Faculty of Sciences, University of La Coruña,
Rúa Alejandro de la Sota, 1, 15008 – La Coruña, Spain
2 Department of Bioremediation, UFZ-Centre for Environmental Research Leipzig-Halle GmbH,
Permoserstr. 15, 04318 – Leipzig, Germany
ABSTRACT
A laboratory scale fixed bed biotrickling filter (BTF) and a continuous stirred tank bioreactor (CSTB) have been studied and compared for the elimination of dichloromethane from waste gases. The DCM removal efficiency in the trickling filter was > 85% for inlet loads up to 25 g.m-3.h-1 and a
maximal removal capacity of about 170 g.m-3.h-1 was achieved at a load of 350 g.m-3.h-1. The
continuous stirred tank bioreactor showed removal efficiencies > 90% for inlet loads up to 120 g.m-3.h-1. At this load the maximal removal capacity of the system was reached, i.e. about
100 g.m-3.h-1. Thus, higher maximum elimination capacities were reached in the BTF while higher
removal efficiencies were obtained at high loads with the CSTB. Both systems presented good stability against overloads.
1 INTRODUCTION
Dichloromethane (DCM) is produced in large amounts by the chemical industry. It is widely used as solvent in paint removers, acetate film production, pharmaceutical processes, metal degreasing and as an aerosol propellant. Due to its low boiling point (40.1 ºC) and high vapour pressure (47kPa at 20 ºC) significant amounts of DCM reach the environment via gaseous emissions. The global consumption of DCM in 2004 was about 600000 tonnes and it is still growing further (Wang and Chen, 2006).
Although some DCM containing wastes are incinerated, it can be assumed that the greater part of the DCM produced is eventually lost into the environment. Besides being present in gaseous emissions, DCM is also detected in many aqueous industrial effluents (Hartmans and Tramper, 1991).
As most halogenated compounds, DCM is considered a health hazard. It is an irritating compound with fragrant odour, which is harmful to the respiratory system and central nervous system. Besides, it is a potential human carcinogen. Exposure to high concentrations may cause unconsciousness and death. Its MAK-value (maximal concentration at work) is 360 mg.m-3. The emission control of DCM and other VOCs has been the subject of recent environmental regulations in several countries. Therefore, a considerable interest exists in the development of techniques for the elimination of DCM and other chemicals from waste gases. The conventional control technologies for VOCs treatment, such as thermal incineration and wet scrubbing are usually costly, mainly when the pollutant concentration is low and the air flow rate is large.
Biological techniques, using biofilters, bioscrubbers, biotrickling filters, suspended-growth bioreactors, or membrane bioreactors among others, have been studied and applied successfully over the past decades to solve problems of polluted air emissions containing VOCs and odours (Kennes and Veiga, 2001). These biotechnological methods often exhibit similar or even higher efficiencies than the traditional physical-chemical processes. They avoid the need of expensive catalysts, do generally not generate secondary streams that have to be treated again, and present lower operating costs (Gadre, 1989; Groenestijn van and Kraakman, 2005; Kennes and Thalasso, 1998).
DCM can be readily degraded under aerobic and anaerobic conditions by several different microbial genera using it as their sole carbon and energy source. The aerobic degradation of DCM yields 1 mole of carbon dioxide and 2 moles of hydrogen chloride, with medium acidification, according to the following reaction (Herbst and Wiesmann, 1996; Kennes et al., 2006):
(1)
DCM degrading bacteria are isolated quite readily from activated sludge and many water and soil samples. Strains belonging, among others, to the genera
Hyphomicrobium, Pseudomonas and Methylobacterium have been described (Brunner
et al., 1980; Stucki et al., 1981; Gälli and Leisinger, 1985).
with the BTF and CSTB of this work to those that would be reached with the same kind of reactors and conditions but working with a two-phase system, above all to check the effect of shock loads. The presence of a free liquid phase in the BTF and CSTB is interesting because of the non-negligible water solubility of DCM (Kennes
et al., 2006). Besides, the addition of an organic phase makes sense when dealing with fluctuating pollutant concentrations and shock load-conditions in order to buffer load variations.
2 MATERIALS AND METHODS
2.1 BACTERIAANDMEDIUM
The BTF and the CSTB were inoculated with a biomass suspension of
Hyphomicrobium KDM2 and KDM4 cultivated in shake-flasks. These dichloro-methane-degrading strains have been described previously (Nikolausz et al., 2006) and belong to the Department of Bioremediation of the UFZ-Centre for Environmental Research Leipzig-Halle GmbH in Germany.
The mineral medium used in this studuy contained per litre of distilled water: 1.5 g KH2PO4, 4.69 g Na2HPO4.12H2O, 0.5 g (NH4)2SO4, 0.2 g MgSO4.7H2O, 1 ml of a trace mineral solution and 1 ml of a vitamins solution. The trace mineral solution contained per litre of distilled water: 5.3 mg CaCl2, 2 mg FeSO4.7H2O, 0.2 mg MnSO4.5H2O, 0.2 mg CuSO4.5H2O, 0.2 mg ZnSO4.7H2O, 0.03 mg H3BO3, 0.4 mg CoCl2 and 4 mg Na2MoO4.2H2O. The vitamins solution contained per litre of distilled water: 0.2 mg biotin, 0.2 mg folic acid, 0.5 mg riboflavin, 0.5 mg thiamine, 0.5 mg nicotinic acid, 0.001 mg vitamin B12, 0.5 mg p-aminobenzoic acid, 1 mg pyridoxamine and 0.5 mg lipoic acid. The pH of the medium was adjusted at 7.
2.2 FIXEDBEDBIOTRICKLINGFILTER
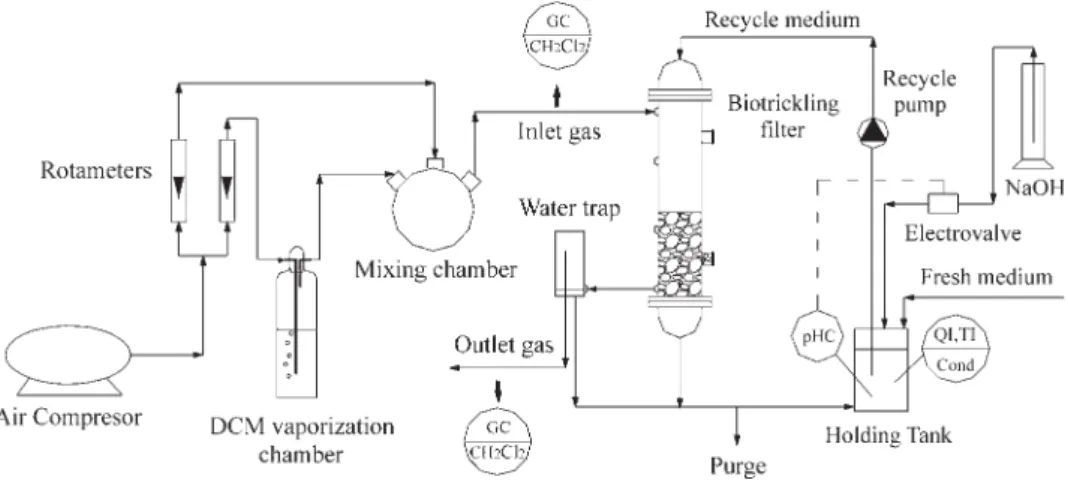
A scheme of the biotrickling filter is shown in Figure 1. The reactor consisted of a glass column of 0.09 m internal diameter, with a cone at the bottom and at the top. A total working volume of 2.1 litre was filled with lava rock and the liquid medium was distributed or collected by means of perforated plates at the top and bottom of the column.
Figure 1. Scheme of the laboratory biotrickling filter system.
The gas flow rates for air and DCM were adjusted utilizing two rotameters with valve (Brook Sho-Räte and Aalborg) and the liquid velocity was kept at 6.9 m.h-1 through a Watson Marlow peristaltic pump. The reactor was maintained at room temperature (21 ± 2 ºC). The liquid in the holding tank was gently mixed with a magnetic stirrer. The pH of the culture was kept between 6.9 and 7.05, with the aid of a pH controller (D09765T, Labprocess) coupled to an electrovalve, by dosing a 2 N NaOH alkaline solution to neutralize the HCl formed during the biological DCM degradation. This resulted in NaCl accumulation. High concentrations of this compound are expected to inhibit the biological activity (Gälli and Leisinger, 1985; Ottengraf et al., 1986; Hartmans and Tramper, 1991; Okkerse et al., 1999a, Diks et al., 1994). Thus, the conductivity was continuously measured in the holding tank (D09765T, Labprocess) and was kept below 28 mS.cm-2 by intermittent draining of liquid from the reactor. To maintain the required level of inorganic nutrients and compensate for drain and evaporation, fresh medium was added when needed. The limit of 28 mS.cm-2 was obtained from a salt tolerance test described in the Results.
Air samples were taken with a Hamilton gas tight syringe at the inlet and outlet ports of the bioreactors. The DCM concentration of the samples was determined using a gas chromatograph, Hewlett Packard HP 6890 GC, equipped with a flame ionisation detector.
2.3 CONTINUOUS STIRRED TANK BIOREACTOR (CSTB)
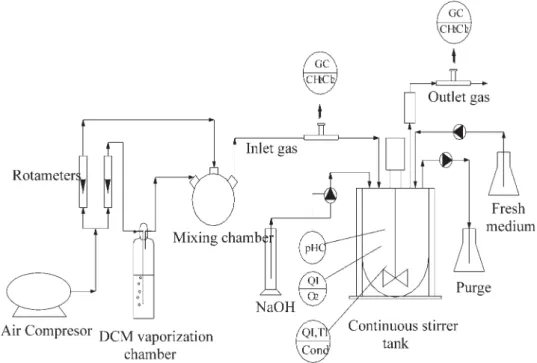
module, a dO2/pH control module, a power controller (with rotameter), a 4 peristaltic pumps unit and an injection and extraction ports for culture medium. The temperature was controlled by a water jacket with thermostated water. Mixing was achieved by a turbine stirrer.
Figure 2. Scheme of the continuous stirred tank bioreactor.
The vessel was filled with 1.5 litre of biomass suspension. The temperature was kept at 30 ºC and the stirrer at 400 rpm. As in the BTF, the pH of the culture was kept at 7 utilizing 2 N NaOH as a neutralizing agent, added automatically by means of a peristaltic pump. The conductivity was here also kept below 28 mS.cm-2. Fresh medium and biomass culture were added and removed continuously in order to maintain a constant salt concentration. The inlet and outlet liquid flow rates were controlled to keep an equilibrium between conductivity and biomass concentration; being the total reactor volume constant. The removed biomass solution was decanted and the supernatant or the settled biomass were recycled to the reactor when needed. The waste gas stream was created in the same way as for the BTF. The flow rate was also 0.084 m3.h-1 while the gas empty bed retention time was 64 s.
2.4 SALTTOLERANCETEST
In this test the degradation of DCM was evaluated in batch cultures at NaCl concentrations ranging from 0 to 500 mM. The experiment was carried out in 250 ml Erlenmeyer flasks containing 30 ml mineral medium inoculatedwith 10 ml of microbial suspension from the CSTB, previously centrifuged and diluted with fresh medium to minimize the amount NaCl that it could contain. After the addition of 10 ml pure DCM, the flasks were sealed with a screw cap containing two septa. The one in contact with the content of the flask was made of Viton, an inert material towards DCM, while the second septum, of ordinary rubber, was put on top of it in order to guarantee sealing. Subsequently, the flasks were vigorously shaken by hand until the compound had dissolved. To keep the liquid and gas phases in equilibrium during the rest of the experiment the Erlenmeyers were shaken horizontally at 120 rpm and 30ºC. Under these equilibrium conditions the degradation of DCM was followed by determining the gas phase concentration by gas chromatography as a function of time.
3 RESULTS AND DISCUSSION
3.1 BIOREACTORSPERFORMANCE
The performance curves for both bioreactors are plotted in Figure 3.
Figure 3. Elimination capacity of both bioreactors versus the DCM inlet load.
from 85 to 50%; and then more smoothly down to 45% at 350 g.m-3.h-1, which is the pseudo-critical load of the performance curve, where the maximal elimination capacity was reached. At higher loads of 600 g.m-3.h-1 the RE was only 28%. These results of RE and EC are in the same range as those obtained by other authors (Table 1) (Kennes
et al., 2006).
The continuous stirrer tank bioreactor shows a maximal elimination capacity of around 100 g.m-3.h-1 (Figure 3). High removal efficiencies between 90-100% are found for inlet loads up to 120 g.m-3.h-1. At this point the maximal elimination capacity was reached and the RE quickly decreased at higher loads. At 350 g.m-3.h-1 the RE was about 25%.
Comparing the two different bioreactor configurations studied here, it can be concluded that for low inlet DCM loads the CSTB exhibits a better performance, while that for higher loads the BTF works better. The changing point happens at the cross point of the performance curves of both reactors, once the maximum removal efficiency of the CSTB is reached (Figure 3). To the best of our knowledge, no previous study has been published on the removal of DCM in a CSTB and on its comparison with its removal in a DCM-treating BTF.
Table 1.
Air biotrickling filters for the removal of DCM working at neutral pH and T ~20-30ºC.
Bacteria Packing Inlet Gas / liquid EBRT RE EC References
material range velocity (s) (%) (g.m-3 h-1)
(g.m-3) (m.h-1)
Hypomi- Keramic Diks and
crobium Novalox 0.5-10 160 / 36 29 32 150 (max) Ottengraf,
Sp. GJ21 Saddles 1991a, b
Hypomi- Polypro- 0.066- 233 / 15.15 16 87.2 12.68 Hartmans and
crobium pylene 0.727 59.3 103.51 Tramper,
crobium Lava rock 0.1-15.7 13.2 / 6.9 90 90 13 This study
KDM2 & 45 170 (max)
After somewhat more than one year operation samples were taken from both bioreactors for identification of the dominant microorganisms by molecular techniques. It was observed that the originally inoculated Hyphomicrobium strains remained dominant in both bioreactors together with some other new species, despite working under completely non-sterile conditions as requested for practical environmental applications. The identification process was carried out at the UFZ-Centre for Environmental Research in Leipzig (non published data).
To check the stability of the bioreactors both systems were subjected to 6 hours overloads. In a first experiment, the load was increased from approximately 70 g.m-3.h-1 to 250 and, later, 460 g.m-3.h-1 and, in a second experiment, it was increased from 15 g.m-3.h-1 to about the same maximum values. In all cases the recovery of both systems was almost immediate. Total recovery when the original inlet load was 70 g.m-3.h-1 took less than 1 hour; and less than 3 hours were required when the original load was 15 g.m-3.h-1.
3.2 SALTTOLERANCETEST
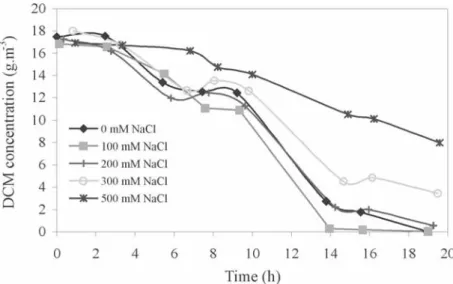
As DCM degradation is accompanied by HCl formation, which results in NaCl accumulation when neutralized with NaOH, the salt tolerance of our culture was tested. In Figure 4 it can be observed that at a concentration of 300 mM NaCl some limited inhibition of the bacterial activity is noticeable. At a concentration of 500 mM NaCl the inhibition becomes much more significant. Therefore, to avoid biological inhibition, the concentration of NaCl in the liquid medium of the bioreactors must be kept below 300 mM, which corresponds to a conductivity of 28 mS.cm-2 or less.
Ottengraf et al. (1986) found complete inhibition at concentration levels exceeding 250-300 mM NaCl, while Hartmans and Tramper (1991) reported high inhibitory effects with 200 mM NaCl. In other bioreactor studies, the NaCl concentration was kept below 100-150 mM (Diks and Ottengraf, 1991a; Okkerse et al., 1999a). In a study of Diks et al. (1994), microbial growth of Hyphomicrobium GJ21 was shown to be strongly inhibited at NaCl concentrations exceeding 350 mM. Nevertheless, for a «TF-enrichment culture» from a laboratory trickling filter degrading DCM, initially inoculated with Hyphomicrobium GJ21, inhibition was less severe as good growth was observed up to 600 mM NaCl. So, it seems that some adaptation towards increased salt concentrations could take place in continuously operating trickling biofilters.
4 ACKNOWLEDGEMENTS
The present research was partly financed by the Spanish Ministry of Science and Education (project CTM2007-62700/TECNO) and European FEDER funds, as well as the Xunta de Galicia (project PGIDIT05PCIC10304PN). We acknowledge the collaboration of Hana Simova during part of the experimental study.
REFERENCES
Brunner, W.B., Staub, D. and Leisinger, T. (1980) Bacterial degradation of dichloromethane. Appl.
Environ. Microbiol. 40: 950-958.
Diks, R.M.M. and Ottengraf, S.P.P. (1991a) Verification studies of a simplified model for the removal of dichloromethane from waste gases using a biological trickling filter (Part I). Bioproc. Eng. 6: 93-99.
Diks, R.M.M. and Ottengraf, S.P.P. (1991b) Verification studies of a simplified model for the removal of dichloromethane from waste gases using a biological trickling filter (Part II). Bioproc. Eng. 6: 131-140.
Diks, R.M.M., Ottengraf, S.P.P. and Van den Oever, A.H.C. (1994) The influence of NaCl on the degradation rate of dichloromethane by Hyphomicrobium sp. Biodegradation 5: 129-141. Gadre, R.V. (1989) Removal of hydrogen sulfide from biogas by chemoautotrophic fixed-film
bioreactor. Biotechnol. Bioeng. 34: 410-414.
Gälli, R. and Leisinger, T. (1985) Specialized strains for the removal of dichloromethane from industrial waste. Cons. Recycling 8: 91-100.
Hartmans S. and Tramper J. (1991) Dichloromethane removal from waste gases with a trickle-bed bioreactor. Bioproc. Eng. 6: 83-92.
Herbst, B. and Wiesmann, U. (1996) Kinetics and reaction engineering aspects of the biodegradation of dichloromethane and dichloroethane. Water Res. 30: 1069-1076.
Kennes, C. and Thalasso, F. (1998) Waste gas biotreatment technology. J. Chem. Technol. Biotechnol
72: 303-319.
Kennes, C. and Veiga, M.C. (2001) Bioreactors for Waste Gas Treatment, Kluwer Academic Publishers, Dordrecht, The Netherlands. 312 pp.
Kennes, C., Jin, Y. and Veiga, M.C. (2006) Fungal and dechlorinating biocatalysts in waste gas treatment. In: (Lens, P., Kennes, C., LeCloirec, P. and Deshusses, M.A., Eds), Waste Gas Treatment for Resource Recovery, IWA Publishing Co., London, UK, p. 277-301. Nikolausz, M., Nijenhuis, I., Ziller, K., Richnow, H. and Kästner, M. (2006) Stable carbon isotope
fractionation during degradation of dichloromethane by methylotrophic bacteria. Environ.
Microbiol. 8: 156-164.
Okkerse, W.J., Ottengraf, S.P.P., Osinga-Kuipers, B. and Okkerse, M. (1999) Biomass accumulation and clogging in biotrickling filters for waste gas treatment. Evaluation of a dynamic model using dichloromethane as a model pollutant. Biotechnol. Bioeng. 63: 418-30.
Ottengraf, S.P.P., Meesters, J.J.P., Van den Oever, A.H.C. and Rozema, H.R. (1986) Biological elimination of volatile xenobiotic compounds in biofilters. Bioproc. Biosys. Eng. 1: 61-69. Stucki, G., Gaelli, R., Ebershold, H.R. and Leisinger, T. (1981) Dehalogenation of dichloromethane
by cell extracts of Hyphomicrobium DM». Arch. Microbiol. 130: 366-371.