Assessment of the genetic and clinical determinants of fracture
risk: genome wide association and mendelian randomisation
study
Katerina Trajanoska,
1,2John A Morris,
3,4Ling Oei,
1,2Hou-Feng Zheng,
5,6David M Evans,
7,8Douglas P Kiel,
9,10Claes Ohlsson,
11J Brent Richards,
3,4Fernando Rivadeneira,
1,2on behalf of
the GEFOS/GENOMOS consortium and the 23andMe research team
ABSTRACT
Objective
To identify the genetic determinants of fracture risk
and assess the role of 15 clinical risk factors on
osteoporotic fracture risk.
DeSiGN
Meta-analysis of genome wide association studies
(GWAS) and a two-sample mendelian randomisation
approach.
SettiNG
25 cohorts from Europe, United States, east Asia, and
Australia with genome wide genotyping and fracture
data.
ParticiPaNtS
A discovery set of 37 857 fracture cases and 227 116
controls; with replication in up to 147 200 fracture
cases and 150 085 controls. Fracture cases were
defined as individuals (>18 years old) who had
fractures at any skeletal site confirmed by medical,
radiological, or questionnaire reports. Instrumental
variable analyses were performed to estimate effects
of 15 selected clinical risk factors for fracture in a
two-sample mendelian randomisation framework, using
the largest previously published GWAS meta-analysis
of each risk factor.
reSultS
Of 15 fracture associated loci identified, all were also
associated with bone mineral density and mapped to
genes clustering in pathways known to be critical to
bone biology (eg, SOST, WNT16, and ESR1) or novel
pathways (FAM210A, GRB10, and ETS2). Mendelian
randomisation analyses showed a clear effect of
bone mineral density on fracture risk. One standard
deviation decrease in genetically determined bone
mineral density of the femoral neck was associated
with a 55% increase in fracture risk (odds ratio 1.55
(95% confidence interval 1.48 to 1.63; P=1.5×10
−68).
Hand grip strength was inversely associated with
fracture risk, but this result was not significant after
multiple testing correction. The remaining clinical
risk factors (including vitamin D levels) showed no
evidence for an effect on fracture.
cONcluSiONS
This large scale GWAS meta-analysis for fracture
identified 15 genetic determinants of fracture, all of
which also influenced bone mineral density. Among
the clinical risk factors for fracture assessed, only
bone mineral density showed a major causal effect
on fracture. Genetic predisposition to lower levels of
vitamin D and estimated calcium intake from dairy
sources were not associated with fracture risk.
Introduction
The United Nations recently predicted that the ratio
of people aged 65 years and older to those aged
15-64 years will triple globally by 2100.
1Musculoskeletal
conditions are the most common causes of severe
pain and physical disability, and their prevalence
will increase with the ageing of society.
2One of the
largest musculoskeletal burdens is attributable to
osteoporotic fractures, the incidence of which increases
exponentially with age.
3Therefore, the prevention of
fractures is an important public health goal.
The causes of multifactorial common diseases,
such as osteoporotic fractures, include genetic and
environmental influences, as well as their interactions
(gene by environment, or G×E). Clinically useful risk
factors for the prediction of osteoporotic fracture
risk need not be necessarily causal and have been
implemented by well validated risk score algorithms
such as FRAX
4and the Garvan
5 6fracture risk
calculator. Yet, the extent to which modification of
predictive clinical risk factors reduces fracture risk
is not generally known. A better understanding of
causal mechanisms will enable prevention strategies,
direct the launch of proper clinical trials, and provide
targets for effective lifestyle and pharmacological
interventions. Acquiring this knowledge is particularly
timely and relevant considering the increasing
recognition that many individuals at high fracture risk
often do not receive fracture prevention interventions.
7For numbered affiliations see end of article.
Correspondence to: F Rivadeneira f.rivadeneira@ erasmusmc.nl, and J B Richards brent.richards@mcgill.ca Additional material is published online only. To view please visit the journal online.
cite this as: BMJ 2018;362:k3225 http://dx.doi.org/10.1136/bmj.k3225 Accepted: 2 July 2018
WhAT IS AlReAdy knoWn on ThIS TopIC
The genetic determinants of fracture risk are not well described, and whether
commonly used clinical risk factors for fracture are causal is not known
For example, the effect of vitamin D supplementation in the general population
on fracture risk is under debate; although such supplementation is part of
clinical guidelines, recent randomised controlled trials have failed to consistently
show a beneficial effect
WhAT ThIS STudy AddS
This mendelian randomisation study provides evidence against a causal effect
of several proposed clinical risk factors for fractures (eg, diabetes, glucose,
rheumatoid arthritis, and vitamin D)
Genetic predisposition to lower vitamin D levels and estimated calcium intake
from dairy sources were not associated with fracture risk
However, these results highlight the central causal role of low bone mineral
density in the pathophysiology of fracture risk
on 31 January 2019 by guest. Protected by copyright.
http://www.bmj.com/
Fracture risk is a moderately heritable trait (whereby
h
2is roughly 30%),
8 9for which no large scale, genome
wide association studies (GWAS) have been undertaken
so far. Large GWAS meta-analyses can also be used to
perform mendelian randomisation analyses to explore
the causal effects of heritable risk factors on disease
in people, while reducing bias due to confounding
(because genetic variation is essentially randomly
assigned at conception) or reverse causation (because
allele assignment always precedes disease onset).
10Conceptually similar to a randomised controlled trial,
the mendelian randomisation approach enables an
assessment of the cumulative effect of a genetically
determined exposure on fracture risk, minimising the
biases that frequently weaken observational studies.
Understanding whether interventions aimed at
clinical risk factors would reduce fracture risk is
important, because clinicians often ensure that such
risk factors are optimised in individuals at high risk
of fracture. If the risk factors are not causal, then
such optimisation would not decrease fracture risk.
Therefore, to better understand genetic and clinical
risk factors for fracture, we undertook a large scale
GWAS for fracture risk in up to 264 973 participants
(37 857 fracture cases) in the discovery stage and
in conjunction with the largest available GWAS for
clinical risk factors, determined the genetic correlation
(shared heritability) of key clinical risk factors and
fracture. We then performed mendelian randomisation
studies to explore the causal effect of these risk factors
on fracture.
Methods
Study populations
A total of 23 cohorts with genome wide genotyping
and fracture data were recruited globally through
the GEnetic Factors for OSteoporosis consortium
(GEFOS; http://www.gefos.org/). These cohorts were
predominantly of European descent and from Europe
(n=13), North America (n=8), Australia (n=1), and east
Asia (n=1; tables S1A and S2A), and included 20 439
fracture cases and 78 843 controls. After meta-analysis,
replication of promising findings was performed
initially in the GENOMOS consortium (18 779 cases
and 32 078 controls from 29 additional studies,
tables S1B and S2B). Two additional large GWAS (UK
Biobank, 14 492 cases and 130 563 controls;
EPIC-Norfolk study, 2926 cases and 17 710 controls) were
then included in the discovery set, comprising in total
37 857 cases and 227 116 controls (aged 18-106 years,
including 69% women). Genetic markers reaching
genome wide significance in this expanded
meta-analysis and previously reported bone mineral density
markers associated with fracture
11were additionally
replicated in 147 200 cases and 150 085 controls from
23andMe, a personal genetic company (23andMe
GWAS participants were customers who consented
to participate in research with self reported fracture
data). Figure S1 shows the overall study design. To
enable two-sample mendelian randomisation studies,
we compiled summary level results from the largest
available GWAS meta-analyses performed so far on a
large set of clinical risk factors for fracture (table 1). All
studies were approved by their respective institutional
ethics review committees and all participants provided
written informed consent.
Study endpoint (fracture definition)
To maximise the statistical power to detect genetic
loci, we used an inclusive definition of fracture, which
was successfully used in previous efforts to test bone
mineral density associated variants for association
with fracture
11 27and allowed us to undertake the
largest GWAS on fracture risk so far. Fracture cases
were defined as those individuals (>18 years old) who
had fractures at any skeletal site confirmed by medical,
radiological, or questionnaire reports (table S3).
Fractures of the fingers, toes, and skull as well as high
trauma fractures were excluded whenever possible,
although there have been some reports that even
high trauma fractures are also predicted by low bone
mineral density and are predictive of future low trauma
fracture.
28 29Controls were defined as individuals (>18
years old) from the same cohorts, without a history of
fracture.
Fracture GWaS meta-analysis and replication
Genome wide genotyping was performed in each
cohort by use of Illumina or Affymetrix genome wide
genotyping chips (table S4A) and was imputed to ensure
accurate ascertainment of nearly all common genetic
variation above a minor allele frequency threshold of
1%. After strict quality control criteria were applied
to samples and single nucleotide polymorphisms
(SNPs), we followed a consortium wide standardised
analytical plan to assess the association of SNPs with
risk of fracture. We used logistic regression adjusted
for sex, age (simple and quadratic terms), height, and
weight, testing additive (per allele) genetic effects.
Before performing analysis, three separate
meta-analytical centres checked the data independently. All
individual GWAS were corrected by genomic control
table 1 | Fracture risk factors assessed and number of
samples in each genome wide association study
Disease or trait total sample size
Femoral neck bone mineral density11 32 961 Lumbar spine bone mineral density11 31 800
Age at menopause12 69 360
Rheumatoid arthritis13 58 284 (14 361 cases) Inflammatory bowel disease14 34 652 (12 882 cases) Type 1 diabetes15 26 890 (9934 cases) Thyroid stimulating hormone16 26 523
Homocysteine17 44 147
Grip strength18 142 035
Age of puberty19 182 416
Fasting glucose20 21 58 074
Coronary heart disease22 107 432 (41 513 cases) Type 2 diabetes23 56 862 (12 171 cases) Vitamin D levels24 25 33 996
Dairy calcium intake26* 171 213†
*Lactase intolerance (MCM6-rs4988235) was used as a proxy for dairy consumption.
†Effect estimates were derived from reference 26.
on 31 January 2019 by guest. Protected by copyright.
http://www.bmj.com/
before we performed a fixed effects meta-analysis using
METAL software. A total of 2 539 801 autosomal SNPs
present in more than two studies were meta-analysed.
We took forward for replication a set of promising SNPs
for de novo genotyping in 26 studies at LGC Genomics
(UK), using KASP genotyping as described previously
27(table S4B) and tested them in three more studies (table
S4C), for a total of 29 studies. Allele and genotype
frequencies of all genotyped variants followed
Hardy-Weinberg equilibrium proportions. To obtain unbiased
estimates of effect size, all SNPs associated at a genome
wide significant level (that is, P<5×10
−8) and previously
known bone mineral density fracture loci
11were tested
for replication in the 23andMe cohort (table S4C).
Genetic determinants of risk factors for fracture
We used the genetic determinants of 15 available
clinical risk factors from the largest GWAS datasets
available. Genome wide association analyses have been
published for bone mineral density (femoral neck and
lumbar spine),
11age of puberty,
19age at menopause,
12grip strength,
18vitamin D,
24 25homocysteine,
17thyroid
stimulating hormone level,
16fasting glucose,
20 21type
1 diabetes,
15type 2 diabetes,
23rheumatoid arthritis,
13inflammatory bowel disease,
14and coronary artery
disease.
22The well established lactose intolerance
marker (LCT
(C/T- 13910)polymorphism; rs4988235)
30was
used as a surrogate to assess long term differences in
dairy derived calcium intake.
31Additional risk factors
were considered for inclusion; however, at the time of
analyses, well powered GWAS were not available for
some risk factors of interest including alcohol intake,
32 33smoking
34and plasma calcium levels.
35Body mass
index
36was not evaluated given that the fracture
discovery analysis was adjusted for body weight and
height.
Genetic correlation
We used LD score regression to estimate the genetic
correlation of the selected clinical risk factors and
fracture (table 1).
37This method estimates the degree
of shared genetic risk factors between two diseases or
traits, and was applied to 11 of the 15 selected risk
factors for fracture (since genome wide association
results were not publicly available for type 1 diabetes
and thyroid stimulating hormone and dairy calcium
intake). We accounted for multiple testing by using a
conservative Bonferroni correction for 12 tests (that
is, α=4.2×10
−3). We also tested whether the above
mentioned risk factors were genetically correlated with
bone mineral density.
Mendelian randomisation
Next, we undertook mendelian randomisation analyses
to estimate effects of 15 selected clinical risk factors in
a two-sample mendelian randomisation framework.
The mendelian randomisation approach was based on
the following assumptions:
• The genetic variants used as instrumental variables are associated with the clinical risk factors.
• The genetic variants are not associated with any
confounders of the exposure-outcome relation.
• The genetic variants are associated with fracture only through the clinical risk factors—that is, a lack of pleiotropy (fig 1).
We used the largest previously published GWAS
meta-analyses of the risk factors, at the time of meta-analyses, to
maximise statistical power (table S5A).
38-41To reduce
potential bias due to population stratification, we
restricted the analyses to studies with participants of
European descent. To ensure independence between
the SNPs used to evaluate the association of the risk
factor and fracture risk, we grouped by LD (r
2>0.05)
those SNPs achieving genome wide significance,
keeping only the SNP with the lowest P value per group.
Next, we recorded the effect size and standard error
attributed to each allele’s effect on the risk factor (table
S5B). Finally, for age of menopause, we performed sex
specific mendelian randomisation analysis in women
only.
The resulting individual SNP effect estimates were
pooled by use of the Wald type ratio estimator, which
is formally analogous to an inverse weighted
meta-analysis.
42Again, we applied a conservative Bonferroni
corrected threshold (that is, α=3.3×10
−3, because 15
risk factors were assessed) to account for the multiple
risk factors tested. We also tested the assumptions
underlying the mendelian randomisation approach (fig
1). To test the third assumption (a lack of pleiotropic
effects of the SNPs on the outcome, independent of
the exposure), we used mendelian
randomisation-Egger regression.
43Moreover, as sensitivity analyses
for robust causal inference, we additionally performed
mendelian randomisation analyses using a weighted
median estimator and penalised weighted median
estimator. We also tested the effect of the same
clinical risk factors on bone mineral density
27using
the same methods. For the binary exposures, the
odds ratios were converted (by multiplying log-odds
ratios by 0.693 and then exponentiating) in order
to represent the odds ratio per doubling of the odds
Genetic variant
Fracture
Confounders Clinical risk factors
Clinical risk factors assessed:
1. Bone mineral density 2. Age at menopause 3. Rheumatoid arthritis 4. Inflammatory bowel disease 5. Type 1 diabetes
6. Thyroid stimulating hormone 7. Homocysteine levels 8. Grip strength 9. Age at puberty 10. Fasting glucose levels 11. Coronary heart disease 12. Type 2 diabetes 13. Vitamin D levels 14. Milk calcium intake
Assumptions of mendelian randomisation study:
1. Genetic variants are associated with clinical risk factors
2. Genetic variants are not associated with confounders 3. Genetic variants influence fracture risk only through clinical risk factors
X
Fig 1 | Mendelian randomisation study design
on 31 January 2019 by guest. Protected by copyright.
http://www.bmj.com/
of susceptibility to disease.
44Finally, we undertook
mendelian randomisation power calculations
45for all
such analyses.
Patient involvement
No patients were directly involved in the design,
recruitment, or conduct of the study. Nevertheless,
several of the participating studies comprised
collections of patients who were made aware of their
contribution of medical data to research through their
informed consents signed by all study participants.
After publication, dissemination of the results will be
sought across different countries involving respective
patient organisations, the general public, and other
stakeholders; typically, across social media, scientific
meetings and media interviews. Finally, some studies
sent newsletters informing their participants about
important findings and their implications.
Results
Genetic loci associated with fracture
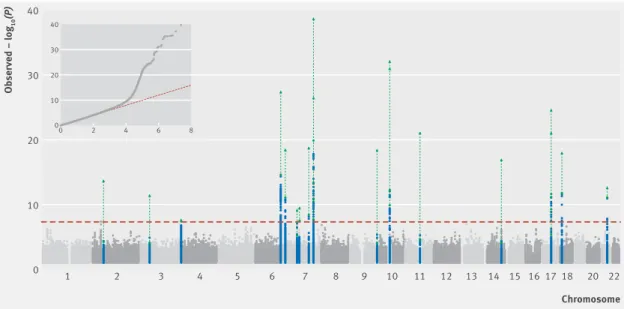
We saw was no evidence of excessive genomic inflation
(λ=1.02, LD score intercept=0.99) in the GWAS
meta-analysis, suggesting that the results were not biased
because of population stratification, genotyping
artefacts, or cryptic family relationships (fig 2). As
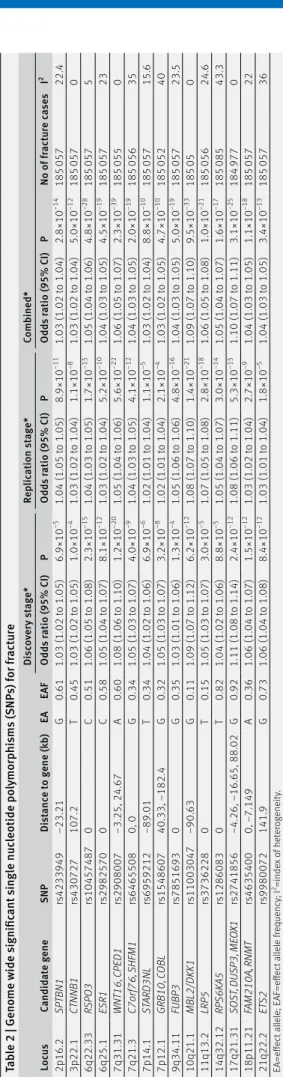
shown in table 2 and figure 2, 15 genomic loci were
associated at a genome wide significant level with
fracture risk after meta-analysis of the discovery
(table S6A) and replication (tables S6B, S6C, and S6D)
stages. All loci were at, or near, loci previously shown
to be associated with bone mineral density,
11 27 46-52a
major determinant of fracture risk (table S6E and figure
S2). The effect sizes of these common SNPs on fracture
risk was modest (odds ratios ranging from 1.03 to
1.10), which is consistent with GWAS findings for other
complex diseases.
53Genetic correlations with clinical risk factors
SNPs influencing bone mineral density were strongly
and inversely correlated with odds of fracture (table 3;
genetic correlation −0.59, P=2×10
−24for femoral neck
bone mineral density, with similar results for lumbar
spine bone mineral density, −0.53, P=1×10
−20). By
contrast, none of the remaining clinical risk factors
evaluated was strongly genetically correlated with risk
of fracture with the exception of homocysteine (table
3). Genetically increased risk of type 2 diabetes was
positively correlated with femoral neck bone mineral
density, while genetically increased grip strength had
positive correlations with bone mineral density of both
the femoral neck and lumbar spine (table S7).
Mendelian randomisation
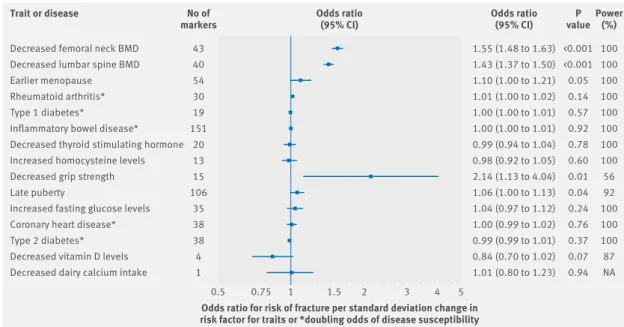
Using mendelian randomisation analyses to assess
the effect of the 15 risk factors on fracture, we saw
evidence for a major effect of genetically decreased
bone mineral density on fracture risk (fig 3 and table 4;
odds ratio per standard deviation decrease in femoral
neck bone mineral density=1.55, 95% confidence
interval 1.48 to 1.63, P=1.5×10
−68). We also observed a
large effect of grip strength on fracture risk (2.14, 1.13
to 4.04, P=0.01), but these results had wide confidence
intervals and were not significant after multiple testing
correction.
Vitamin D levels assessed by use of
25-hydroxy-vitamin D variants were not found to be linearly
associated with increased fracture risk (odds ratio per
standard deviation decrease=0.84, 95% confidence
interval 0.70 to 1.02, P=0.07). Most of these
mendelian randomisation effects did not seem to be
Chromosome Observed – log 10 (P) 1 2 3 4 5 6 7 8 9 10 11 12 13 14 15 16 17 18 20 22 0 20 30 40 10 0 2 4 6 8 0 10 20 30 40
Fig 2 | Manhattan plot of –log
10association P values for discovery meta-analysis, and quantile-quantile plot (QQ plot)
of the distribution of observed −log
10association P values against the expected null distribution for discovery
meta-analysis. Dashed horizontal red line=genome wide significant (GWS) threshold (P<5×10
−8); blue dots=SNPs at GWS
loci that are within 500kb of leading SNPs in previous genome wide association studies with different bone traits.
Green lines and triangles=combined −log
10association P values after replication in the 23andMe cohort
on 31 January 2019 by guest. Protected by copyright.
http://www.bmj.com/
strongly influenced by directional pleiotropy, because
the intercepts of the mendelian randomisation-Egger
test were tightly centred around the null, except for
rheumatoid arthritis, type 2 diabetes, grip strength,
glucose, and homocysteine levels (table 4). The
estimates from the inverse variance weighted fixed
meta-analysis were very similar to the estimates from
the weighted median and penalised weighted median
method (table S8). However, despite some indication
of causality of fasting glucose levels on fracture risk
(table S8) in the median weighted analyses, it did not
surpass the multiple testing threshold.
Consistent with the results of the genetic correlation
analyses, we found that none of the other evaluated
clinical risk factors had evidence of a causal effect
on risk of fracture, despite adequate statistical power
(mean=98% (range 56-100%), table 4).
45When
evaluating the effect of genetically increased risk
factors on bone mineral density (table S9), only age
of puberty had an effect on bone mineral density after
accounting for multiple testing; fasting glucose, type 2
diabetes, and age at menopause had marginal effects,
consistent with a recent mendelian randomisation
study of type 2 diabetes and glycaemic traits on bone
mineral density.
54We next undertook careful evaluation of the three
mendelian randomisation assumptions. The first
assumption was verified by the selection of only
common variants (minor allele frequency >5%)
strongly associated with the clinical risk factor
(P<5×10
−8). After performing a thorough literature
search, we can exclude reported associations between
the genetic variants and potential confounding factors
(second assumption). Finally, by using mendelian
randomisation-Egger regression, we found no evidence
of the presence of pleiotropy between the instruments
and the outcomes (table 4).
discussion
Principal findings and interpretation
In this large GWAS for fracture, we identified genetic
determinants (at 15 loci) of fracture and tested the role
of 15 selected clinical risk factors on fracture risk and
tab
le 2 | Genome w
ide s
ignific
ant
s
ingle nuc
leotide po
ly
morp
hi
sms
(S
NP
s) f
or f
ract
ur
e
lo cus candid at e g ene SN P Di st anc e t o g ene (k b) ea ea F Dis co ve ry s ta ge * rep lic ation s tag e* com bined* Odd s r atio (95% ci ) P Odd s r atio (95% ci ) P Odd s r atio (95% ci ) P No of fr act ur e c ase s i 2 2p16.2 SP TBN1 rs4233949 −23.21 G 0.61 1.03 (1.02 t o 1.05) 6.9×10 −5 1.04 (1.05 t o 1.05) 8.9×10 −11 1.03 (1.02 t o 1.04) 2.8×10 −14 185 057 22.4 3p22.1 CTNNB1 rs430727 107.2 T 0.45 1.03 (1.02 t o 1.05) 1.0×10 −4 1.03 (1.02 t o 1.04) 1.1×10 −8 1.03 (1.02 t o 1.04) 5.0×10 −12 185 057 0 6q22.33 RSPO 3 rs10457487 0 C 0.51 1.06 (1.05 t o 1.08) 2.3×10 −15 1.04 (1.03 t o 1.05) 1.7×10 −15 1.05 (1.04 t o 1.06) 4.8×10 −28 185 057 5 6q25.1 ESR 1 rs2982570 0 C 0.58 1.05 (1.04 t o 1.07) 8.1×10 −12 1.03 (1.02 t o 1.04) 5.2×10 −10 1.04 (1.03 t o 1.05) 4.5×10 −19 185 057 23 7q31.31 WN T16, C PED1 rs2908007 −3.25, 24.67 A 0.60 1.08 (1.06 t o 1.10) 1.2×10 −20 1.05 (1.04 t o 1.06) 5.6×10 −22 1.06 (1.05 t o 1.07) 2.3×10 −39 185 055 0 7q21.3 C7orf76, S HFM1 rs6465508 0, 0 G 0.34 1.05 (1.03 t o 1.07) 4.0×10 −9 1.04 (1.03 t o 1.05) 4.1×10 −12 1.04 (1.03 t o 1.05) 2.0×10 −19 185 056 35 7p14.1 ST ARD3NL rs6959212 −89.01 T 0.34 1.04 (1.02 t o 1.06) 6.9×10 −6 1.02 (1.01 t o 1.04) 1.1×10 −5 1.03 (1.02 t o 1.04) 8.8×10 −10 185 057 15.6 7p12.1 GRB10, C OBL rs1548607 40.33, −182.4 G 0.32 1.05 (1.03 t o 1.07) 3.2×10 −8 1.02 (1.01 t o 1.04) 2.1×10 −4 1.03 (1.02 t o 1.05) 4.7×10 −10 185 052 40 9q34.11 FUBP3 rs7851693 0 G 0.35 1.03 (1.01 t o 1.06) 1.3×10 −4 1.05 (1.06 t o 1.06) 4.8×10 −16 1.04 (1.03 t o 1.05) 5.0×10 −19 185 057 23.5 10q21.1 MBL2/DKK1 rs11003047 −90.63 G 0.11 1.09 (1.07 t o 1.12) 6.2×10 −12 1.08 (1.07 t o 1.10) 1.4×10 −21 1.09 (1.07 t o 1.10) 9.5×10 −33 185 05 0 11q13.2 LRP5 rs3736228 0 T 0.15 1.05 (1.03 t o 1.07) 3.0×10 −5 1.07 (1.05 t o 1.08) 2.8×10 −18 1.06 (1.05 t o 1.08) 1.0×10 −21 185 056 24.6 14q32.12 RP S6K A5 rs1286083 0 T 0.82 1.04 (1.02 t o 1.06) 8.8×10 −5 1.05 (1.04 t o 1.07) 3.0×10 −14 1.05 (1.04 t o 1.07) 1.6×10 −17 185 085 43.3 17q21.31 SO ST , DU SP3, ME OX1 rs2741856 −4.26, −16.65, 88.02 G 0.92 1.11 (1.08 t o 1.14) 2.4×10 −12 1.08 (1.06 t o 1.11) 5.3×10 −15 1.10 (1.07 t o 1.11) 3.1×10 −25 184 977 0 18p11.21 FAM210A, RN M T rs4635400 0, −7.149 A 0.36 1.06 (1.04 t o 1.07) 1.5×10 −12 1.03 (1.02 t o 1.04) 2.7×10 −9 1.04 (1.03 t o 1.05) 1.1×10 −18 185 057 22 21q22.2 ETS2 rs9980072 141.9 G 0.73 1.06 (1.04 t o 1.08) 8.4×10 −12 1.03 (1.01 t o 1.04) 1.8×10 −5 1.04 (1.03 t o 1.05) 3.4×10 −13 185 057 36 EA=effect al lel e; EAF=effect al lel e f requency; I 2=ind ex of heter ogeneit y. *Di sc over y s tage (37 857 c ase s; 227 116 c ont ro ls); rep lic ation s tage (147 200 c ase s; 150 085 c ont ro ls); c om bined (185 057 c ase s; 377 201 c ont ro ls).table 3 | estimated genetic correlation between fracture
and other clinical risk factors
Disease or trait Genetic correlation (95%ci) P
Femoral neck bone
mineral density −0.59 (−0.70 to −0.48) 2×10⁻²⁴ Lumbar spine bone
mineral density −0.53 (−0.64 to −0.42) 1×10⁻²⁰ Age at menopause −0.12 (−0.23 to −0.003) 0.04 Rheumatoid arthritis 0.02 (−0.10 to 0.14) 0.74 Inflammatory bowel disease −0.01 (−0.13 to 0.11) 0.90 Homocysteine levels 0.22 (0.07 to 0.37) 0.004 Grip strength −0.10 (−0.21 to 0.01) 0.07 Age of puberty 0.03 (−0.05 to 0.11) 0.43 Fasting glucose −0.05 (−0.19 to 0.09) 0.46 Coronary heart disease −0.05 (−0.09 to 0.19) 0.48 Type 2 diabetes −0.07 (−0.22 to 0.08) 0.35 Vitamin D levels 0.23 (−0.52 to 0.98) 0.56
on 31 January 2019 by guest. Protected by copyright.
http://www.bmj.com/
bone mineral density. Using mendelian randomisation
analyses, we demonstrated that genetically decreased
bone mineral density (and, to a lesser extent, hand
grip strength) was the only clinical risk factor among
those tested, with evidence for an effect on fracture
risk. By contrast, despite high statistical power, none
of the other tested and well accepted risk factors (eg,
rheumatoid arthritis and other causes of secondary
osteoporosis) or any of the other clinically relevant risk
factors (vitamin D levels, dairy food derived calcium
intake, fasting glucose, type 2 diabetes, and coronary
heart disease) had evidence of a major causal effect
on fracture risk. Furthermore, all identified genetic
determinants of fracture also influenced bone mineral
density.
In our previous work,
11we tested 96 bone mineral
density markers for association with fracture. In the
meta-analysis, 14 bone mineral density loci were
associated with fracture risk (P<5×10
−4), of which
six surpassed genome wide significance (P<5×10
−8).
In our current project, we began with GWAS
meta-analysis for fracture risk. We confirmed the 2p16.2
(SPTBN1), 7q21.3 (SHFM1), 10q21.1 (MBL2/DKK1),
11q13.2 (LRP5), and 18p11.21 (FAM210A) loci, and
observed an increased signal at SOST, CPED1/WNT16,
FUPB3, DCDC5, RPS6KA5, STARD3NL, and CTNNB1.
Lastly, we added the 6q22.33 (RSPO3), 6q25.1 (ESR1),
7p12.1 (GRB10/COBL), and 21q22.2 (ETS2) loci to
the list of novel fracture loci. Among the genome
wide significant loci associated with fracture, several
Decreased femoral neck BMD Decreased lumbar spine BMD Earlier menopause Rheumatoid arthritis* Type 1 diabetes*
Inflammatory bowel disease* Decreased thyroid stimulating hormone Increased homocysteine levels Decreased grip strength Late puberty
Increased fasting glucose levels Coronary heart disease* Type 2 diabetes* Decreased vitamin D levels Decreased dairy calcium intake
<0.001 <0.001 0.05 0.14 0.57 0.92 0.78 0.60 0.01 0.04 0.24 0.76 0.37 0.07 0.94 0.5 0.75 1 1.5 2 3 4 5 Trait or disease
Odds ratio for risk of fracture per standard deviation change in risk factor for traits or *doubling odds of disease susceptibility
1.55 (1.48 to 1.63) 1.43 (1.37 to 1.50) 1.10 (1.00 to 1.21) 1.01 (1.00 to 1.02) 1.00 (1.00 to 1.01) 1.00 (1.00 to 1.01) 0.99 (0.94 to 1.04) 0.98 (0.92 to 1.05) 2.14 (1.13 to 4.04) 1.06 (1.00 to 1.13) 1.04 (0.97 to 1.12) 1.00 (0.99 to 1.02) 0.99 (0.99 to 1.01) 0.84 (0.70 to 1.02) 1.01 (0.80 to 1.23) Odds ratio (95% CI) Odds ratio (95% CI) valueP 100 100 100 100 100 100 100 100 56 92 100 100 100 87 NA Power (%) 43 40 54 30 19 151 20 13 15 106 35 38 38 4 1 No of markers
Fig 3 | Forest plot showing effect of 15 genetically determined risk factors on fracture risk. Power=statistical power to
detect an odds ratio of 1.15 at α≤3.3×10
−3; Na=not applicable; bMD=bone mineral density
table 4 | estimated effects of 15 genetically determined risk factors on fracture risk
trait or disease No of markers
inverse variance weighted meta-analysis
Power (%)‡
Mendelian randomisation-egger regression§ Odds ratio (95% ci)* P intercept (95% ci) P
Decreased femoral neck BMD¶ 43 1.55 (1.48 to 1.63) 1.5×10−68 100 −0.0010 (−0.011 to 0.008) 0.83 Decreased lumbar spine BMD¶ 40 1.43 (1.37 to 1.50) 2.3×10−55 100 0.0050 (−0.006 to 0.014) 0.93
Earlier menopause 54 1.10 (1.00 to 1.21) 0.05 100 0.0007 (−0.006 to 0.007) 0.83
Rheumatoid arthritis† 30 1.01 (1.00 to 1.02) 0.14 100 0.0099 (0.003 to 0.017) 0.005
Type 1 diabetes† 19 1.00 (1.00 to 1.01) 0.57 100 0.0028 (−0.004 to 0.010) 0.39
Inflammatory bowel disease† 151 1.00 (1.00 to 1.01) 0.92 100 0.0003 (−0.003 to 0.004) 0.86 Decreased thyroid stimulating hormone 20 0.99 (0.94 to 1.04) 0.78 100 0.0050 (−0.019 to 0.009) 0.47 Increased homocysteine levels 13 0.98 (0.92 to 1.05) 0.60 100 0.0134 (0.001 to 0.026) 0.03
Decreased grip strength 15 2.14 (1.13 to 4.04) 0.01 56 0.1070 (0.011 to 0.203) 0.03
Late puberty 106 1.06 (1.00 to 1.13) 0.04 92 0.0036 (−0.002 to 0.009) 0.21
Increased fasting glucose levels 35 1.04 (0.97 to 1.12) 0.24 100 −0.0083 (−0.014 to −0.002) 0.01
Coronary heart disease† 38 1.00 (0.99 to 1.02) 0.76 100 0.0028 (−0.007 to 0.013) 0.57
Type 2 diabetes† 38 0.99 (0.99 to 1.01) 0.37 100 −0.0089 (−0.016 to −0.002) 0.02
Decreased vitamin D levels 4 0.84 (0.70 to 1.02) 0.07 87 −0.0143 (−0.103 to 0.074) 0.56
Decreased dairy calcium intake 1 1.01 (0.80 to 1.23) 0.94 NA NA NA
NA=not applicable; BMD=bone mineral density.
*Odds ratio is for the risk of fracture per standard deviation change in the risk factor for traits (1 standard deviation change=0.13 g femoral neck BMD, 0.18 g lumbar spine BMD, 3.9 years earlier menopause, 0.76 mIU/L thyroid stimulating hormone, 11.3 kg grip strength, 1.42 years late puberty, 0.62 mmol/L fasting glucose, 25.2 nmol/L vitamin D), or †risk of fracture per doubling of odds of disease susceptibility; dairy calcium intake units are servings/day. Estimates obtained using a fixed effects model.
‡Statistical power to detect an odds ratio of 1.15 at α≤3.3×10⁻³.
§Egger regression analyses can be performed if the number of genetic variants is more than two; Egger effect estimates are presented in table S7.
¶Findings that remain associated (that is, α<3.3×10⁻³) after correction for multiple testing.
on 31 January 2019 by guest. Protected by copyright.
http://www.bmj.com/
contain well established causal proteins for fracture
risk that are targets for clinically useful osteoporotic
fracture treatments, such as ESR1, which encodes
the oestrogen receptor, and SOST, which encodes
sclerostin.
55These discoveries highlight known and
novel factors in pathways critical to bone biology (that
is, Wnt, for mesenchymal stem cell differentiation) as
well as potential new factors and biological pathways
that might constitute future drug targets.
56All the discovered fracture loci are also associated
with bone mineral density, implying that skeletal
fragility characterised by reduced bone mineral density
is central to the pathophysiology of osteoporotic
fracture. This contention is in line with the significant
genetic correlation we identified between bone mineral
density and fracture. Our mendelian randomisation
analyses also indicate that the suggestive effect of
late puberty and earlier age at menopause on fracture
risk is, at least partly, mediated through reduced bone
mineral density. By contrast, hand grip strength was
not found to be a determinant of bone mineral density,
and vice versa. Still, grip strength could be a proxy
for overall muscle strength and risk of falling, and
could be involved in a pathway leading to fracture
independently of bone mineral density.
56However, the
hand grip estimates holds wide confidence intervals
in our analyses expressed in standard deviations to
allow comparison to other risk factors. We believe that
these large standard deviations can be attributed to
multiple factors, including effort and encouragement
of the participants, posture, position, and intrinsic
measurement variability between individuals. A recent
effort using UK Biobank data also showed through
mendelian randomisation that higher grip strength
is associated with decreased fracture risk.
18As such,
inclusion of grip strength (or a different assessment
of muscle function such as leg strength) could
improve the predictive performance of risk prediction
calculators that already contain bone mineral density,
just as has been reported for a history of falls.
56Older individuals at high risk of fractures often have
low levels of vitamin D (owing to low dietary intake
and sun exposure). Therefore, fracture prevention
guidelines have suggested the use of vitamin D
supplementation in the general population.
57 58These recommendations have contributed to the
marked increase in vitamin D use in older populations
worldwide, where in the United States alone the
proportion of individuals aged 70 years and older who
use at least 1000 IU of vitamin D daily increased about
100-fold from 2000 to 2014.
59Despite these guideline
recommendations, it is unclear whether modestly low
levels of vitamin D, rather than profoundly low values,
are causally associated with a higher risk of fracture.
Our mendelian randomisation work examined a linear
relation between vitamin D levels and fracture risk. We
did not test for the possibility of a threshold dependent
relation—that is, effects that could be present only at
very low levels of vitamin D. Nevertheless, our analyses
showed that vitamin D levels had no protective linear
effect on fracture in community dwelling individuals,
despite adequate statistical power. We also show, in
line with other previous reports,
60-62no evidence for
a causal effect of vitamin D levels on bone mineral
density. Although a threshold effect is likely to be
present, where profoundly lowered vitamin D levels do
increase risk of fracture, our mendelian randomisation
results strongly suggest that increasing levels of
vitamin D in the (non-deficient) general population is
unlikely to decrease risk of fracture.
Likewise, calcium supplementation has been called
into question recently. A mendelian randomisation
study found that higher levels of serum calcium are
a risk factor for coronary heart disease,
63supporting
the current recommendation of not exceeding total
calcium intake of 1200 mg/day in older individuals.
64Further, our study assessed the lactose persistence
variant as a surrogate of long term intake of dairy
calcium (used previously as an instrument for dairy
consumption in association with blood pressure
26and
other traits), and found no evidence for a protective
effect of sustained intake of dairy derived calcium on
fracture risk.
comparison with other studies
Previous observational studies and clinical trials
have reported the beneficial effect of vitamin D
65 66or
calcium
67supplementation on fracture risk reduction,
findings which are not supported by our results.
These discrepant findings can be due to inadequate
methods or high heterogeneity induced, for example,
by combining community dwelling participants and
inpatients in the same analysis. Consistent with our
findings, a recent meta-analysis of 33 randomised
trials
68(n=51 145) found that supplementation with
calcium, vitamin D, or both did not decrease the
incidence of fractures in community dwelling older
adults. Findings such as these should be interpreted
with caution, because they do not necessarily apply
to patients undergoing osteoporosis treatment,
considering that trials evaluating osteoporosis
treatment are carried out concomitant with vitamin D
and calcium supplementation.
Studies seeking to show whether these supplements
do increase the efficacy of osteoporotic treatment
or decrease adverse events (that is, hypocalcaemia)
are lacking. In either case, screening for vitamin
D deficiency and seeking its correction should be
warranted before the initiation of anti-resorptive
treatment. Moreover, in a recent mendelian
randomisation study investigating the role of
25-hydroxy-vitamin D in maintaining bone mineral
density,
62increased levels of 25-hydroxy-vitamin D
had no effect on bone mineral density measured by
dual energy x-ray absorptiometry (n=32 965; 0.02 g/
cm
2change in femoral neck bone mineral density per
standard deviation increase in 25-hydroxy-vitamin
D). However, increased 25-hydroxy-vitamin D was
associated with a slight reduction in heel bone mineral
density estimated by ultrasonography (n=142 487;
−0.03 g/cm
2change in estimated bone mineral density
per standard deviation increase in 25-hydroxy-vitamin
on 31 January 2019 by guest. Protected by copyright.
http://www.bmj.com/
D). These results are consistent with our mendelian
randomisation findings of no causal effect of vitamin
D levels on fracture.
implications for clinicians
Our mendelian randomisation findings are relevant
to clinical care. Although clinical risk factors, when
used jointly in well validated prediction algorithms,
predict fracture risk, our findings are a reminder
that clinically relevant changes in most of these risk
factors are unlikely to result in large differences in
fracture risk. These findings also suggest clinical
outcomes such as fracture risk can be subject to bias
owing to uncontrolled confounding in observational
epidemiological studies. A strength of our study
design is that mendelian randomisation limits this
potential confounding, because alleles are essentially
assigned randomly at conception, and are therefore
not generally affected by confounders. Furthermore,
because allele assignment must precede fracture,
mendelian randomisation is not prone to bias due to
reverse causation. These findings provide guidance for
the design of future clinical trials on interventions that
are more likely to be successful in reducing fracture
risk.
Epidemiological studies have shown that older
people with a fracture will have abnormal bone
mineral density in the osteoporotic range (that is, T
score lower than −2.5 standard deviations), but most
will have a fracture will be osteopenic (T score between
−1 and −2.5 standard deviations). In fact, about
87% of women and 82% of men with a non-vertebral
fracture have a T score lower than −1.0.
69Our findings
suggest that low bone mineral density (not only after
reaching the osteoporotic range) constitutes a risk
factor that captures a substantial and causal part of the
influences that increase risk for all types of fracture.
Therefore, interventions targeting an increase in bone
mineral density (presuming this is associated with
improvements in bone structure or quality) are likely
to have pivotal roles in reducing fracture risk.
The interpretation of our findings merits
careful consideration for some of the risk factors.
Hyperthyroidism is an established risk factor for
fracture, and we have not used genetic determinants of
hyperthyroidism risk, but rather genetic determinants
of thyroid stimulating hormone level, which are likely
to be different. Moreover, our study described the
effect of clinical risk factors on fracture in the general
population, and is therefore not generalisable to states
or conditions of extreme circumstances known to cause
fracture (eg, sustained vitamin D deficiency, rickets, or
osteomalacia). Furthermore, our results apply only to
25-hydroxy-vitamin D, and might not necessarily reflect
effects of its active form, 1,25-dihydroxy-vitamin D.
However, vitamin D supplementation, as is commonly
used, acts by influencing 25-hydroxy-vitamin D.
Altogether, the course of action for effective fracture
prevention relies on establishing vitamin D deficiency
and seeking its correction, rather than the widespread
use of non-indicated ineffective supplementation.
Strengths and weaknesses of the study
To our knowledge, we have generated the largest
and most comprehensive assessment of the genetic
determinants of fracture risk so far. Moreover, use of
the largest GWAS datasets available enabled adequate
power to estimate the relation between genetically
modified risk factors and fracture. Our study also
had limitations. In our mendelian randomisation
approach, we were unable to account for the sample
overlap between the exposure and outcome GWAS
datasets. However, we used powerful instruments to
estimate the relation
39between the risk factors and
the outcomes. Therefore, any sample overlap should
not significantly bias our findings. Another potential
limitation was that the first release of the UK Biobank
selected some individuals based on a nested
case-control study of smoking and lung function,
70and is
therefore subject to selection bias.
71But after excluding
the UK Biobank from our analyses, we observed no
significant differences. Furthermore, the majority of
our cohorts were imputed to HapMap (instead of more
comprehensive reference panels), which could have
affected the number of identified loci. However, given
our power setting, our focus was mainly on common
variants (which are well characterised in the HapMap
imputation panel). In addition, analysis of large
cohorts (UK Biobank and EPIC-Norfolk) imputed to
more recent reference panels did not yield additional
genome wide significant loci.
Moreover, we could not assess several relevant
clinical risk factors. For example, body mass index
72-74could not be assessed in our mendelian randomisation
framework because all GWAS analyses of fracture
have been adjusted for body weight, preventing any
inference assessment on causality. We also lacked
power to estimate the casual relation between smoking
and alcohol consumption: two potentially key risk
factors for fracture. Similarly, we did not evaluate other
risk factors that were not modifiable (such as age, sex,
parental fracture history and body height), or those
that have not been assessed by GWAS to yield genetic
instruments for mendelian randomisation studies
(such as falls, which are likely to be an important
modifiable risk factor for fracture).
75Furthermore, factors unlikely to be predominantly
genetic in origin (eg, occupation) might still have a role
in the pathogenesis of fracture but could not be readily
assessed through our mendelian randomisation
approach. Nevertheless, proxy phenotypes for such risk
factors are increasingly been investigated by GWAS (eg,
education for occupation), and can be used as robust
instruments in future research. In addition, because
information on bone mineral density was not available
for all study participants who were investigated for
fracture, we could not determine directly the degree
to which bone mineral density mediated the effect
of genetic determinants on fracture risk. Mendelian
randomisation is a helpful method to minimise several
biases in observational studies, but the possibility of
residual pleiotropy could bias estimates in this study.
However, the likelihood of this bias is reduced because
on 31 January 2019 by guest. Protected by copyright.
http://www.bmj.com/
the mendelian randomisation-Egger regression test
showed no clear directional pleiotropy for most of the
factors. Lastly, because most of the study population
was of European ancestry, results should not be
directly generalised to other ethnicities.
Similarly, null results of a mendelian randomisation
study could be influenced by canalisation, which is
defined as compensatory feedback mechanisms that
cannot be taken into account.
76The possible influence
of the risk factors on fracture risk might be specifically
linked to their complications or management of the
disease, which we also could not take into account in
mendelian randomisation. As in most epidemiological
studies, mendelian randomisation also assumes
a linear relation between the risk factor and the
outcome, which might not invariably be the case for
all risk factors of fracture. Some risk factors, such as
vitamin D and estimated calcium intake, could have
non-linear threshold associations, as discussed above.
Furthermore, we could not account for the
dose-response association (eg, between the lactose variant
rs4988235 and dairy intake) within our design, or
differences in biological effects across different types of
grouped exposures (that is, fermented v non-fermented
types of dairy products). Finally, the non-significant
trend observed for vitamin D towards having increased
risk of fracture could be attributed to the selection
of healthy people (that is, participants with very low
levels of vitamin D and fracture, as well as those who
are older, frail, and physically impaired, could have
been under-represented in the studies included in
the GWAS meta-analyses). Therefore, the vitamin D
estimates of the current study cannot be generalised to
these groups of older people.
conclusion
From a study of over 500 000 individuals (about
185 000 fracture cases), we provide evidence that the
main genetic determinants of osteoporotic fracture
also influence bone mineral density, which was the
only clinical risk factor to have shown a major effect
on fracture risk among the study population assessed.
By contrast, we found that other genetically estimated
clinical risk factors for fracture, had either a very
modest or no effect on fracture risk in the general
population. Notably, genetic predisposition to lower
levels of vitamin D and estimated calcium intake
from dairy sources were not associated with fracture
risk. Our study confirms bone mineral density as a
pivotal cause of osteoporotic fracture and postulates
that, among all the clinical risk factors we evaluated,
interventions aimed at increasing bone mineral density
are likely to have the most clinically relevant effect on
fracture risk reduction.
autHOr aFFiliatiONS
1Department of Internal Medicine, Erasmus MC, University Medical
Center, Rotterdam, Netherlands
2Department of Epidemiology, Erasmus MC, University Medical
Center, Rotterdam, Netherlands
3Lady Davis Institute, Jewish General Hospital, McGill University,
Montréal, Québec, Canada
4Department of Human Genetics, McGill University, Montréal,
Québec, Canada
5DaP Lab, School of Life Sciences, Westlake University and Westlake
Institute for Advanced Study, Hangzhou, Zhejiang, China
6Institute of Aging Research and the Affiliated Hospital, School of
Medicine, Hangzhou Normal University, Hangzhou, Zhejiang, China
7Medical Research Council Integrative Epidemiology Unit, University
of Bristol, Bristol, UK
8University of Queensland Diamantina Institute, University of
Queensland, Translational Research Institute, Brisbane, Australia
9Institute for Aging Research, Hebrew SeniorLife, Harvard Medical
School, Boston, MA, USA
10Department of Medicine, Beth Israel Deaconess Medical Center
and Harvard Medical School, Boston, MA, USA
11Centre for Bone and Arthritis Research, Department of Internal
Medicine, Institute of Medicine, Sahlgrenska, Gothenburg, Sweden We thank all study participants for making this work possible; the many colleagues who contributed to collection and phenotypic characterisation of the clinical samples, as well as genotyping and analysis of the GWAS data; and the 23andMe research team. Part of this work was conducted using the UK Biobank resource. Full list of acknowledgments, funding organisations, and grants are listed per cohort in the supplemental material.
The following members of the GEFOS/GENOMOS consortium and the 23andMe research team are coauthors of this manuscript: Vincenzo Forgetta, Aaron Leong, Omar S Ahmad, Charles Laurin, Lauren E Mokry, Stephanie Ross, Cathy E Elks, Jack Bowden, Nicole M Warrington, Aaron Kleinman, Sara M Willems, Daniel Wright, Felix R Day, Anna Murray, Katherine S Ruth, Konstantinos K Tsilidis, Cheryl L Ackert-Bicknell, J H Duncan Bassett, Bram C J van der Eerden, Kaare M Gautvik, Sjur Reppe, Graham R Williams, Carolina Medina-Gómez, Karol Estrada, Najaf Amin, Joshua C Bis, Stephan Breda, Daniel I Chasman, Serkalem Demissie, Anke W Enneman, Yi-Hsiang Hsu, Thorvaldur Ingvarsson, Mika Kähönen, Candace Kammerer, Andrea Z Lacroix, Guo Li, Ching-Ti Liu, Yongmei Liu, Mattias Lorentzon, Reedik Mägi, Evelin Mihailov, Lili Mlani, Alireza Moayyeri, Carrie M Nielson, Nerea Alonso, Pack Chung Sham, Kristin Siggeirsdotir, Gunnar Sigurdsson, Unnur Thorsteinsdottir, Stella Trompet, Gudmar Thorleifsson, Liesbeth Vandenput, Nathalie van der Velde, Jorma Viikari, Su-Mei Xiao, Jing Hua Zhao, Kristina E Akesson, Marianne Andersen, Biljana Atanasovska, Susana Balcells, Joel Eriksson, Melissa M Formosa, Carmen Garcia-Ibarbia, Jesús Gonzalez-Macias, Natalia Garcia-Giralt, Goran Hallmans, Magnus Karlsson, Rita Khusainova, Beom-Jun Kim, Timothy C Y Kwok, Seung Hun Lee, Ping C Leung, Hans Mallmin, Laura Masi, Beatrice S Melin, Simona Mencej-Bedrac, Maria Nethander, José M Olmos, Panagoula Kollia, Janez Prezelj, Natasja M van Schoor, Olle Svensson, Pawel Szulc, Carmen Valero, Jean Woo, Maria Brandi, Sulin Cheng, Roland Chapurlat, Claus Christiansen, Cyrus Cooper, George Dedoussis, John A Eisman, Morten Frost, Sylvie Giroux, Daniel Grinberg, David Goltzman, Lynne J Hocking, Wim Van Hul, Jung-Min Koh, Lars Rejnmark, Jens-Erik B Jensen, Bente Langdahl, Joshua R Lewis, Roman S Lorenc, Elza Khusnutdinova,Janja Marc, Fiona E McGuigan, Dan Mellström, Karl Michaelsson, Xavier Nogues, Peter Nordström, Barbara Obermayer-Pietsch, Ulrika Pettersson-Kymmer, Richard L Prince, Jonathan Reeve, David M Reid, Jose A Riancho, Francois Rousseau, Nelson L S Tang, Angela Xuereb-Anastasi, William D Leslie, Daniel S Evans, Steven R Cummings, Jane Cauley, Cornelia M van Duijn, Matt Brown, Emma L Duncan, Lisette CPGM de Groot, Tonu Esko, Vilmundar Gudnason, Tamara B Harris, Rebecca D Jackson, J Wouter Jukema, M Arfan Ikram, David Karasik, Stephen Kaptoge, Kay-Tee Khaw, Annie Wai-Chee Kung, Terho Lehtimäki, Leo-Pekka Lyytikäinen, Paul Lips, Robert Luben, Andres Metspalu, Joyce B J van Meurs, Ryan L Minster, Eric Orwoll, Edwin Oei, Bruce M Psaty, Olli T Raitakari, Stuart H Ralston, Paul M Ridker, John A Robbins, Albert V Smith, Tim D Spector, Unnur Styrkarsdottir, Joseph Zmuda, Gregory J Tranah, Kari Stefansson, Andre G Uitterlinden, M Carola Zillikens, Evangelia E Ntzani, Evangelos Evangelou, John P A Ioannidis, John R B Perry, Joyce Y Tung, David A Hinds, Robert A Scott. Full details of the authorship, including job titles and affiliations, are included in the supplemental material.
23andMe research team: Michelle Agee, Babak Alipanahi, Adam Auton, Robert K Bell, Katarzyna Bryc, Sarah L Elson, Pierre Fontanillas, Nicholas A Furlotte, David A Hinds, Karen E Huber, Aaron Kleinman, Nadia K Litterman, Matthew H McIntyre, Joanna L Mountain, Elizabeth S Noblin, Carrie A M Northover, Steven J Pitts, J Fah Sathirapongsasuti, Olga V Sazonova, Janie F Shelton, Suyash Shringarpure, Chao Tian, Joyce Y Tung, Vladimir Vacic, and Catherine H Wilson.
on 31 January 2019 by guest. Protected by copyright.
http://www.bmj.com/
GEFOS/GENOMOS consortium: Vincenzo Forgetta, Aaron Leong, Omar S Ahmad, Charles Laurin, Lauren E Mokry, Stephanie Ross, Cathy E Elks, Jack Bowden, Nicole M Warrington, Sara M Willems, Daniel Wright, Felix R Day, Anna Murray, Katherine S Ruth, Konstantinos K Tsilidis, Cheryl L Ackert-Bicknell, J H Duncan Bassett, Bram C J van der Eerden, Kaare M Gautvik, Sjur Reppe, Graham R Williams, Carolina Medina-Gómez, Karol Estrada, Najaf Amin, Joshua C Bis, Stephan Breda, Daniel I Chasman, Serkalem Demissie, Anke W Enneman, Yi-Hsiang Hsu, Thorvaldur Ingvarsson, Mika Kähönen, Candace Kammerer, Andrea Z LaCroix, Guo Li, Ching-Ti Liu, Yongmei Liu, Mattias Lorentzon, Reedik Mägi, Evelin Mihailov, Lili Mlani, Alireza Moayyeri, Carrie M Nielson, Nerea Alonso, Pack Chung Sham, Kristin Siggeirsdotir, Gunnar Sigurdsson, Unnur Thorsteinsdottir, Stella Trompet, Gudmar Thorleifsson, Liesbeth Vandenput, Nathalie van der Velde, Jorma Viikari, Su-Mei Xiao, Jing Hua Zhao, Kristina E Akesson, Marianne Andersen, Biljana Atanasovska, Susana Balcells, Joel Eriksson, Melissa M Formosa, Carmen Garcia-Ibarbia, Jesús Gonzalez-Macias, Natalia Garcia-Giralt, Goran Hallmans, Magnus Karlsson, Rita Khusainova, Beom-Jun Kim, Timothy C Y Kwok, Seung Hun Lee, Ping C Leung, Hans Mallmin, Laura Masi, Beatrice S Melin, Simona Mencej-Bedrac, Maria Nethander, José M Olmos, Panagoula Kollia, Janez Prezelj, Natasja M van Schoor, Olle Svensson, Pawel Szulc, Carmen Valero, Jean Woo, Maria Brandi, Sulin Cheng, Roland Chapurlat, Claus Christiansen, Cyrus Cooper, George Dedoussis, John A Eisman, Morten Frost, Sylvie Giroux, Daniel Grinberg, David Goltzman, Lynne J Hocking, Wim Van Hul, Jung-Min Koh, Lars Rejnmark, Jens-Erik B Jensen, Bente Langdahl, Joshua R Lewis, Roman S Lorenc, Elza Khusnutdinova, Janja Marc, Fiona E McGuigan, Dan Mellström, Karl Michaelsson, Xavier Nogues, Peter Nordström, Barbara Obermayer-Pietsch, Ulrika Pettersson-Kymmer, Richard L Prince, Jonathan Reeve, David M Reid, Jose A Riancho, Francois Rousseau, Nelson L S Tang, Angela Xuereb-Anastasi, William D Leslie, Daniel S Evans, Steven R Cummings, Jane Cauley, Cornelia M van Duijn, Matt Brown, Emma L Duncan, Lisette CPGM. de Groot, Tonu Esko, Vilmundar Gudnason, Tamara B Harris, Rebecca D Jackson, J Wouter Jukema, M Arfan Ikram, David Karasik, Stephen Kaptoge, Kay-Tee Khaw, Annie Wai-Chee Kung, Terho Lehtimäki, Leo-Pekka Lyytikäinen, Paul Lips, Robert Luben, Andres Metspalu, Joyce B J van Meurs, Ryan L Minster, Eric Orwoll, Edwin Oei, Bruce M Psaty, Olli T Raitakari, Stuart H Ralston, Paul M Ridker, John A Robbins, Albert V Smith, Tim D Spector, Unnur Styrkarsdottir, Joseph Zmuda, Gregory J Tranah, Kari Stefansson, Andre G Uitterlinden, M Carola Zillikens, Evangelia E Ntzani, Evangelos Evangelou, John P A Ioannidis, John R B Perry, and Robert A Scott.
Contributors: KT, JAM, LO, H-FZ, JBR, and FRi designed the study. KT, LO, H-FZ, VF, NMW, AK, NAm, JCB, SBr, SD, AWE, Y-HH, TI, CK, GL, C-TL, YL, RM, EM, LMi, AM, CMN, NAl, PCS, KSi, GS, ST, GT, LV, JV, S-MX, JHZ, MA, BA, JE, MMF, CG-I, JG-M, NG-G, GH, MKa, RK, B-JK, TCYK, SHL, PCL, HM, LMa, BSM, SMB, MN, JMO, JP, NvS, OS, CV, JW, SC, RC, CCh, MF, SG, LJH, WVH, J-MK, LR, J-EBJ, JRL, RSL, FEM, DM, XN, PN, JR, WDL, DSE, DK, SK, TL, L-PL, RL, JBJvM, RLM, EOe, PMR, JAR, AVS, US, JZ, GJT, MCZ, and DME were involved in study specific phenotyping and data analysis. DIC, MKä, AZL, ML, KSt, NvdV, KA, SBa, PK, PS, MBra, CCo, GD, JAE, DGr, DGo, BL, EK, JM, KM, BO-P, UP-K, RLP, DMR, JAR, FRo, NLST, AX-A, SRC, JC, CMvD, MBro, ELD, LdG, TE, VG, TBH, RDJ, JWJ, MAI, K-TK, AWCK, PL, AMe, EOr, BMP, OTR, SHR, TDS, UT, AGU, JYT, DAH, DPK, CO, JBR, and FRi were involved with study specific coordination and management. KT, JAM, KE, KKT, EEN, EE, and JPAI did the meta-analysis. CLA-B, JHDB, BCJvdE, KMG, SR, GRW, and CM-G did the functional work. KT, JAM, H-FZ, DME, DPK, CO, JBR, FRi, VF, AL, OSA, CL, LEM, SR, CEE, JB, SMW, DW, FRD, AM, KSR, JRBP, and RAS did the mendelian randomisation analysis. KT, JAM, JBR, and FRi wrote the first draft. KT, JAM, LO, H-FZ, DME, DPK, CO, JBR, and FRi wrote the final version of the paper. All authors reviewed the manuscript, added appropriate revisions, agreed to submission for publication, and approved the final version. KT, JAM, LO, and H-FZ (first) are equal contributing authors, and DME, DPK, CO, JBR, and FRi (senior) are equal contributing authors. FRi and JBR are the guarantors. The corresponding authors attest that all listed authors meet authorship criteria and that no others meeting the criteria have been omitted.
Funding: This research and the Genetic Factors for Osteoporosis (GEFOS) consortium have been funded by the European Commission (HEALTH-F2-2008-201865-GEFOS). AGES: NIH contract N01-AG-12100 and NIA Intramural Research Program, Hjartavernd (the Icelandic Heart Association), and Althingi (the Icelandic Parliament). Icelandic Heart Association. Anglo-Australasian Osteoporosis Genetics Consortium (AOGC): National Health and Medical Research Council (Australia) (grant reference 511132). Australian Cancer Research Foundation and Rebecca Cooper Foundation (Australia). National Health and Medical Research Council (Australia). National Health and
Medical Research Council (Australia) Career Development Award (569807). Medical Research Council New Investigator Award (MRC G0800582). Health Research Council of New Zealand. Sanofi-Aventis, Eli Lilly, Novartis, Pfizer, Proctor & Gamble Pharmaceuticals and Roche. National Health and Medical Research Council, Australia. Australian National Health and Medical Research Council, MBF Living Well foundation, the Ernst Heine Family Foundation and from untied educational grants from Amgen, Eli Lilly International, GE-Lunar, Merck Australia, Novartis, Sanofi-Aventis Australia and Servier. Medical Research Council UK and Arthritis Research UK. The Victorian Health Promotion Foundation and the Geelong Region Medical Research Foundation, and the National Health and Medical Research Council, Australia (project grant 628582). Action Research UK. DME is supported by an Australian Research Council Future Fellowship (FT130101709). This work was supported by a Medical Research Council programme grant (MC_UU_12013/4).. B-Vitamins for the PRevention Of Osteoporotic Fractures (BPROOF) study: supported and funded so far by The Netherlands Organisation for Health Research and Development (ZonMw, grant 6130.0031), The Hague; unrestricted grant from NZO (Dutch Dairy Association), Zoetermeer; Orthica, Almere; Netherlands Consortium Healthy Ageing (NCHA) Leiden/Rotterdam; Ministry of Economic Affairs, Agriculture and Innovation (project KB-15-004-003), The Hague; Wageningen University, Wageningen; VUmc, Amsterdam; Erasmus Medical Center, Rotterdam. Cardiovascular Health Study (CHS): National Heart Lung and Blood Institute (NHLBI) contracts HHSN268201200036C, HHSN268200800007C, N01HC55222, N01HC85079, N01HC85080, N01HC85081, N01HC85082, N01HC85083, N01HC85086; and NHLBI grants U01HL080295, R01HL087652, R01HL105756, R01HL103612, R01HL120393, and R01HL130114 with additional contribution from the National Institute of Neurological Disorders and Stroke (NINDS). Additional support was provided through R01AG023629 from the National Institute on Ageing (NIA). Genotyping supported in part by the National Center for Advancing Translational Sciences, CTSI grant UL1TR000124, and the National Institute of Diabetes and Digestive and Kidney Disease Diabetes Research Center (DRC) grant DK063491 to the Southern California Diabetes Endocrinology Research Center. deCODE Genetics. EPIC-Norfolk: Medical Research Council G9321536 and G9800062, MAFF AN0523, EU FP5 (QLK6-CT-2002-02629), Food Standards Agency N05046, GEFOS EU FP7 Integrated Project Grant Reference: 201865, The UK’s National Institute for Health Research (NIHR) Biomedical Research Centre Grant to Cambridge contributed to the costs of genotyping. Estonian Genome Center University of Tartu (EGCUT): This study was supported by EU H2020 grants 692145, 676550, 654248, Estonian Research Council Grant IUT20-60, NIASC and EIT—Health and EU through the European Regional Development Fund (project No 2014-2020.4.01.15-0012 GENTRANSMED). Erasmus Rucphen Family Study (ERF): Netherlands Organisation for Scientific Research (NWO), Erasmus University Medical Centre, the Centre for Medical Systems Biology (CMSB1 and CMSB2) of the Netherlands Genomics Initiative (NGI). Framingham Osteoporosis Study (FOS): National Institute for Arthritis, Musculoskeletal and Skin Diseases and National Institute on Ageing (R01 AR41398; DPK and R01 AR 050066; DK National Heart, Lung, and Blood Institute’s Framingham Heart Study (N01-HC-25195) and its contract with Affymetrix for genotyping services (N02-HL-6-4278). The Gothenburg Osteoporosis and Obesity Determinan Study (GOOD): Swedish Research Council (K2010-54X-09894-19-3, 2006-3832 and K2010-52X-20229-05-3), Swedish Foundation for Strategic Research, ALF/LUA research grant in Gothenburg, Lundberg Foundation, Torsten and Ragnar Söderberg’s Foundation, Västra Götaland Foundation, Göteborg Medical Society, Novo Nordisk Foundation, and European Commission grant HEALTH-F2-2008-201865-GEFOS. Health Aging and Body Composition Study (HealthABC): the Intramural Research Program of the National Institute of Health (NIH), National Institute on Ageing. US National Institute of Ageing (NIA) contracts N01AG62101, N01AG62103, and N01AG62106. NIA grant 1R01AG032098. The Center for Inherited Disease Research (CIDR). National Institutes of Health contract number HHSN268200782096C. Hong Kong Osteoporosis Study (HKOS): Hong Kong Research Grant Council (HKU 768610M); Bone Health Fund of HKU Foundation; KC Wong Education Foundation; Small Project Funding (201007176237); Matching Grant, Committee on research and conference (CRCG) Grant and Osteoporosis and Endocrine Research Fund; and the Genomics Strategic Research Theme of the University of Hong Kong. The Osteoporotic Fractures in Men (MrOS) Study is supported by National Institutes of Health funding. The following institutes provide support: National Institute of Arthritis and Musculoskeletal and Skin Diseases (NIAMS), National